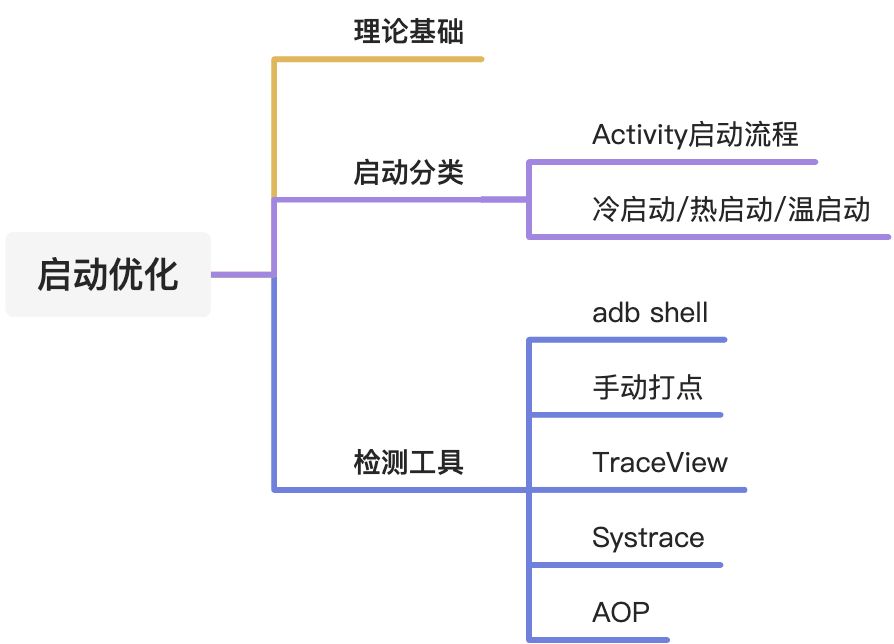
↓启动分类↓
冷启动
启动速度最慢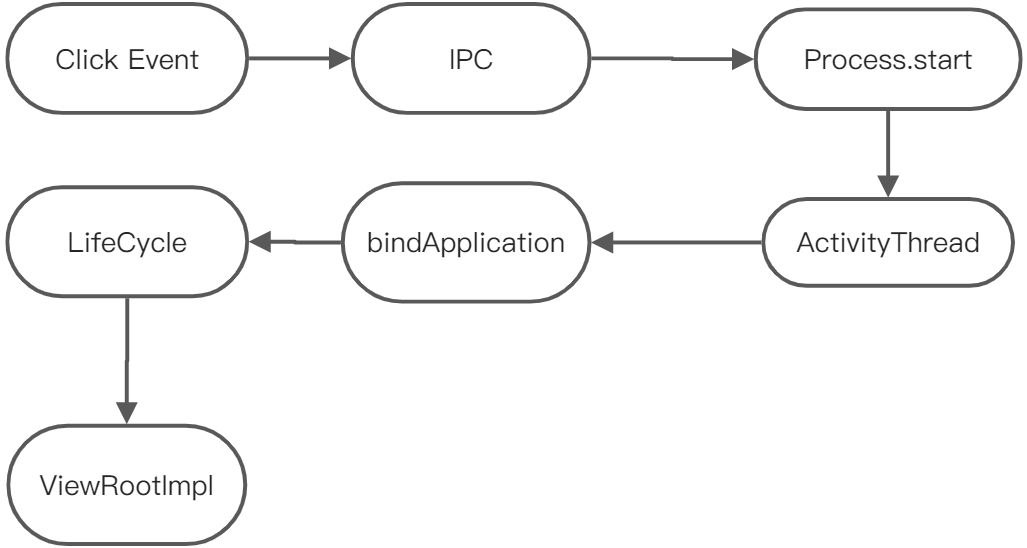
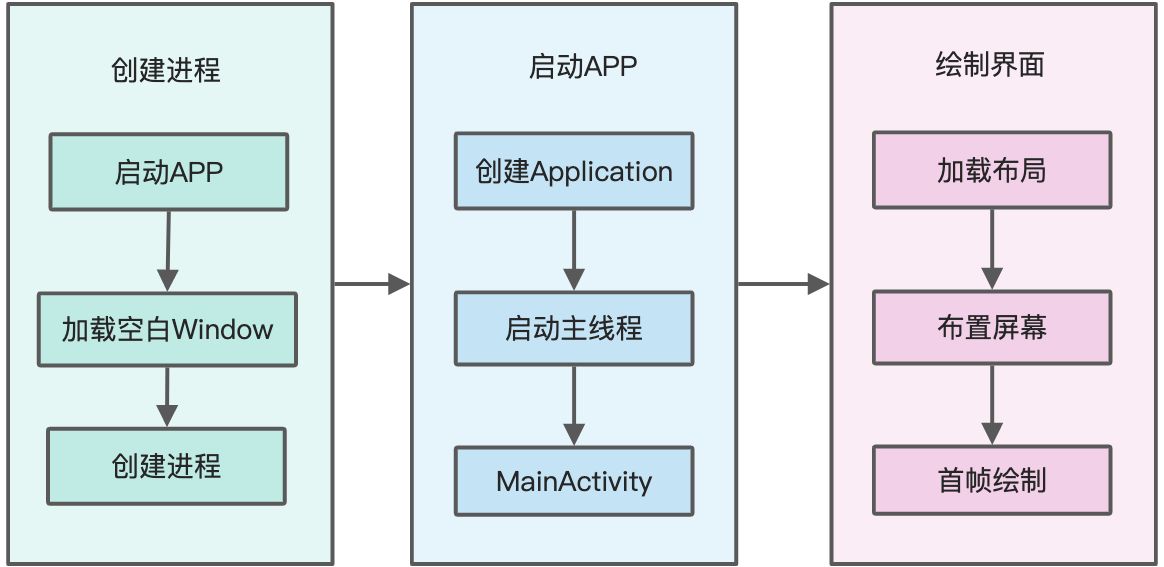
启动之前
启动APP -> 加载空白Window -> 创建进程
随后任务
创建Application -> 启动主线程 -> 创建MainActivity
热启动
启动速度最快
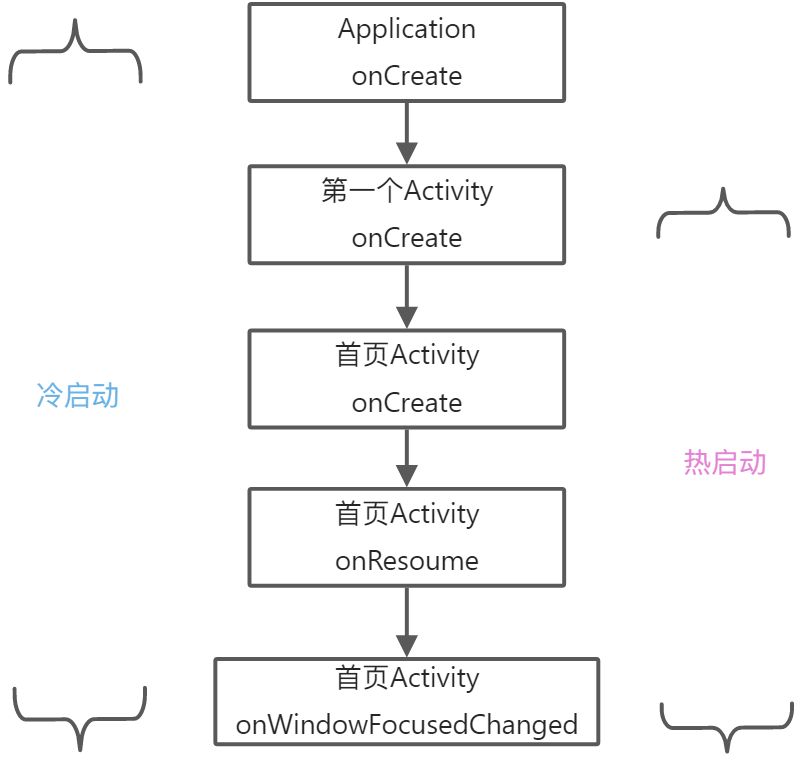
温启动
较快, 只会走生命周期
↓检测工具↓
adb shell
adb shell 回车 进入adb shell里面, 输入am start -W applicationId/启动Activity的绝对路径
adb shell am start -W applicationId/启动Activity的绝对路径
输出时间含义
ThisTime: 1118 最后一个Activity启动耗时
TotalTime: 1118 所有Activity启动耗时
WaitTime: 1137 AMS启动Activity的总耗时
WaitTime > TotalTime > ThisTime
缺点
时间不精确, 仅供参考
手动打点
Activity首帧时间: onWindowFocusChanged首帧时间, 并不是用户看到的显示数据的时间
手动打点缺点明显, 代码量大, 代码侵入强
TraceView
输入
class App : Application() {override fun onCreate() {super.onCreate()Debug.startMethodTracing("start-perform")// 省略初始化SDK相关代码Debug.stopMethodTracing()}}
输出
AS侧面工具栏DeviceFileExplore
sdcard -> Android -> data -> 自己的包名 -> files -> start-perform.trace -> 双击即可在Profiler中查看
文件中包含的信息
线程执行时间, 方法调用链
运行时开销大, 因为会获取所有的方法执行时间, 不建议线上使用.
Systrace
systrace通过python脚本执行生成html文档。
class App : Application() {override fun onCreate() {super.onCreate()Trace.beginSection("start-perform")// 省略初始化SDK相关代码Trace.endSection()}}
python systrace.py -t 10 [] []
使用示例
python /Users/laychv/Library/Android/sdk/platform-tools/systrace/systrace.py -t 20 sched gfx view wm am app webview -a “com.start.perforn” -o ~/Documents/open-project/systrace_data/startperform.html
通过html文档获取重点数据
Wall Duration: 代码执行时间
CPU Duration: 代码消耗CPU时间
AOP
lancet 轻量级AOP
aspectj 沪江支持kotlin

若有收获,就点个赞吧
0 人点赞
