介绍
Seaborn库是开源库并且代码托管在GitHub上
Seaborn库
代码托管地址
Seaborn库中的kdeplot方法是用来打印核密度图(概率密度图)的
Seaborn是这么介绍这个方法的:
Fit and plot a univariate or bivariate kernel density estimate.
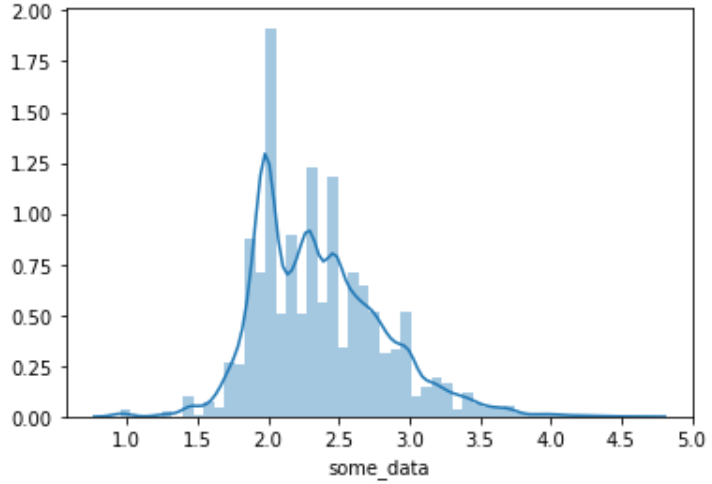
做直方图或概率密度图使都会用到这个方法
import seaborn as snssns.distplot(data)
import seaborn as snssns.kdeplot(data)
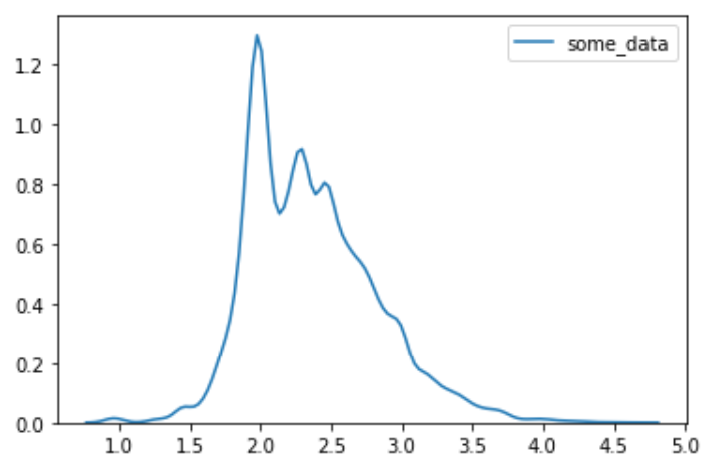
平时作图的时候都是只见曲线不见数值,因此对概率密度曲线是怎么计算的很好奇。
今天就通过Seaborn的源码来看看概率密度曲线是怎么画出来的吧
解读
Seabron项目在GitHub中的样子,其中主要代码都在seaborn文件夹下了。
文件的命名很直观,直方图与核密度图的代码大概就在seaborn中的distributions.py中
**
kdeplot()
找到kdeplot定义的位置
@_deprecate_positional_argsdef kdeplot(*,x=None, y=None,shade=False, vertical=False, kernel="gau",bw="scott", gridsize=100, cut=3, clip=None, legend=True,cumulative=False, shade_lowest=True, cbar=False, cbar_ax=None,cbar_kws=None, ax=None,data=None, data2=None, # TODO move data once * is enforced**kwargs,):
**
首先,一堆参数用到再说
x_passed_as_data = (x is Noneand data is not Noneand np.ndim(data) == 1)if x_passed_as_data:x = data
如果传入的data是1维的并且参数x保持默认值None,那么将data赋值给x
if data2 is not None:msg = "The `data2` param is now named `y`; please update your code."warnings.warn(msg)y = data2
如果data2不为None那么发一个警告,将data2赋值给y
if isinstance(x, list):x = np.asarray(x)if isinstance(y, list):y = np.asarray(y)
如果x、y的数据类型为list那么将数据转变为numpy.array类型
bivariate = x is not None and y is not Noneif bivariate and cumulative:raise TypeError("Cumulative distribution plots are not""supported for bivariate distributions.")
如果x、y都存在并且cumulative为真时报错。
前面作的核密度图是1维的,只有x的值不为None,因此bivariate为False
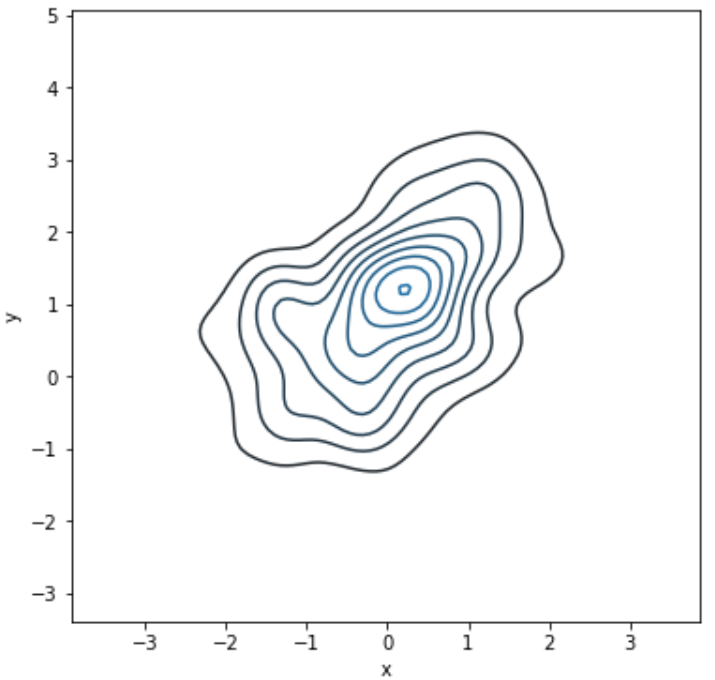
因为如果x、y都存在那么画出的图类似等高线形式的分布图,与累计分布的形式不兼容
例如:
mean, cov = [0, 1], [(1, .5), (.5, 1)]data = np.random.multivariate_normal(mean, cov, 200)df = pd.DataFrame(data, columns=["x", "y"])f, ax = plt.subplots(figsize=(6, 6))sns.kdeplot(df.x, df.y, ax=ax)
回到Seaborn的代码
if ax is None:ax = plt.gca()if bivariate:ax = _bivariate_kdeplot(x, y, shade, shade_lowest,kernel, bw, gridsize, cut, clip, legend,cbar, cbar_ax, cbar_kws, ax, **kwargs)else:ax = _univariate_kdeplot(x, shade, vertical, kernel, bw,gridsize, cut, clip, legend, ax,cumulative=cumulative, **kwargs)return ax
首先为作图做了一下准备。
然后根据bivariate的值决定是二元kde作图还是一元的kde作图。
由于bivariate为False,因此调用一元kde的函数_univariate_kdeplot。
_univariate_kdeplot()
_univariate_kdeplot在同文件中
def _univariate_kdeplot(data, shade, vertical, kernel, bw, gridsize, cut,clip, legend, ax, cumulative=False, **kwargs):
又是一堆参数
# Sort out the clippingif clip is None:clip = (-np.inf, np.inf)# Preprocess the datadata = remove_na(data)
第一句是如果clip没有设置就给了clip一个默认值
第二句的作用是去除na值
下面进入计算概率密度曲线的代码了
# Calculate the KDEif np.nan_to_num(data.var()) == 0:# Don't try to compute KDE on singular datamsg = "Data must have variance to compute a kernel density estimate."warnings.warn(msg, UserWarning)x, y = np.array([]), np.array([])elif _has_statsmodels:# Prefer using statsmodels for kernel flexibilityx, y = _statsmodels_univariate_kde(data, kernel, bw,gridsize, cut, clip,cumulative=cumulative)else:# Fall back to scipy if missing statsmodelsif kernel != "gau":kernel = "gau"msg = "Kernel other than `gau` requires statsmodels."warnings.warn(msg, UserWarning)if cumulative:raise ImportError("Cumulative distributions are currently ""only implemented in statsmodels. ""Please install statsmodels.")x, y = _scipy_univariate_kde(data, bw, gridsize, cut, clip)
代码是一个分支结构
np.nan_to_num的作用是
Replace NaN with zero and infinity with large finite numbers.
目的是防止数据中都是相同的值。
_has_statsmodels的定义是
try:import statsmodels.nonparametric.api as smnp_has_statsmodels = Trueexcept ImportError:_has_statsmodels = False
我的环境里是有statsmodels包的因此进入第二个分支,否则进入第三个分支,使用scipy包来作为后端。
接下来进入_statsmodels_univariate_kde函数
_statsmodels_univariate_kde()
用statsmodels包来计算kde
def _statsmodels_univariate_kde(data, kernel, bw, gridsize, cut, clip,cumulative=False):"""Compute a univariate kernel density estimate using statsmodels."""
一堆参数
# statsmodels 0.8 fails on int type datadata = data.astype(np.float64)fft = kernel == "gau"
第一句,是避免0.8版本对int数据的报错
第二句,如果使用的是高斯核则使用快速傅里叶变换加快计算速度。
kde = smnp.KDEUnivariate(data)try:kde.fit(kernel, bw, fft, gridsize=gridsize, cut=cut, clip=clip)except RuntimeError as err: # GH#1990if stats.iqr(data) > 0:raise errmsg = "Default bandwidth for data is 0; skipping density estimation."warnings.warn(msg, UserWarning)return np.array([]), np.array([])if cumulative:grid, y = kde.support, kde.cdfelse:grid, y = kde.support, kde.densityreturn grid, y
接下来就是用数据fit一个概率密度曲线了。
我们找到前面的这些fit参数,
试一下直接fit我们的数据会得到什么数据。
kernel = 'gau'bw = 'scott'fft = Truegridsize = 100cut = 3clip = (-np.inf, np.inf)kde = smnp.KDEUnivariate(data)kde.fit(kernel, bw, fft, gridsize=gridsize, cut=cut, clip=clip)grid, y = kde.support, kde.densityplt.plot(grid,y)
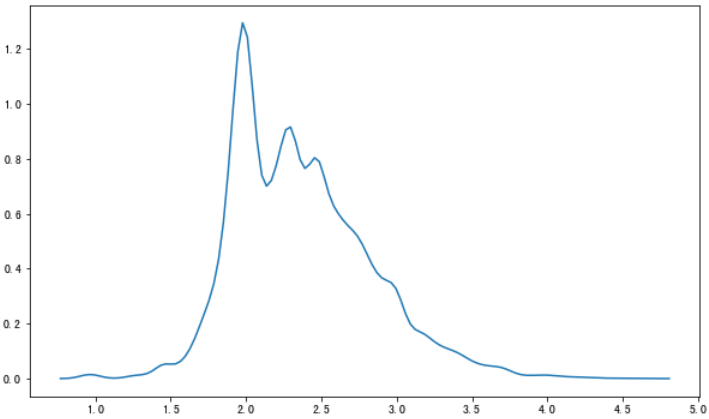
🆗,到现在我们已经知道了概率密度曲线是怎么计算的了。
可以尝试一下改变参数会有什么变化。
其中,gridsize控制拟合点的数量,值越大曲线会越平滑。
_univariate_kdeplot()的绘图部分
接下来就是对数据的简单处理、验证跟绘图部分了,就不细说了。
# Make sure the density is nonnegativey = np.amax(np.c_[np.zeros_like(y), y], axis=1)# Flip the data if the plot should be on the y axisif vertical:x, y = y, x# Check if a label was specified in the calllabel = kwargs.pop("label", None)# Otherwise check if the data object has a nameif label is None and hasattr(data, "name"):label = data.name# Decide if we're going to add a legendlegend = label is not None and legendlabel = "_nolegend_" if label is None else label# Use the active color cycle to find the plot colorfacecolor = kwargs.pop("facecolor", None)line, = ax.plot(x, y, **kwargs)color = line.get_color()line.remove()kwargs.pop("color", None)facecolor = color if facecolor is None else facecolor# Draw the KDE plot and, optionally, shadeax.plot(x, y, color=color, label=label, **kwargs)shade_kws = dict(facecolor=facecolor,alpha=kwargs.get("alpha", 0.25),clip_on=kwargs.get("clip_on", True),zorder=kwargs.get("zorder", 1),)if shade:if vertical:ax.fill_betweenx(y, 0, x, **shade_kws)else:ax.fill_between(x, 0, y, **shade_kws)# Set the density axis minimum to 0if vertical:ax.set_xlim(0, auto=None)else:ax.set_ylim(0, auto=None)# Draw the legend herehandles, labels = ax.get_legend_handles_labels()if legend and handles:ax.legend(loc="best")return ax

