图表x轴滚动条无法滚动问题
文档演示地址:https://f2.antv.vision/zh/examples/line/multiple#series
删除不相干代码,最后调整如下,结果滚动条不见了?
import React, { useEffect, useRef } from 'react';import ReactDOM from 'react-dom';import { Chart } from "@antv/f2";const ScrollBar = require('@antv/f2/lib/plugin/scroll-bar');require('@antv/f2/lib/interaction/pan');import './index.less';// 获取设备像素比:高清方案下不模糊export const WINDOW_DEVICE_PIXEL_RATIO = window.devicePixelRatio;// 字体大小export const FONT_SIZE = 14 * WINDOW_DEVICE_PIXEL_RATIO;// 数据源const list = [{type: "黄金",date: "02-28",value: 17},{type: "白银",date: "02-28",value: 17},{type: "黄金",date: "02-27",value: 23},{type: "白银",date: "02-27",value: 23},{type: "黄金",date: "02-26",value: 11},{type: "白银",date: "02-26",value: 11},{type: "黄金",date: "02-25",value: 26},{type: "白银",date: "02-25",value: 26},{type: "黄金",date: "02-24",value: 21},{type: "白银",date: "02-24",value: 21},{type: "黄金",date: "02-23",value: 18},{type: "白银",date: "02-23",value: 18},{type: "黄金",date: "02-22",value: 22},{type: "白银",date: "02-22",value: 22},{type: "黄金",date: "02-21",value: 18},{type: "白银",date: "02-21",value: 18},{type: "黄金",date: "02-20",value: 5},{type: "白银",date: "02-20",value: 5},{type: "黄金",date: "02-19",value: 25},{type: "白银",date: "02-19",value: 25},{type: "黄金",date: "02-18",value: 30},{type: "白银",date: "02-18",value: 30},{type: "黄金",date: "02-17",value: 15},{type: "白银",date: "02-17",value: 15},{type: "黄金",date: "02-16",value: 20},{type: "白银",date: "02-16",value: 20},{type: "黄金",date: "02-15",value: 10},{type: "白银",date: "02-15",value: 10}];function App() {let chartRefCurrent = useRef<any>()?.current || {};const fetchChart = () => {chartRefCurrent = new Chart({id: 'line-chart',pixelRatio: window.devicePixelRatio,plugins: [ScrollBar],});chartRefCurrent.source(list.reverse());chartRefCurrent.legend({itemWidth: null,align: 'center',nameStyle: {fontSize: FONT_SIZE,fill: '#333',},});chartRefCurrent.scale({date: {mask: "MM-DD",values: ["02-15", "02-16", "02-17", "02-18", "02-19"]},value: {tickCount: 6,},});chartRefCurrent.legend({itemWidth: null,align: 'center',nameStyle: {fontSize: FONT_SIZE,},});chartRefCurrent.axis('date', {label() {return {fontSize: FONT_SIZE,};},});chartRefCurrent.axis('value', {label() {return {fontSize: FONT_SIZE,};},});chartRefCurrent.scrollBar();chartRefCurrent.interaction('pan');chartRefCurrent.line().position('date*value').color('type');chartRefCurrent.render();};useEffect(() => {fetchChart();}, []);return (<div className="page"><div className="line-chart-container"><canvas id="line-chart" /></div></div>);}ReactDOM.render(<App />, document.getElementById('app'));
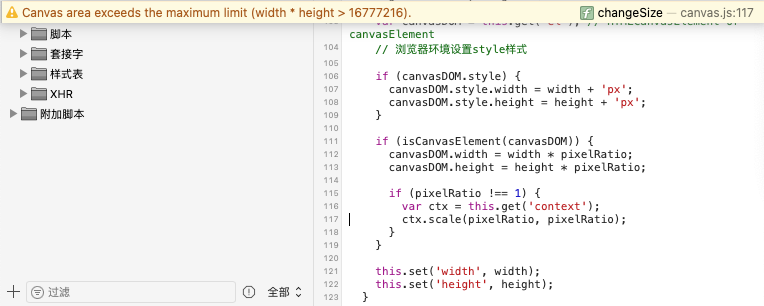
支付宝端内canvas内存超限
问题复现步骤
在没有定width和height情况下如图所示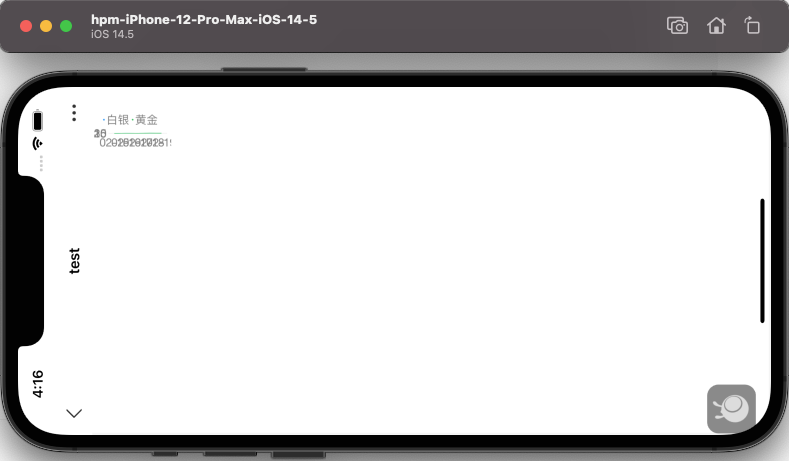
import React, { useEffect, useRef } from 'react';import ReactDOM from 'react-dom';import { Chart } from '@antv/f2/es/index';import ScrollBar from '@antv/f2/es/plugin/scroll-bar';import '@antv/f2/es/interaction/pan';import './index.less';// 获取设备像素比:高清方案下不模糊export const WINDOW_DEVICE_PIXEL_RATIO = window.devicePixelRatio;// 字体大小export const FONT_SIZE = 14 * WINDOW_DEVICE_PIXEL_RATIO;// 数据源const list = [{type: "黄金",date: "02-28",value: 17},{type: "白银",date: "02-28",value: 17},{type: "黄金",date: "02-27",value: 23},{type: "白银",date: "02-27",value: 23},{type: "黄金",date: "02-26",value: 11},{type: "白银",date: "02-26",value: 11},{type: "黄金",date: "02-25",value: 26},{type: "白银",date: "02-25",value: 26},{type: "黄金",date: "02-24",value: 21},{type: "白银",date: "02-24",value: 21},{type: "黄金",date: "02-23",value: 18},{type: "白银",date: "02-23",value: 18},{type: "黄金",date: "02-22",value: 22},{type: "白银",date: "02-22",value: 22},{type: "黄金",date: "02-21",value: 18},{type: "白银",date: "02-21",value: 18},{type: "黄金",date: "02-20",value: 5},{type: "白银",date: "02-20",value: 5},{type: "黄金",date: "02-19",value: 25},{type: "白银",date: "02-19",value: 25},{type: "黄金",date: "02-18",value: 30},{type: "白银",date: "02-18",value: 30},{type: "黄金",date: "02-17",value: 15},{type: "白银",date: "02-17",value: 15},{type: "黄金",date: "02-16",value: 20},{type: "白银",date: "02-16",value: 20},{type: "黄金",date: "02-15",value: 10},{type: "白银",date: "02-15",value: 10}];function App() {let chartRefCurrent = useRef<any>()?.current || {};const fetchChart = () => {chartRefCurrent = new Chart({id: 'line-chart',pixelRatio: window.devicePixelRatio,plugins: [ScrollBar],});chartRefCurrent.source(list.reverse());chartRefCurrent.legend({itemWidth: null,align: 'center',nameStyle: {fontSize: FONT_SIZE,fill: '#333',},});chartRefCurrent.scale({date: {mask: "MM-DD",values: ["02-15", "02-16", "02-17", "02-18", "02-19"]},value: {tickCount: 6,},});chartRefCurrent.legend({itemWidth: null,align: 'center',nameStyle: {fontSize: FONT_SIZE,},});chartRefCurrent.axis('date', {label() {return {fontSize: FONT_SIZE,};},});chartRefCurrent.axis('value', {label() {return {fontSize: FONT_SIZE,};},});chartRefCurrent.scrollBar();chartRefCurrent.interaction('pan');chartRefCurrent.line().position('date*value').color('type');chartRefCurrent.render();};useEffect(() => {fetchChart();}, []);return (<div className="page"><div className="line-chart-container"><canvas id="line-chart" /></div></div>);}ReactDOM.render(<App />, document.getElementById('app'));
然后给canvas自定义width和height时如图所示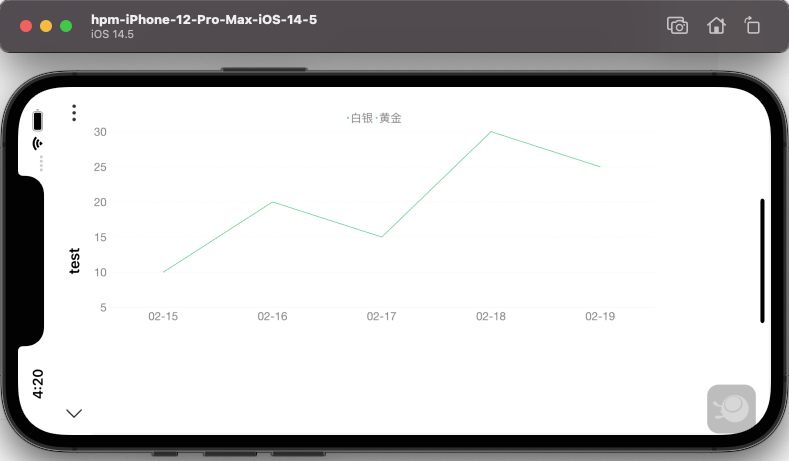
import { Chart } from '@antv/f2/es/index';// ...chartRefCurrent = new Chart({id: 'line-chart',pixelRatio: window.devicePixelRatio,width: 2100,height: 800,plugins: [ScrollBar],});
但这并不符合横屏展示的预期效果,因为没有铺满整个区域,然后继续给canvas自定义width和height加大时如图所示,发现图表不见了???
然后看控制台得知,是canvas内存超限了
canvas大小限制:https://stackoverflow.com/questions/6081483/maximum-size-of-a-canvas-element
这时需要销毁canvas
import { Chart } from '@antv/f2/es/index';// ...chartRefCurrent = new Chart({id: 'line-chart',width: 0, // 宽度height: 0, // 高度});
图表也确实出来了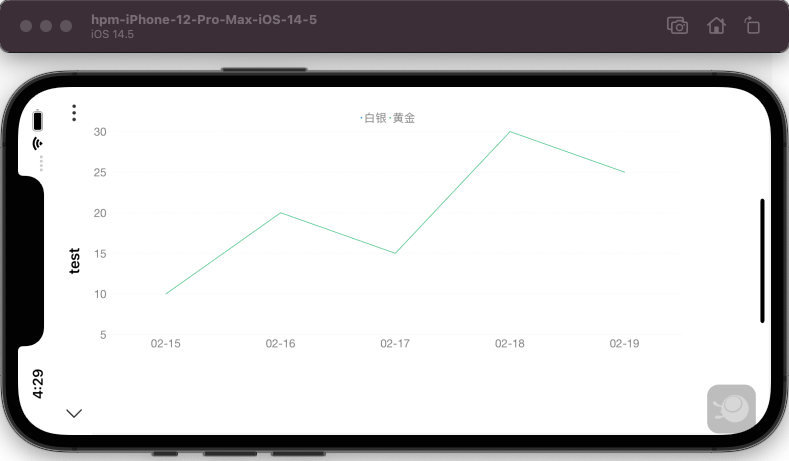
然后再让它铺满,也确实铺满了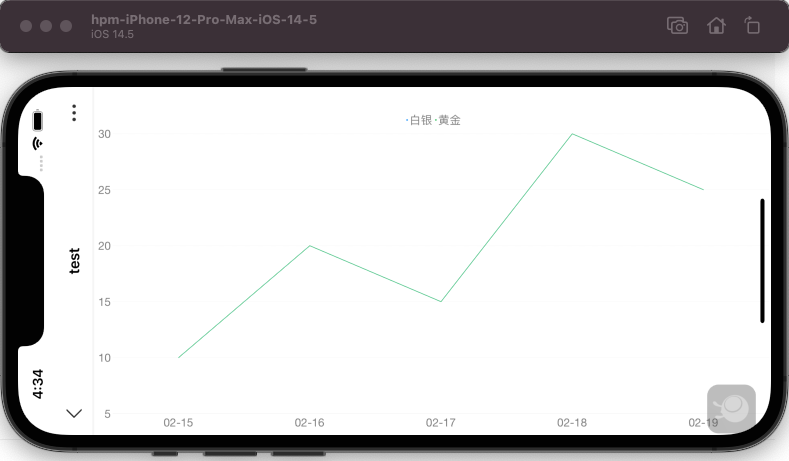
import { Chart } from '@antv/f2/es/index';// ...chartRefCurrent = new Chart({id: 'line-chart',pixelRatio: window.devicePixelRatio,width: window.innerHeight,height: window.innerWidth - 100,plugins: [ScrollBar],});
此时再回去看控制台,还是有警告,不过图表能正常展示出来
从代码角度来看,估计这样还是存在隐患的,经过排查与图表库作者确认,是因为宽高太大原因,然后导致白屏(因为无法渲染出来)Why?这个属于IOS系统限制,与f2没有关系

若有收获,就点个赞吧
0 人点赞
