部署
安装
采用rpm包的安装方式,直接去官网下载Kibana的rpm安装包并上传至服务器上
yum install -y kibana-7.13.4-x86_64.rpmsystemctl enable kibana
配置
[root@elastic-01 ~]# cat /etc/kibana/kibana.yml# Kibana is served by a back end server. This setting specifies the port to use.server.port: 5601# Specifies the address to which the Kibana server will bind. IP addresses and host names are both valid values.# The default is 'localhost', which usually means remote machines will not be able to connect.# To allow connections from remote users, set this parameter to a non-loopback address.server.host: 0.0.0.0# Enables you to specify a path to mount Kibana at if you are running behind a proxy.# Use the `server.rewriteBasePath` setting to tell Kibana if it should remove the basePath# from requests it receives, and to prevent a deprecation warning at startup.# This setting cannot end in a slash.#server.basePath: ""# Specifies whether Kibana should rewrite requests that are prefixed with# `server.basePath` or require that they are rewritten by your reverse proxy.# This setting was effectively always `false` before Kibana 6.3 and will# default to `true` starting in Kibana 7.0.#server.rewriteBasePath: false# Specifies the public URL at which Kibana is available for end users. If# `server.basePath` is configured this URL should end with the same basePath.#server.publicBaseUrl: ""# The maximum payload size in bytes for incoming server requests.#server.maxPayload: 1048576# The Kibana server's name. This is used for display purposes.#server.name: "your-hostname"# The URLs of the Elasticsearch instances to use for all your queries.elasticsearch.hosts: ["http://10.0.0.51:9200"]# Kibana uses an index in Elasticsearch to store saved searches, visualizations and# dashboards. Kibana creates a new index if the index doesn't already exist.#kibana.index: ".kibana"# The default application to load.#kibana.defaultAppId: "home"# If your Elasticsearch is protected with basic authentication, these settings provide# the username and password that the Kibana server uses to perform maintenance on the Kibana# index at startup. Your Kibana users still need to authenticate with Elasticsearch, which# is proxied through the Kibana server.#elasticsearch.username: "kibana_system"#elasticsearch.password: "pass"# Enables SSL and paths to the PEM-format SSL certificate and SSL key files, respectively.# These settings enable SSL for outgoing requests from the Kibana server to the browser.#server.ssl.enabled: false#server.ssl.certificate: /path/to/your/server.crt#server.ssl.key: /path/to/your/server.key# Optional settings that provide the paths to the PEM-format SSL certificate and key files.# These files are used to verify the identity of Kibana to Elasticsearch and are required when# xpack.security.http.ssl.client_authentication in Elasticsearch is set to required.#elasticsearch.ssl.certificate: /path/to/your/client.crt#elasticsearch.ssl.key: /path/to/your/client.key# Optional setting that enables you to specify a path to the PEM file for the certificate# authority for your Elasticsearch instance.#elasticsearch.ssl.certificateAuthorities: [ "/path/to/your/CA.pem" ]# To disregard the validity of SSL certificates, change this setting's value to 'none'.#elasticsearch.ssl.verificationMode: full# Time in milliseconds to wait for Elasticsearch to respond to pings. Defaults to the value of# the elasticsearch.requestTimeout setting.#elasticsearch.pingTimeout: 1500# Time in milliseconds to wait for responses from the back end or Elasticsearch. This value# must be a positive integer.#elasticsearch.requestTimeout: 30000# List of Kibana client-side headers to send to Elasticsearch. To send *no* client-side# headers, set this value to [] (an empty list).#elasticsearch.requestHeadersWhitelist: [ authorization ]# Header names and values that are sent to Elasticsearch. Any custom headers cannot be overwritten# by client-side headers, regardless of the elasticsearch.requestHeadersWhitelist configuration.#elasticsearch.customHeaders: {}# Time in milliseconds for Elasticsearch to wait for responses from shards. Set to 0 to disable.#elasticsearch.shardTimeout: 30000# Logs queries sent to Elasticsearch. Requires logging.verbose set to true.#elasticsearch.logQueries: false# Specifies the path where Kibana creates the process ID file.#pid.file: /run/kibana/kibana.pid# Enables you to specify a file where Kibana stores log output.#logging.dest: stdoutlogging.dest: /var/log/kibana/kibana.log# Set the value of this setting to true to suppress all logging output.#logging.silent: false# Set the value of this setting to true to suppress all logging output other than error messages.#logging.quiet: false# Set the value of this setting to true to log all events, including system usage information# and all requests.#logging.verbose: false# Set the interval in milliseconds to sample system and process performance# metrics. Minimum is 100ms. Defaults to 5000.#ops.interval: 5000# Specifies locale to be used for all localizable strings, dates and number formats.# Supported languages are the following: English - en , by default , Chinese - zh-CN .i18n.locale: "zh-CN"
启动
systemctl start kibana
界面配置
登录
浏览器登录kibana界面,http://10.0.0.51:5601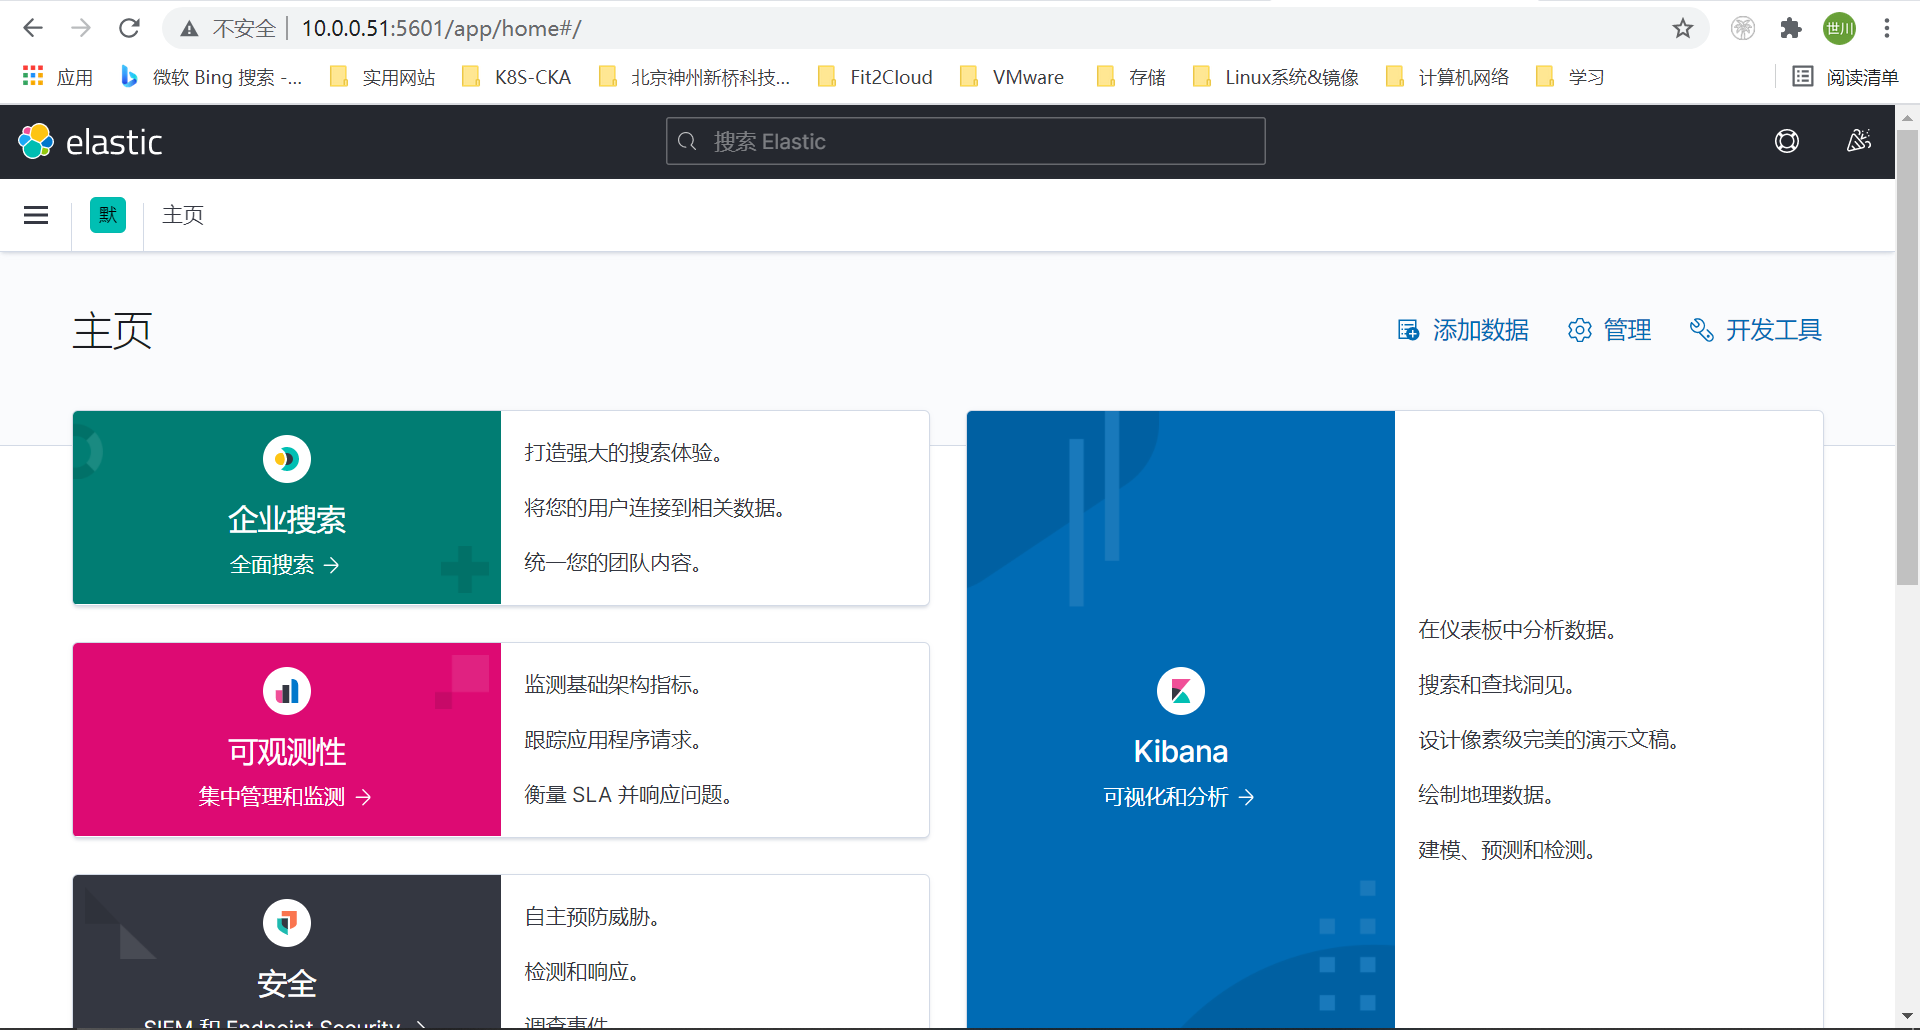
添加索引
1、找到Stack Management
2、选择”索引模式”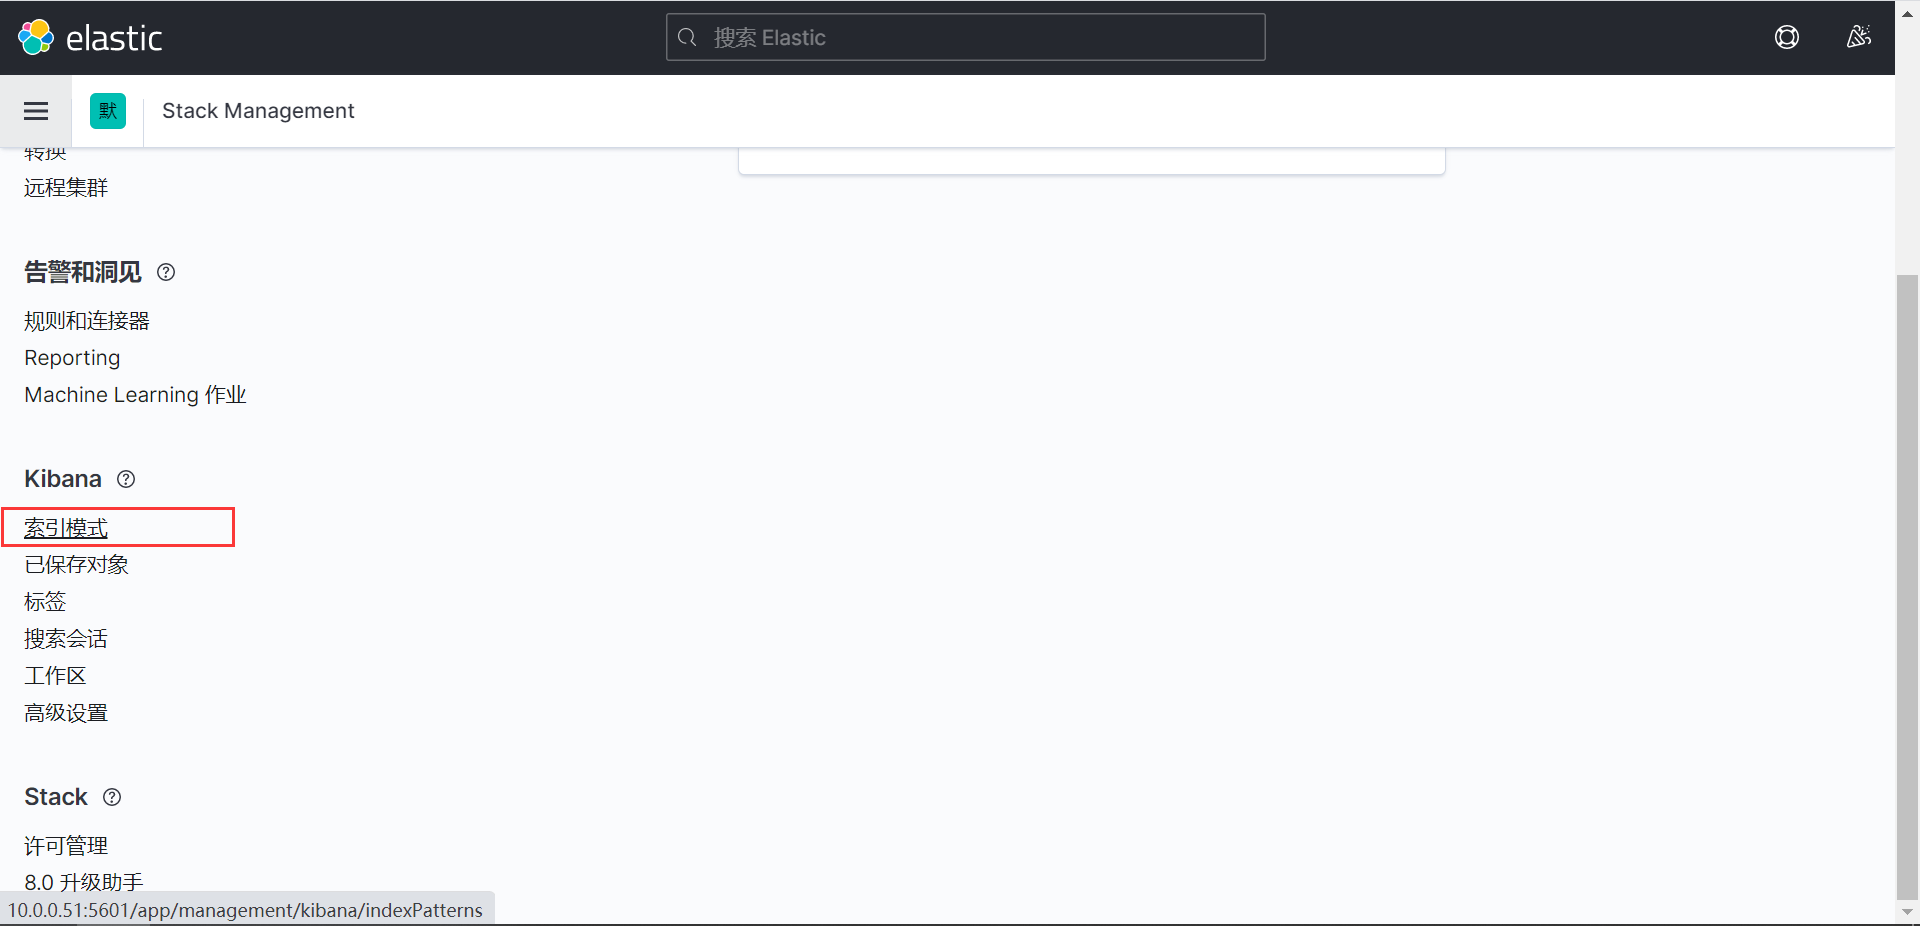
3、选择”创建索引模式”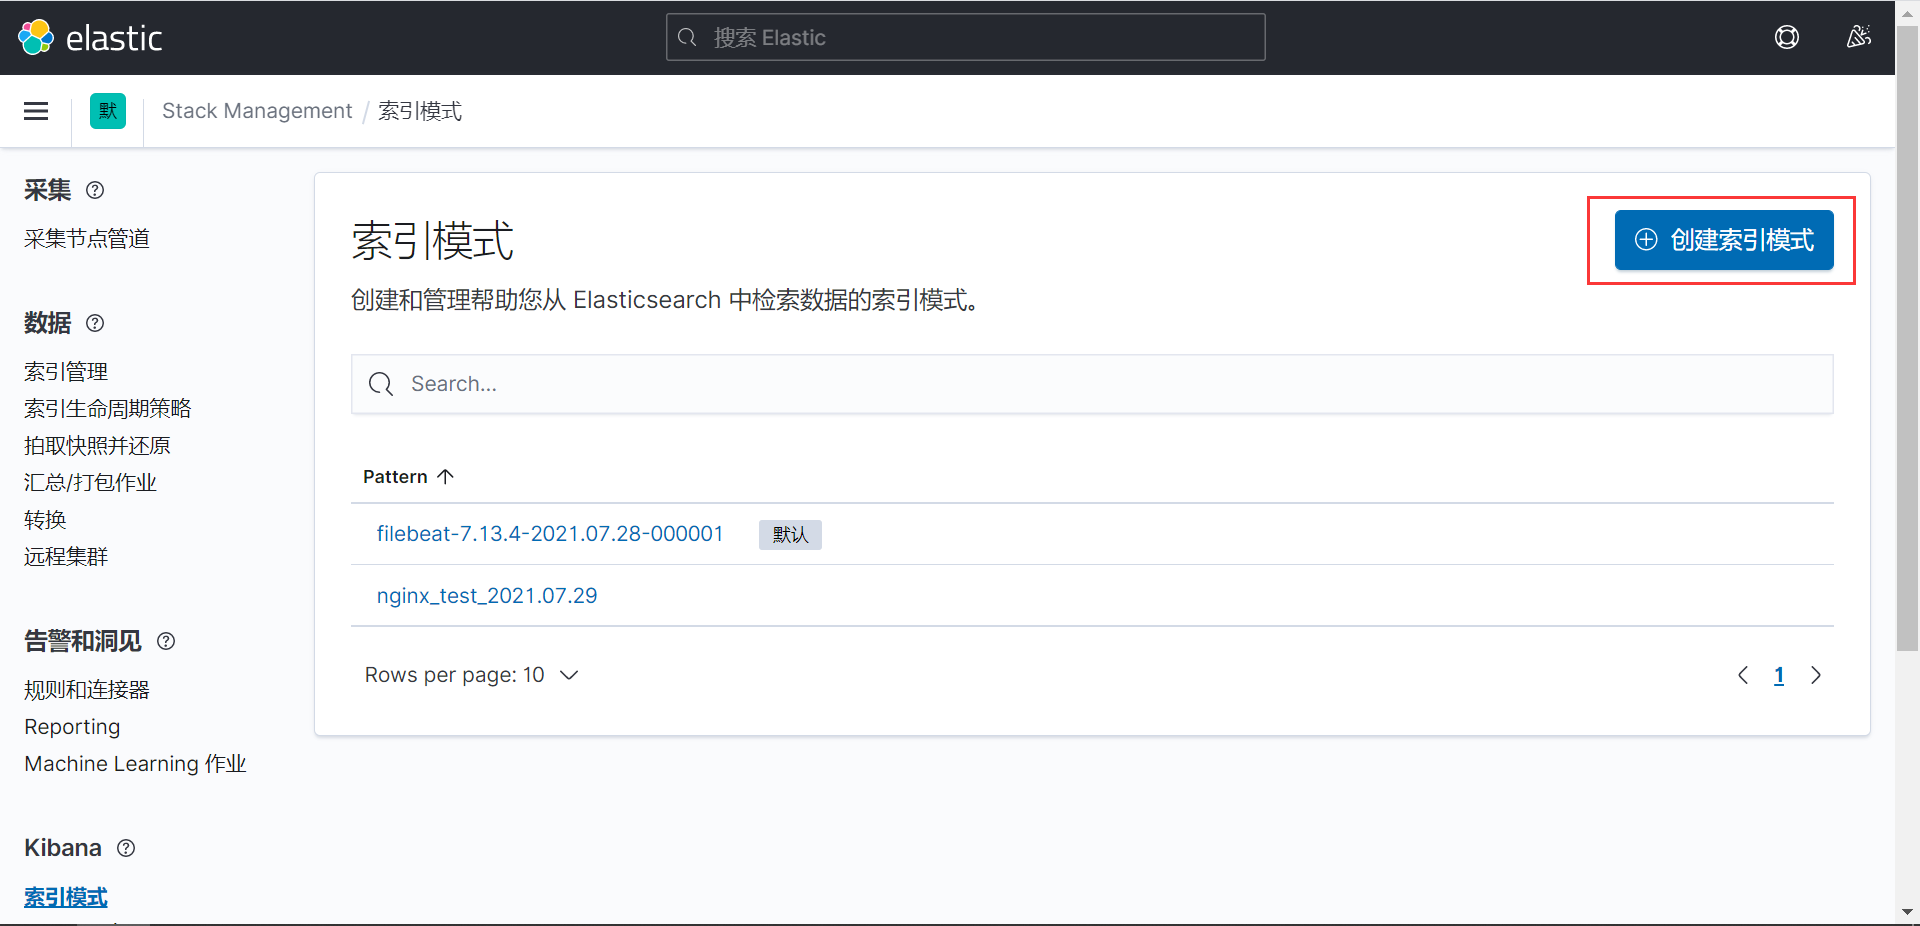
4、索引名称栏输入索引名字,并点击下一步,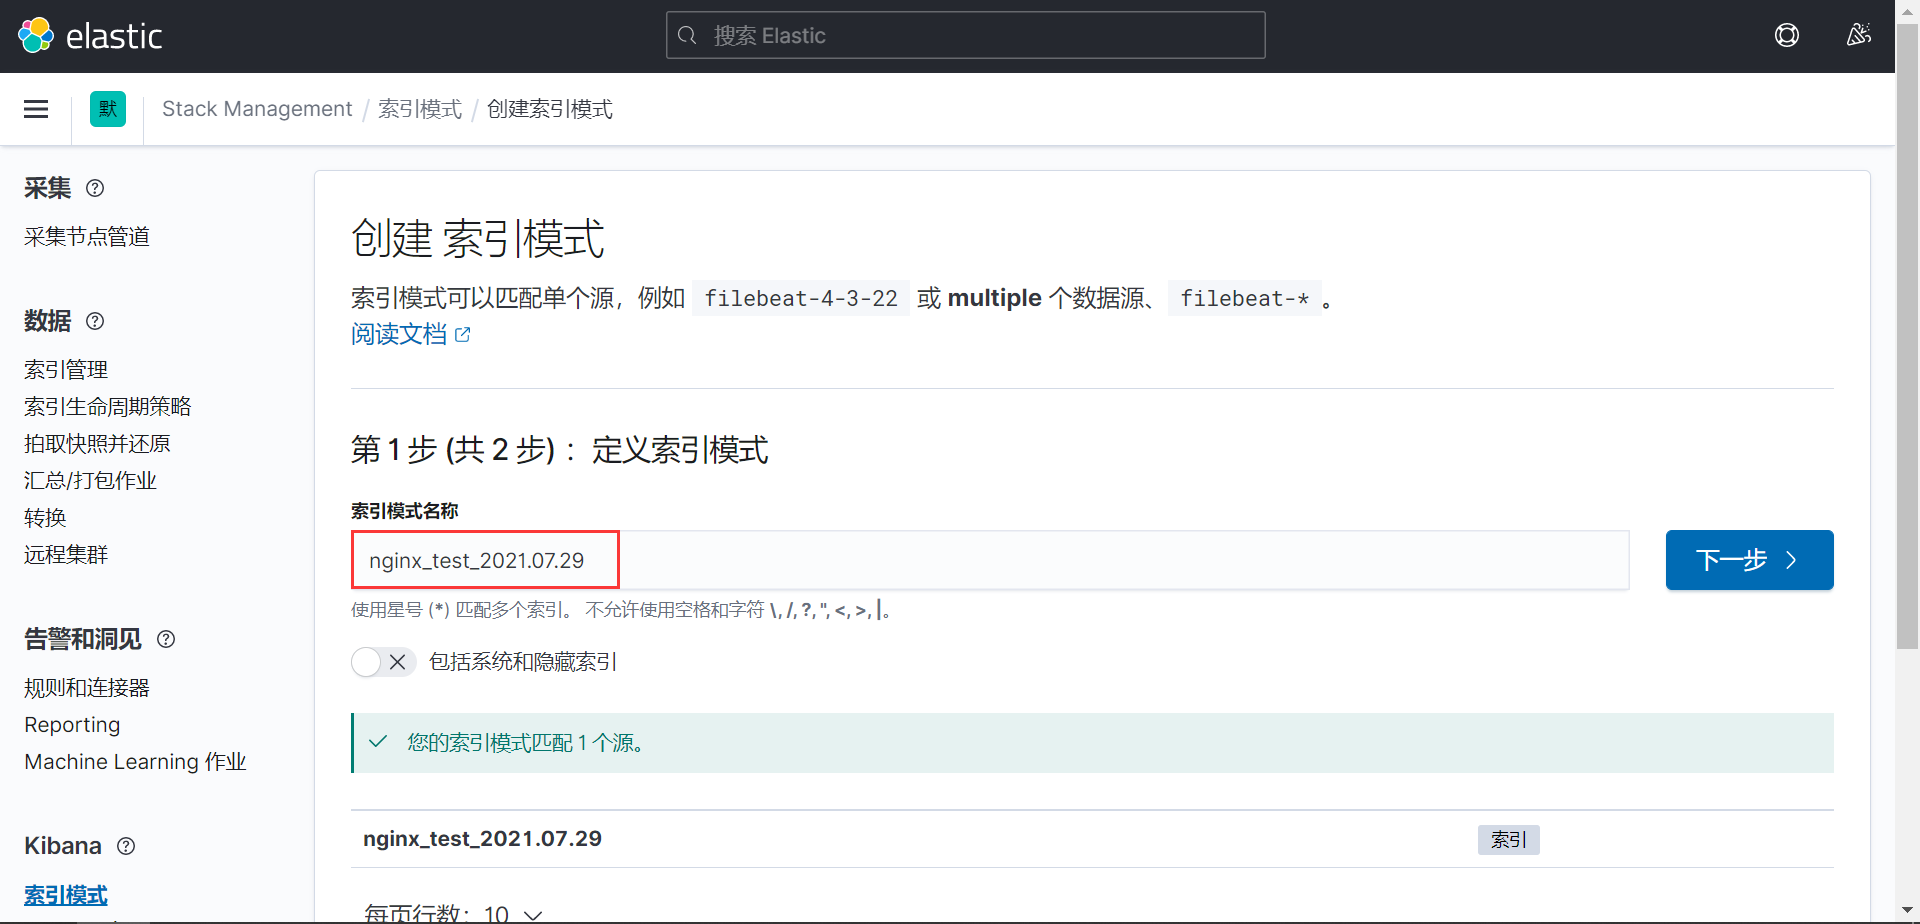
5、选择@timastamp进行时间筛选,创建索引模式
6、选择”Discover”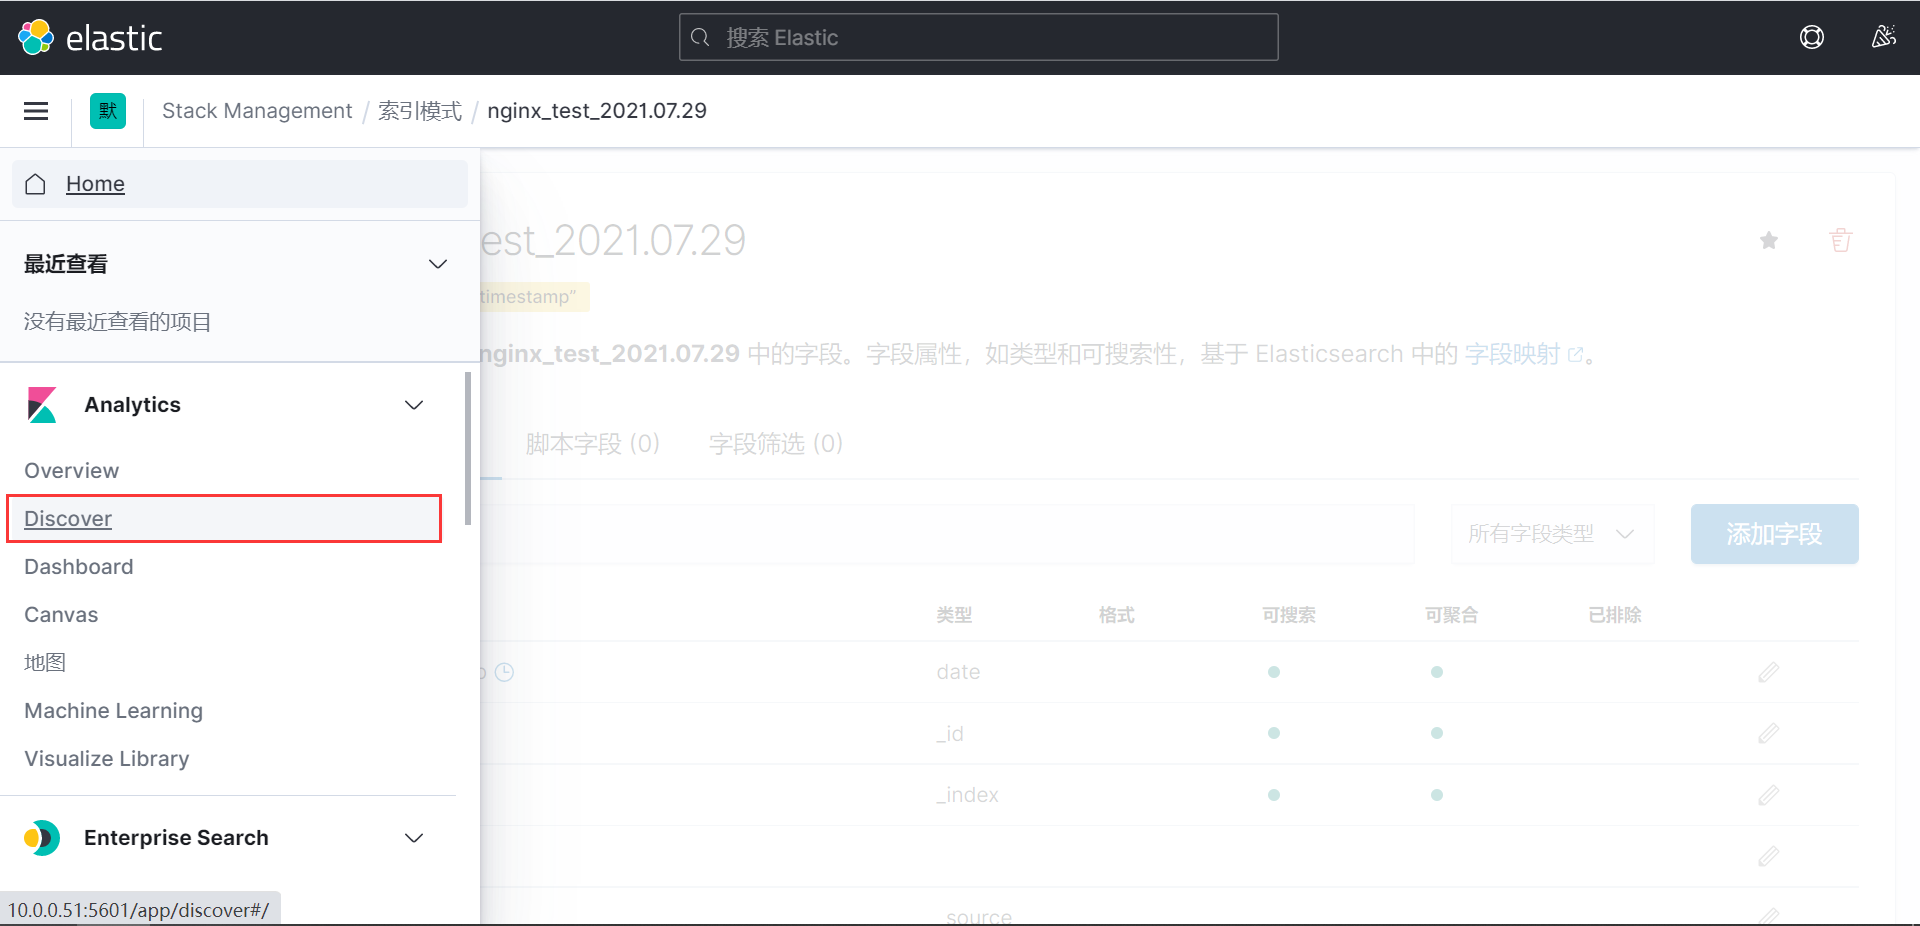
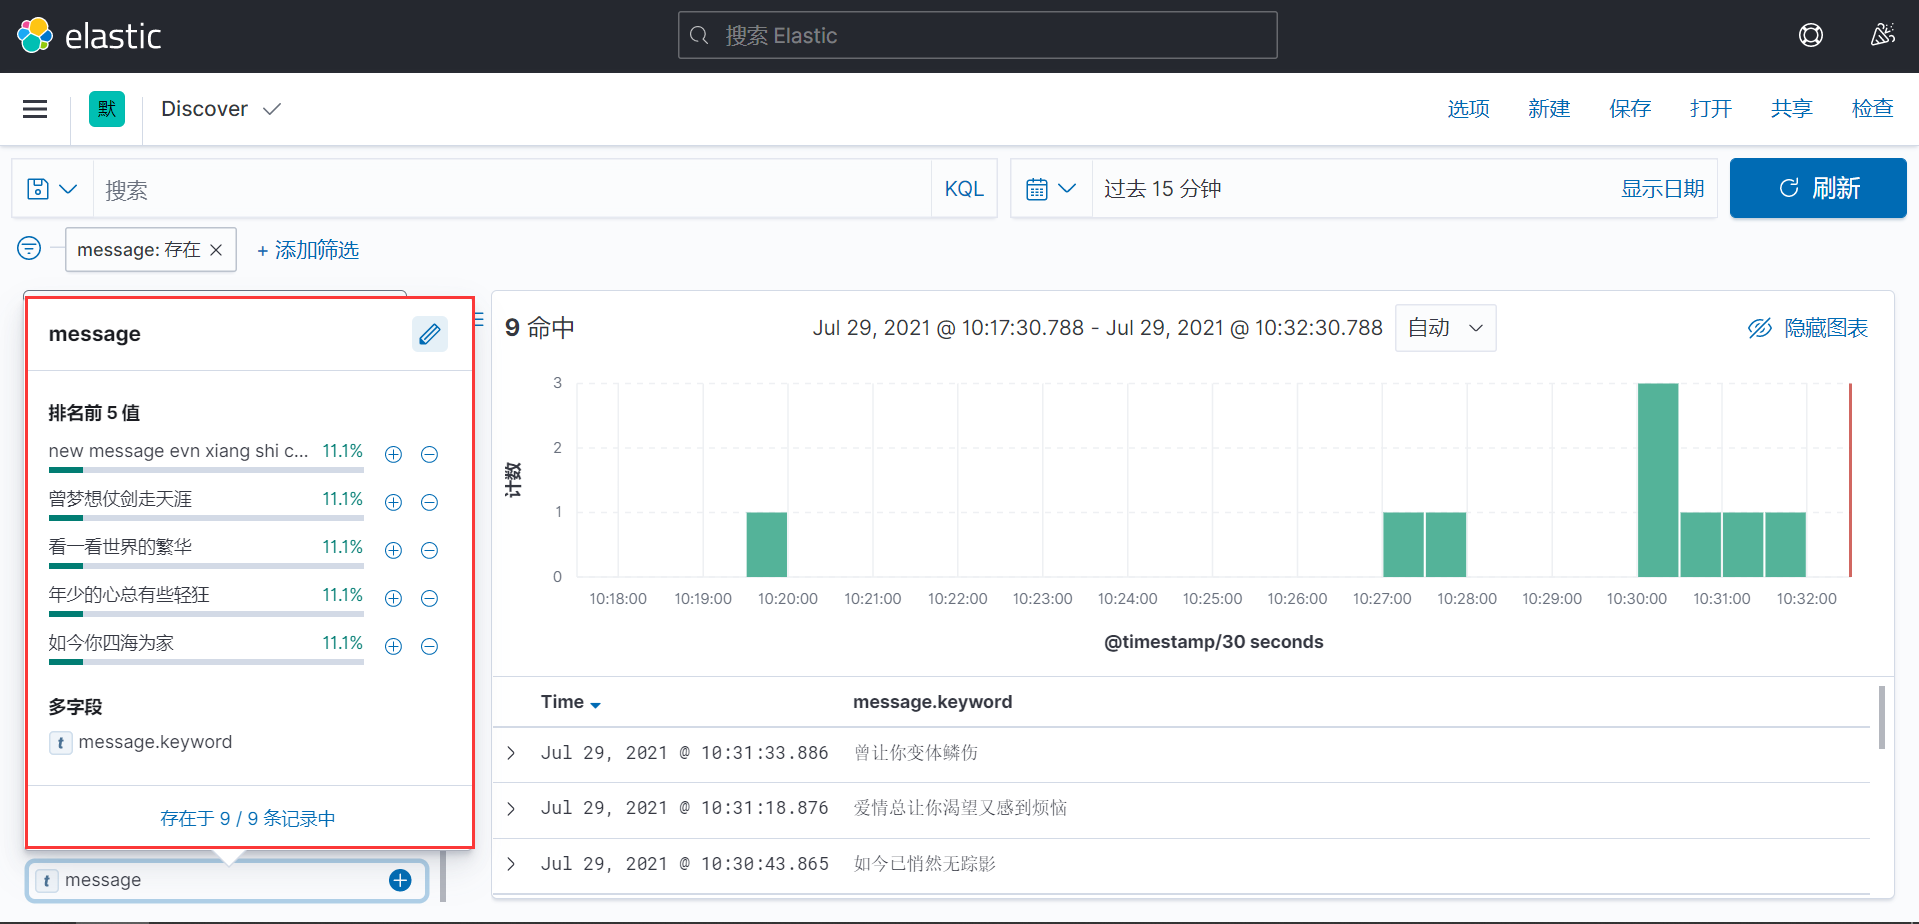
7、选择索引条目,就可以查看这条索引对应的日志信息了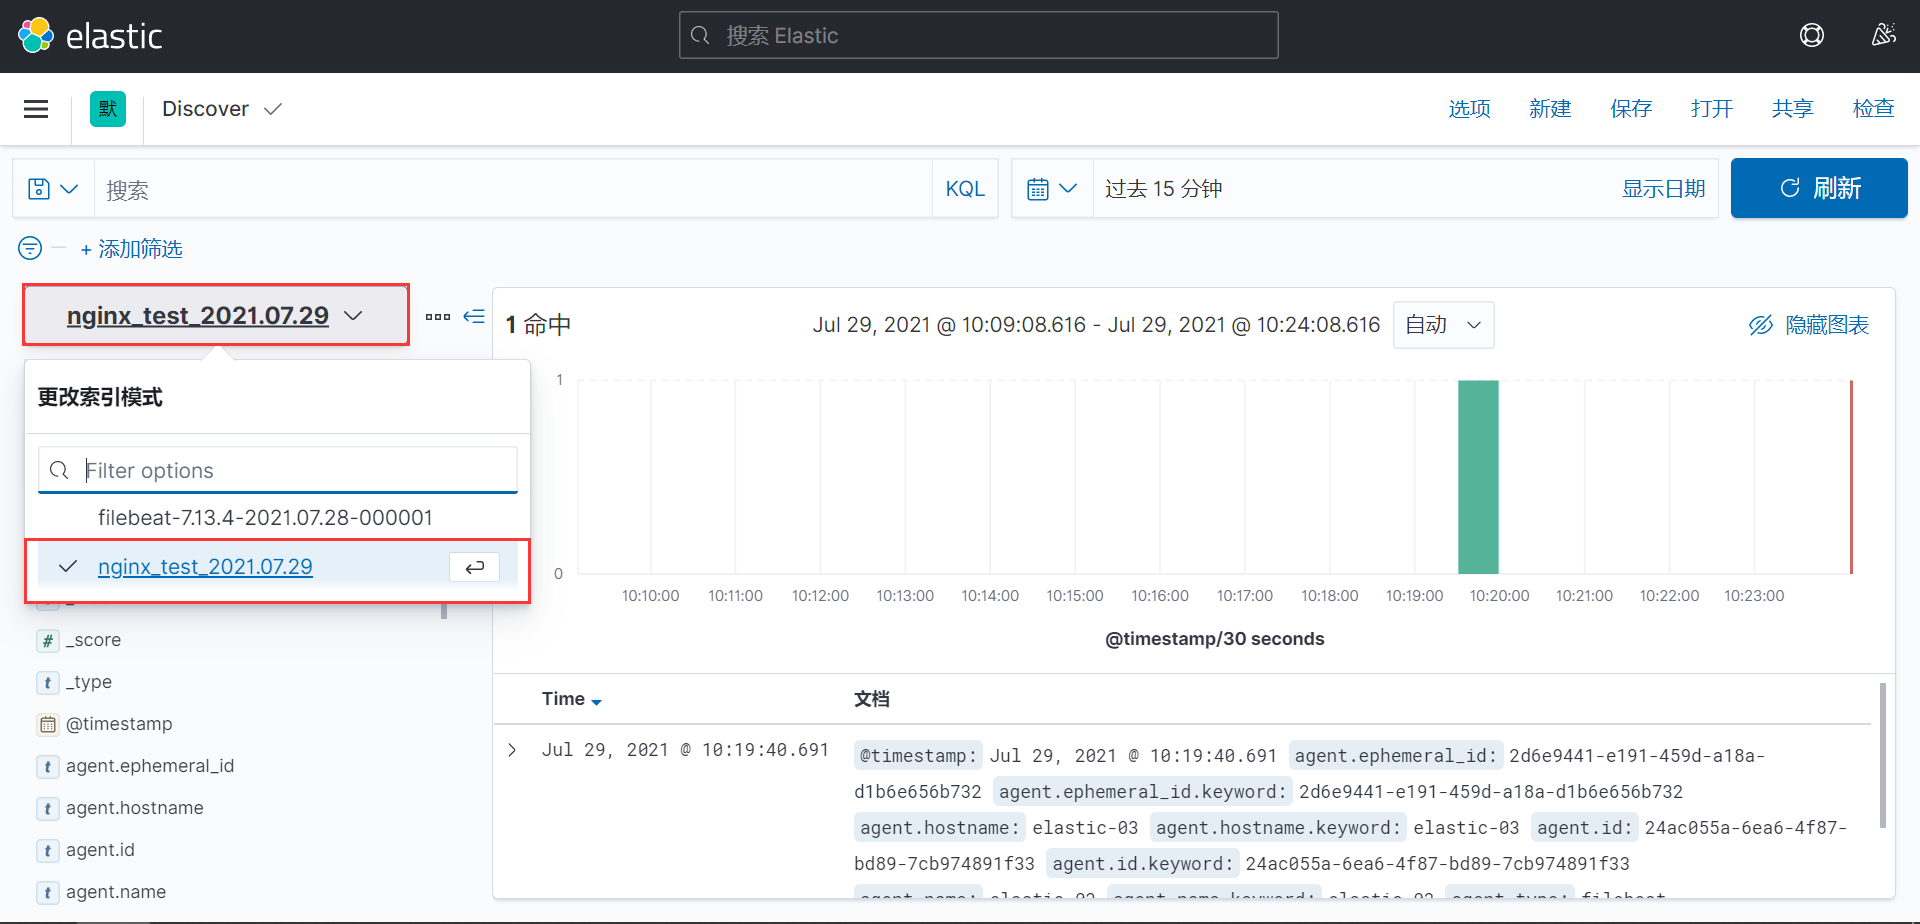

若有收获,就点个赞吧
0 人点赞
