R
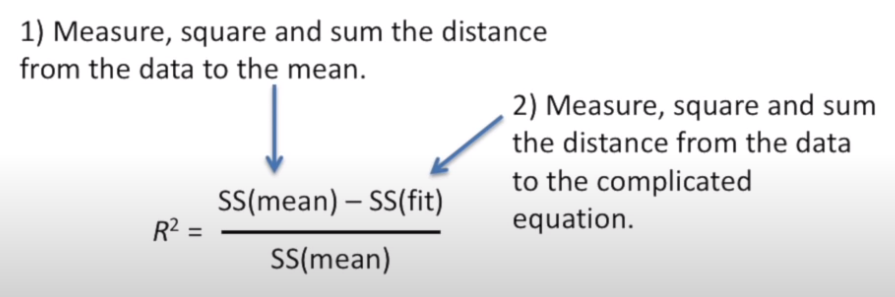
SS(mean) = sum of squares around the mean
When calculating SS(mean), we collapsed the points onto the y-axis just to emphsize the fact that we were ignoring mouse weight.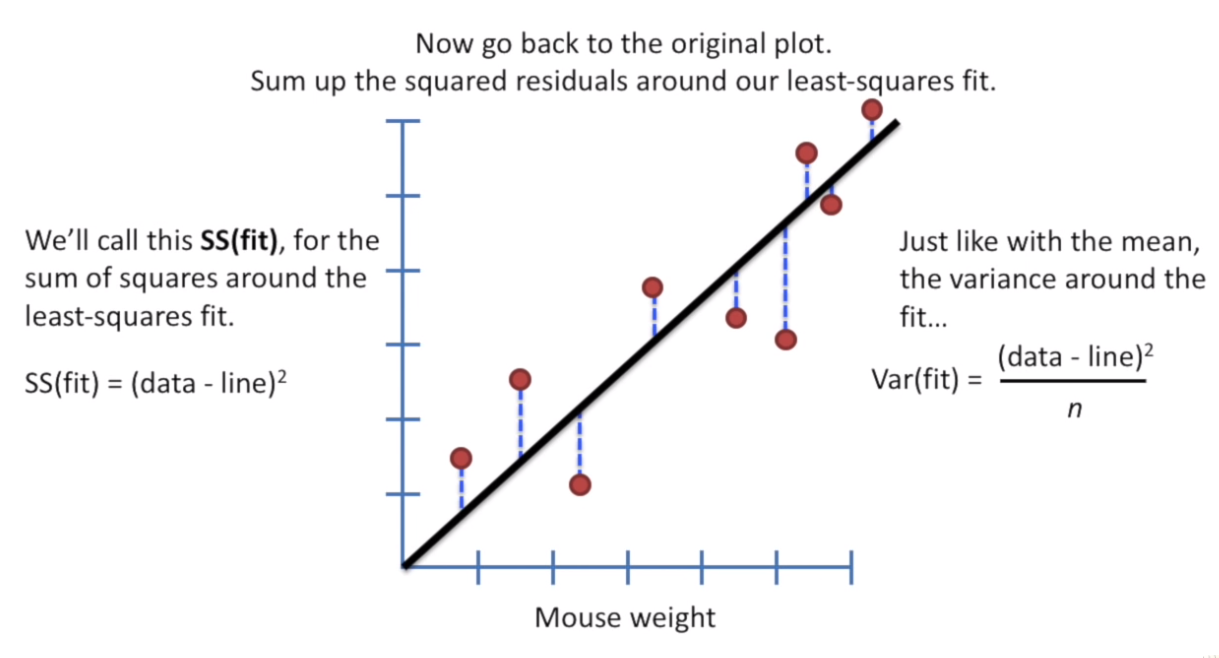
In general: 
R tells us how much of the variation in mouse size can be explained by taking mouse weight into account.
R needs to be large.

adjusted R: scales R by the number of parameters
p-value


p is the number of parameters in the fit line


Determines how reliable that relationship is (this is the p-value that we calculate with F).
This needs to be small.

若有收获,就点个赞吧
0 人点赞
