Prometheus
一、 特征

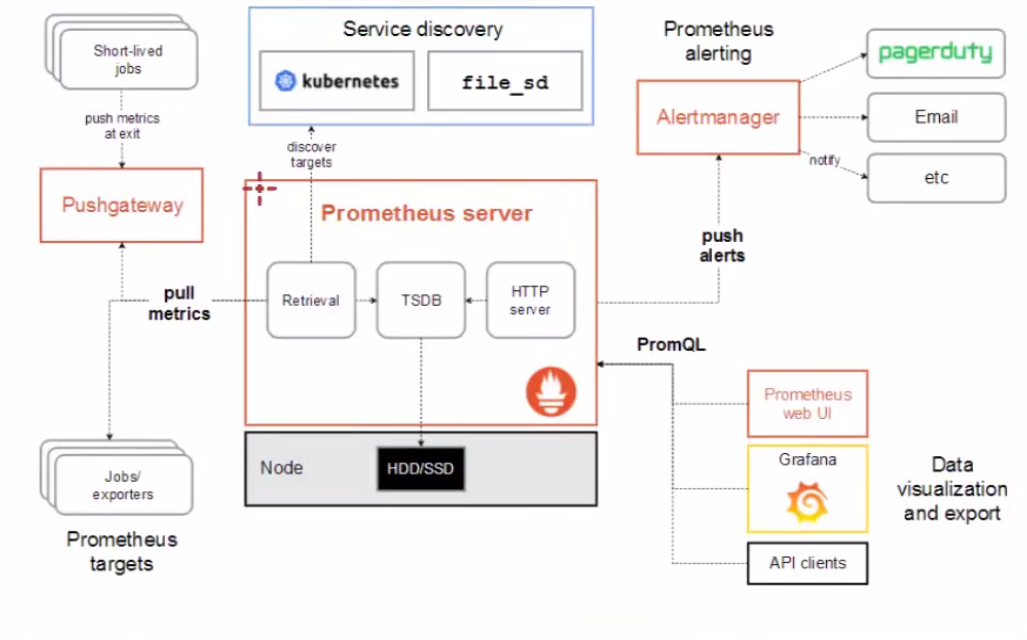
二、原理
三、安装
1、安装配置监控主机
1.基础配置配置hosts[root@localhost ~]# vim /etc/hosts #配置hosts[root@localhost ~]# cat !$cat /etc/hosts192.168.11.102 dba192.168.11.103 dbb配置主机名[root@localhost ~]# hostnamectl set-hostname dba #配置主机名[root@localhost ~]# bash配置时间同步[root@dba ~]# yum -y install ntpdate.x86_64 #时间同步[root@dba ~]# systemctl enable --now ntpdate.service关闭防火墙[root@dba ~]# setenforce 0[root@dba ~]# sed -i '/SELINUX/{s/enforcing/disabled/}' /etc/selinux/config[root@dba ~]# systemctl disable --now firewalld2.下载解压安装包[root@dba local]# tar -xf prometheus-2.5.0.linux-amd64.tar.gz[root@dba local]# mv prometheus-2.5.0.linux-amd64 prometheus3.启动[root@dba local]# /usr/local/prometheus/prometheus --config.file='/usr/local/prometheus/prometheus.yml'4.查看状态[root@dba local]# ss -antl |grep 9090LISTEN 0 128 [::]:9090 [::]:*5.web界面访问192.168.11.102:9090
四、web界面使用
1.初始界面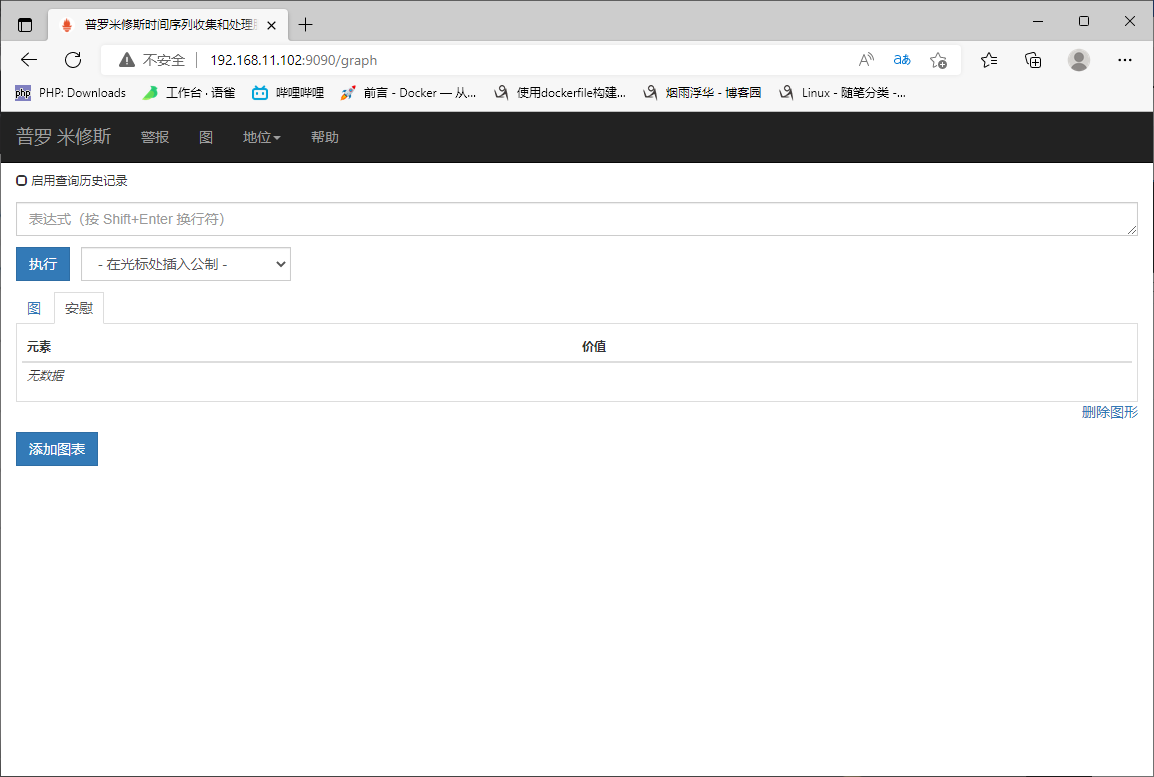
2.查看监控的主机
3.开启cpu监控 可搜索
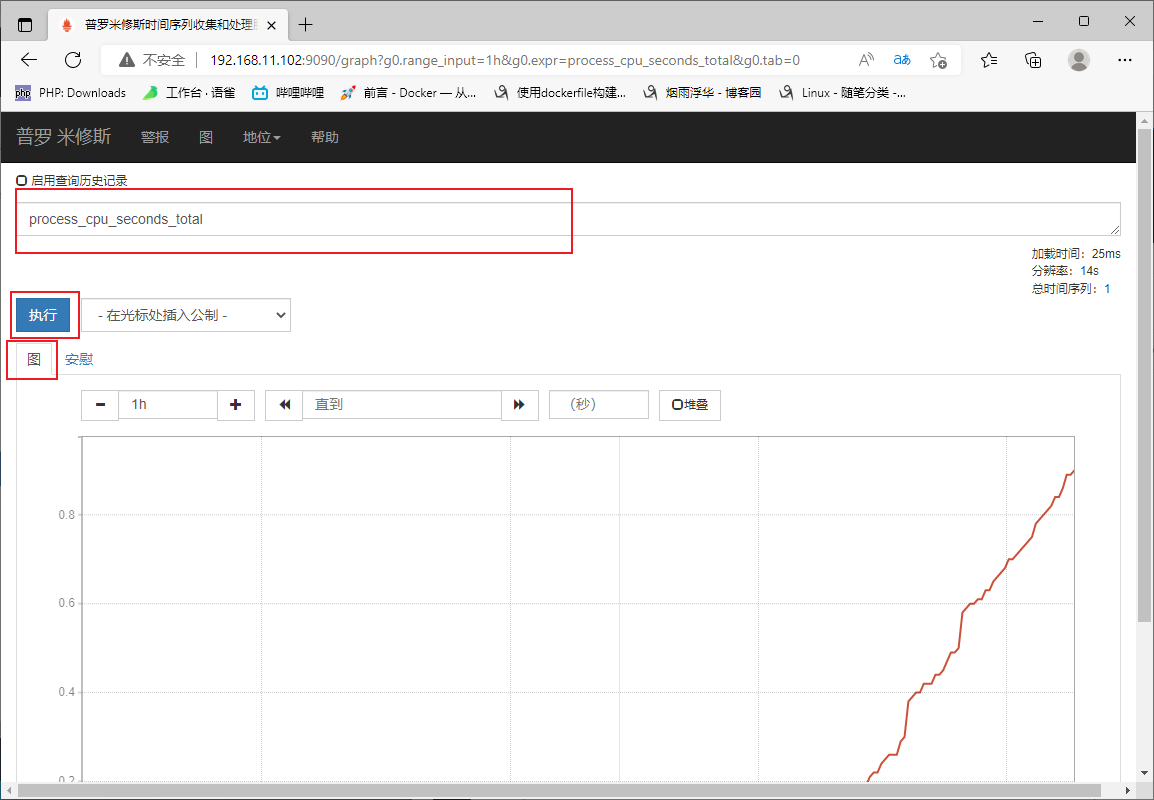
语法格式 go_threads{job=”prometheus”}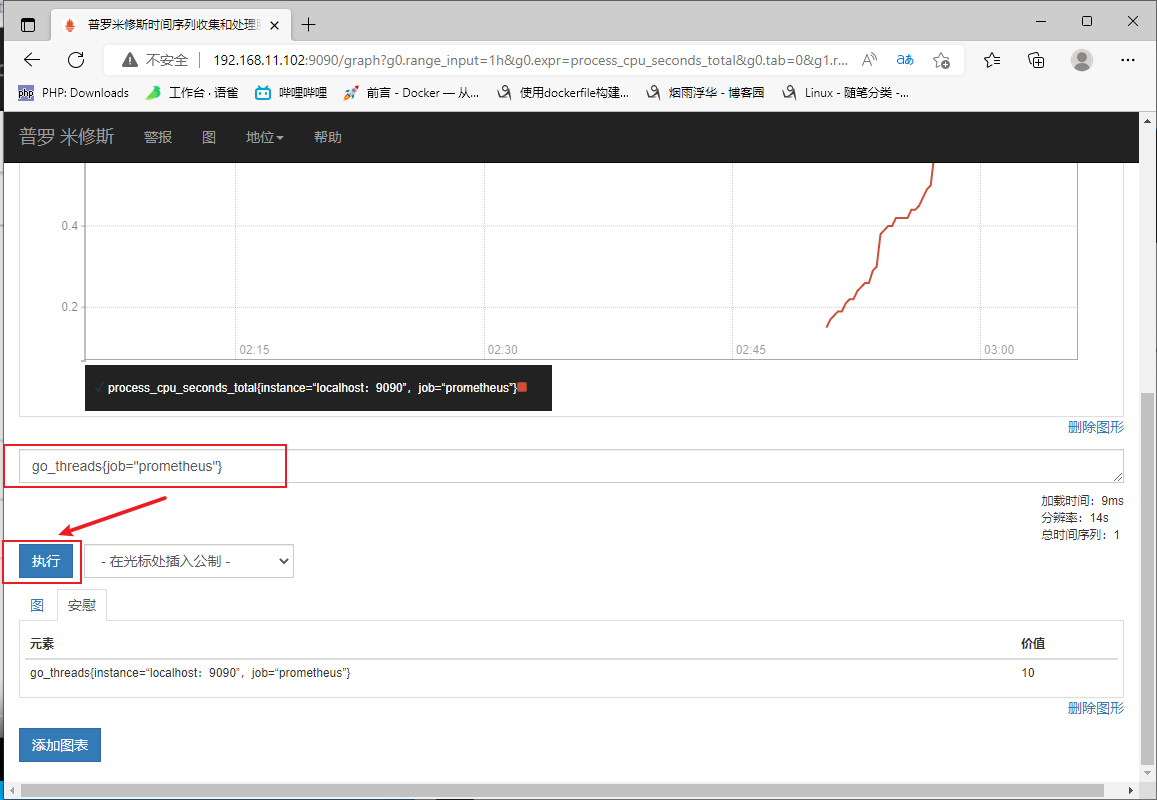
添加图表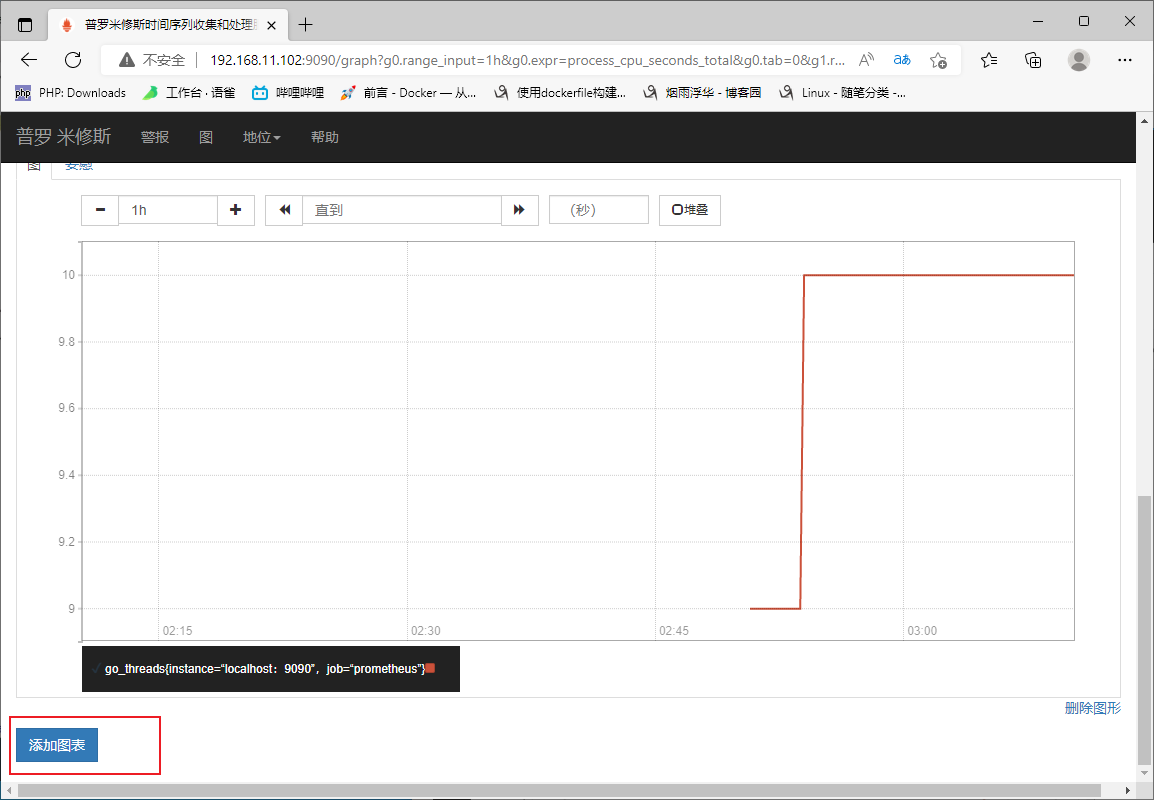
五、监控其他主机(结合node使用)
1.基础配置
配置hosts
[root@localhost ~]# vim /etc/hosts
[root@localhost ~]# cat !$
cat /etc/hosts
192.168.11.102 dba
192.168.11.103 dbb
配置主机名
[root@localhost ~]# hostnamectl set-hostname dbb
[root@localhost ~]# bash
配置时间同步
[root@dbb ~]# yum -y install ntpdate.x86_64
[root@dbb ~]#  systemctl enable --now ntpdate.service

2.下载安装客户端工具 (被监听)
[root@dbb local]# tar -xf node_exporter-0.16.0.linux-amd64.tar.gz
[root@dbb local]# mv node_exporter-0.16.0.linux-amd64 node_exporter

3.启动
[root@dbb node_exporter]# nohup /usr/local/node_exporter/node_exporter &

4.查看状态
[root@dbb node_exporter]# ss -antl |grep 9100
LISTEN     0      128       [::]:9100                  [::]:*
配置监控主机 (server上做)
1.设置yml启动文件  (添加三行)
[root@dba local]# vim /usr/local/prometheus/prometheus.yml
  - job_name: 'dbb'
    static_configs:
    - targets: ['192.168.11.103:9100']
2.重启prometheus
[root@dba local]# ss -antlp  |grep 9090
LISTEN     0      128       [::]:9090                  [::]:*                   users:(("prometheus",pid=3738,fd=6))
[root@dba local]# kill -9 3738
[root@dba local]# /usr/local/prometheus/prometheus --config.file='/usr/local/prometheus/prometheus.yml' &
3.查看开启状态
[root@dba local]# ss -antl | grep 9090
LISTEN     0      128       [::]:9090                  [::]:*
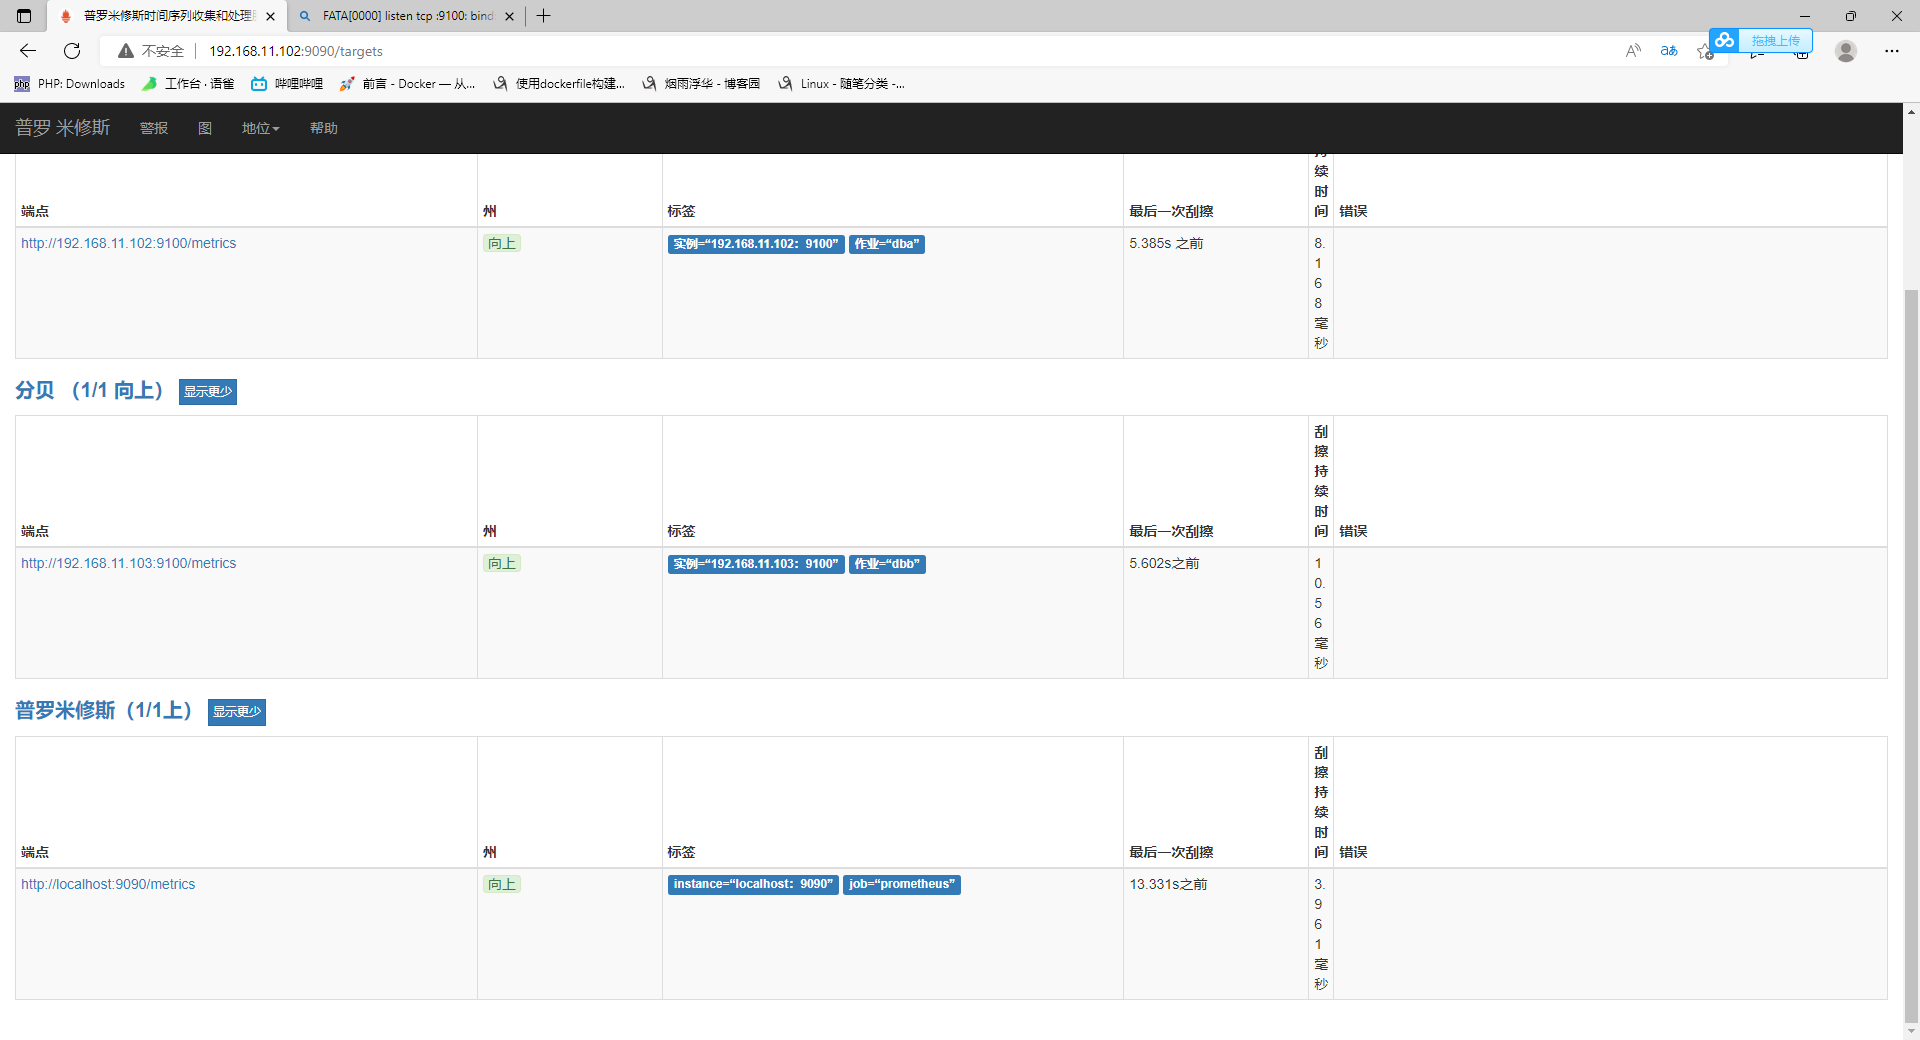
查看状态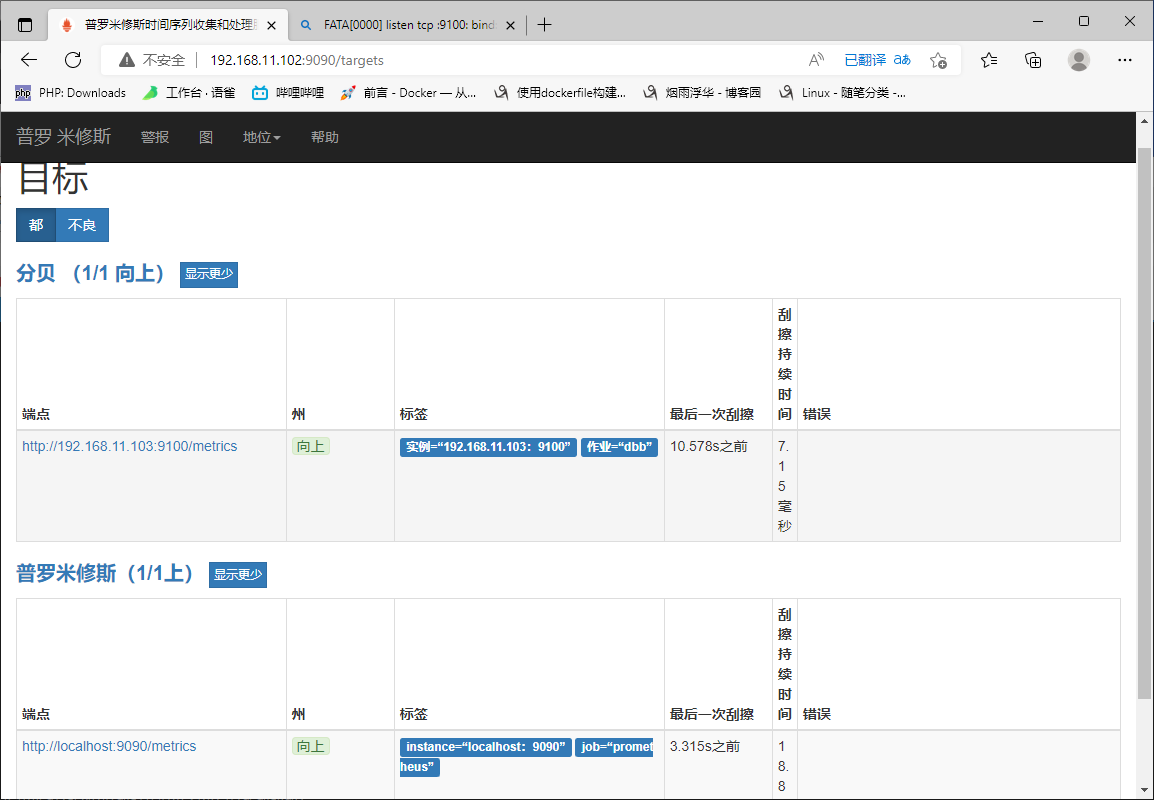
1.server需要做node去连接客户机获取信息
#在dbb--192.168.11.103把已安装的node拷贝到dba
[root@dbb node_exporter]# scp -r /usr/local/node_exporter/ 192.168.11.102:/usr/local/

2.启动
[root@dba local]# nohup /usr/local/node_exporter/node_exporter

3.设置yml启动文件  (添加三行)修改prometheus
[root@dba local]# vim /usr/local/prometheus/prometheus.yml
  - job_name: 'dba'
    static_configs:
    - targets: ['192.168.11.102:9100']

4.重启prometheus
[root@dba local]# ss -antlp | grep 9090
LISTEN     0      128       [::]:9090                  [::]:*                   users:(("prometheus",pid=14166,fd=3))
[root@dba local]# kill -9 14166
[root@dba local]# /usr/local/prometheus/prometheus --config.file='/usr/local/prometheus/prometheus.yml'

5.查看端口状态
[root@dba local]# ss -antl |grep 9
LISTEN     0      128       [::]:9090                  [::]:*
LISTEN     0      128       [::]:9100                  [::]:*
六、监控mysql数据库(结合node使用)
步骤
#+++++++++++++++++++++++++安装数据库授权++++++++++++++++++++++++++#
1.安装数据库mariadb-server
[root@dbb node_exporter]# yum install -y mariadb-server

2.开启数据库
[root@dbb node_exporter]# systemctl start mariadb.service

3.授权    #为了给mysql_node接受服务信息
[root@dbb node_exporter]# mysql
MariaDB [(none)]> grant select,replication client,process on *.* to 'mysql_server'@'localhost' identified by '123';
MariaDB [(none)]> quit
[root@dbb node_exporter]# vim /usr/local/mysql_exporter/.my.cnf   #加.能隐藏文件
[client]
user=mysql_server
password=123


#+++++++++++++++++++++++++mysql连接mysql_node++++++++++++++++++++++++++#
1.解压mysqld_exporter
[root@dbb node_exporter]# tar -xf mysqld_exporter-0.11.0.linux-amd64.tar.gz -C /usr/local/
[root@dbb node_exporter]# mv /usr/local/mysqld_exporter-0.11.0.linux-amd64/ /usr/local/mysql_exporter

2.启动 #指定要监控的服务加载文件my.cnf
[root@dbb node_exporter]# /usr/local/mysql_exporter/mysqld_exporter --config.my-cnf='/usr/local/mysql_exporter/.my.cnf'


3.查看mysql起来的端口
[root@dbb node_exporter]# ss -antl |grep 91
LISTEN     0      128       [::]:9104                  [::]:*
1.设置yml启动文件  (添加三行)修改prometheus
[root@dba local]# vim /usr/local/prometheus/prometheus.yml
  - job_name: 'dba'
    static_configs:
    - targets: ['192.168.11.102:9100']
2.重启prometheus

[root@dba local]# ss -antlp
State      Recv-Q Send-Q            Local Address:Port                                                              Peer Address:Port
LISTEN     0      128          [::]:9090       [::]:*     users:(("prometheus",pid=14346,fd=6))

[root@dba local]# kill -9  14346
[root@dba local]# /usr/local/prometheus/prometheus --config.file='/usr/local/prometheus/prometheus.yml'
查看mysql连接数
mysql_global_status_threads_connected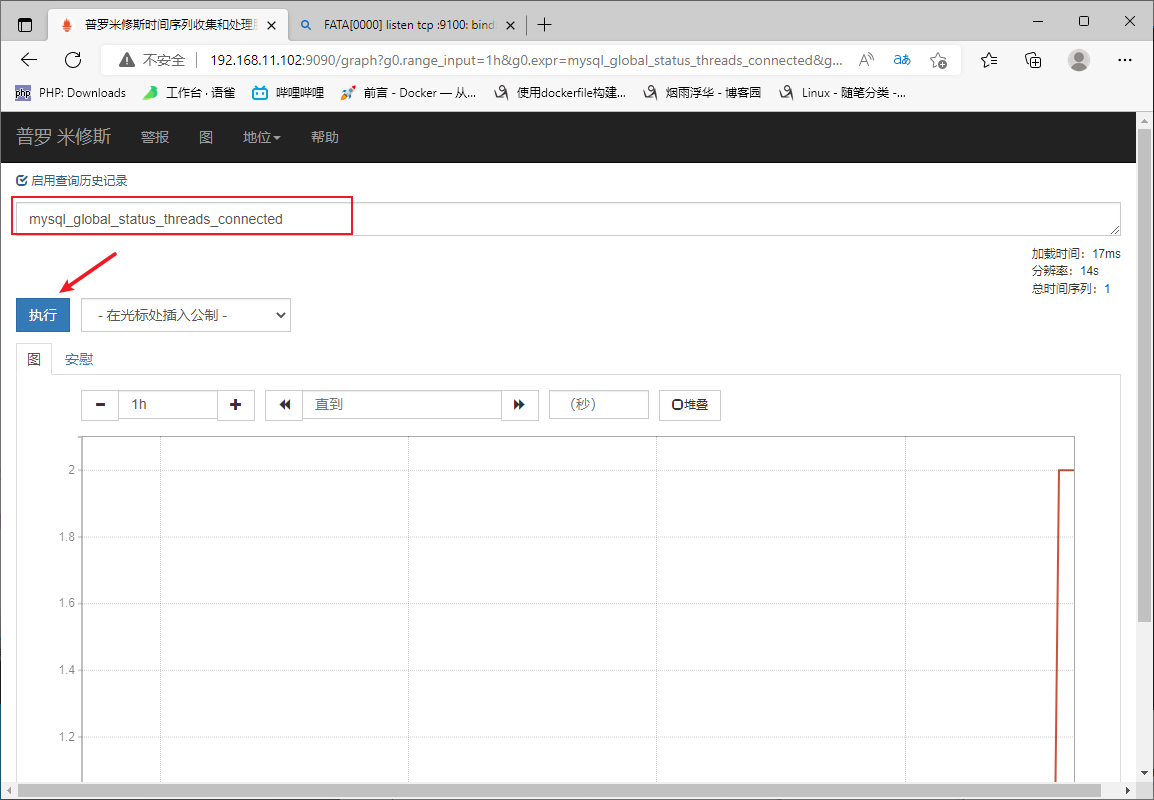
Prometheus+grafana

一、安装grafana
1.安装grafana
[root@dba local]# yum -y  install grafana-5.3.4-1.x86_64.rpm

2.启动grafana
[root@dba local]# systemctl start grafana-server.service

3.查看端口
[root@dba local]# systemctl start grafana-server.service
[root@dba local]# ss -antl
State      Recv-Q Send-Q    Local Address:Port                                                              Peer Address:Port
LISTEN     0      100       127.0.0.1:25                                                                           *:*
LISTEN     0      128              *:22                                                                           *:*
LISTEN     0      128        [::]:3000
二、访问
使用:http://192.168.11.102:3000
默认用户名密码都为 admin
第一次登录会让你改密码
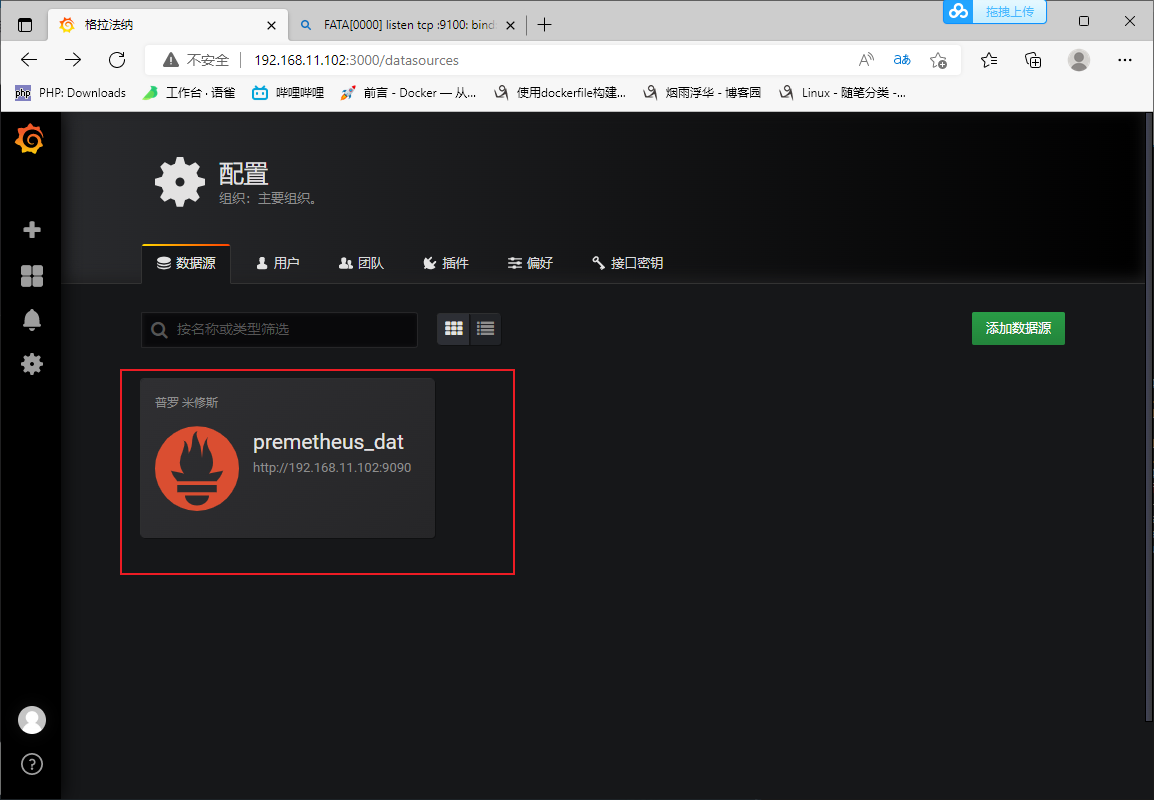
二、配置与Prometheus结合(增加数据源)
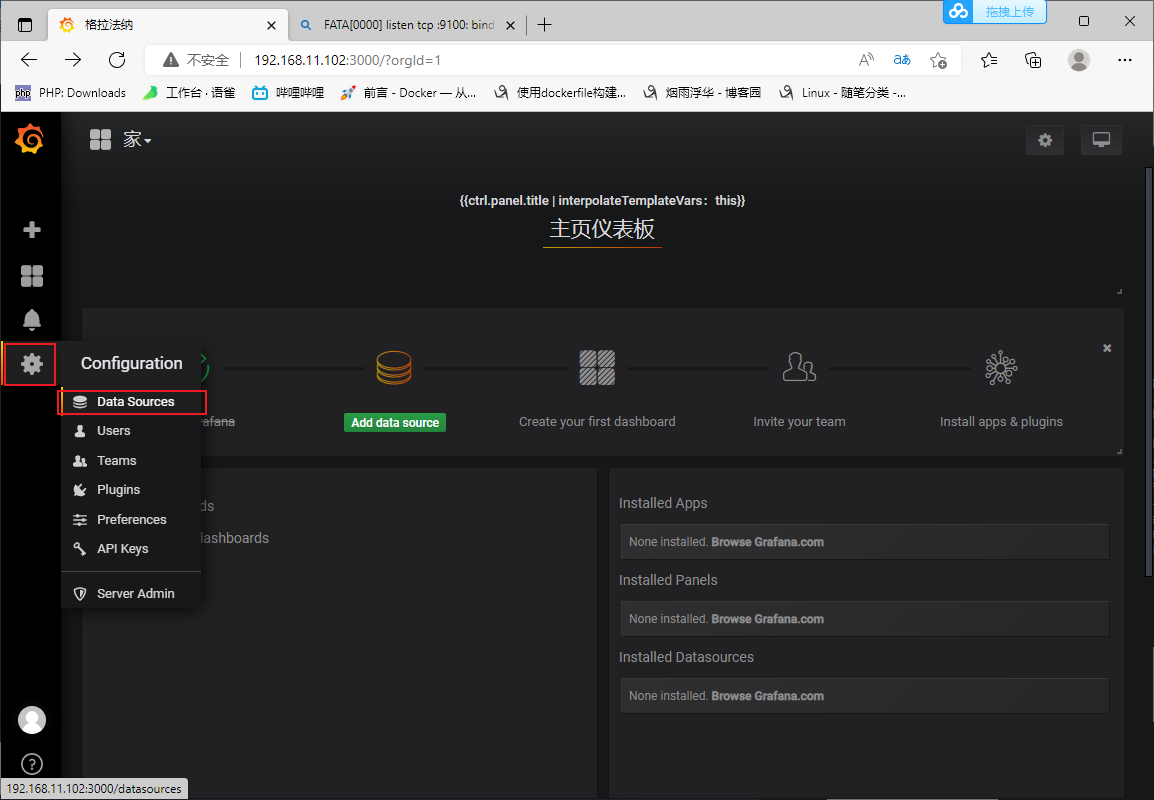
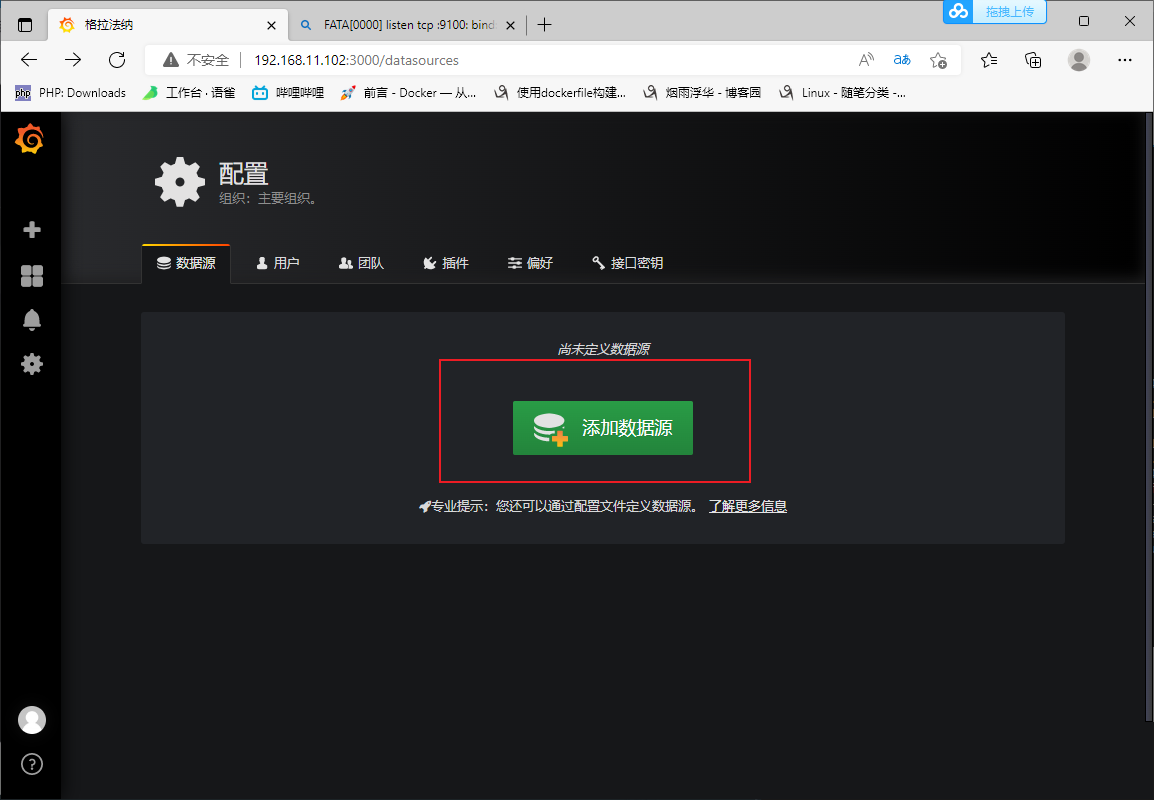
设置数据源名称—->设置类型为Prometheus—>设置Prometheus服务器地址 —>#可做安全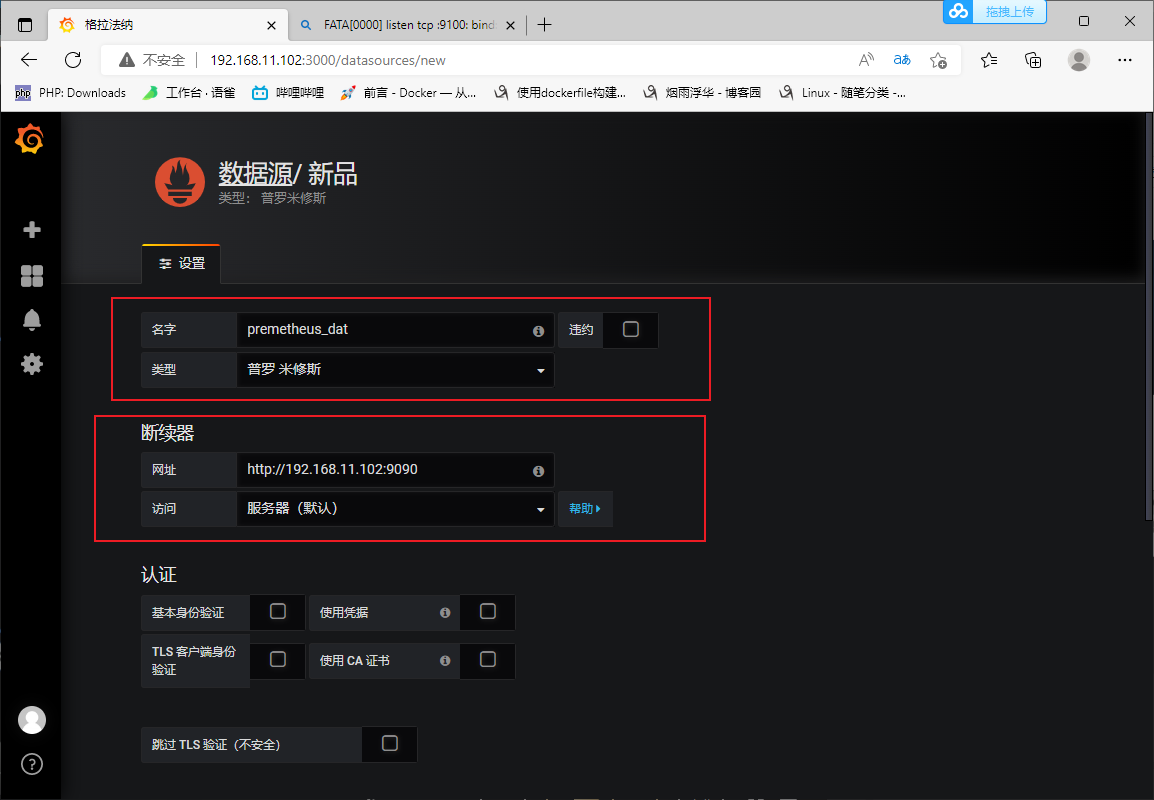
设置http获取方式为git—>保存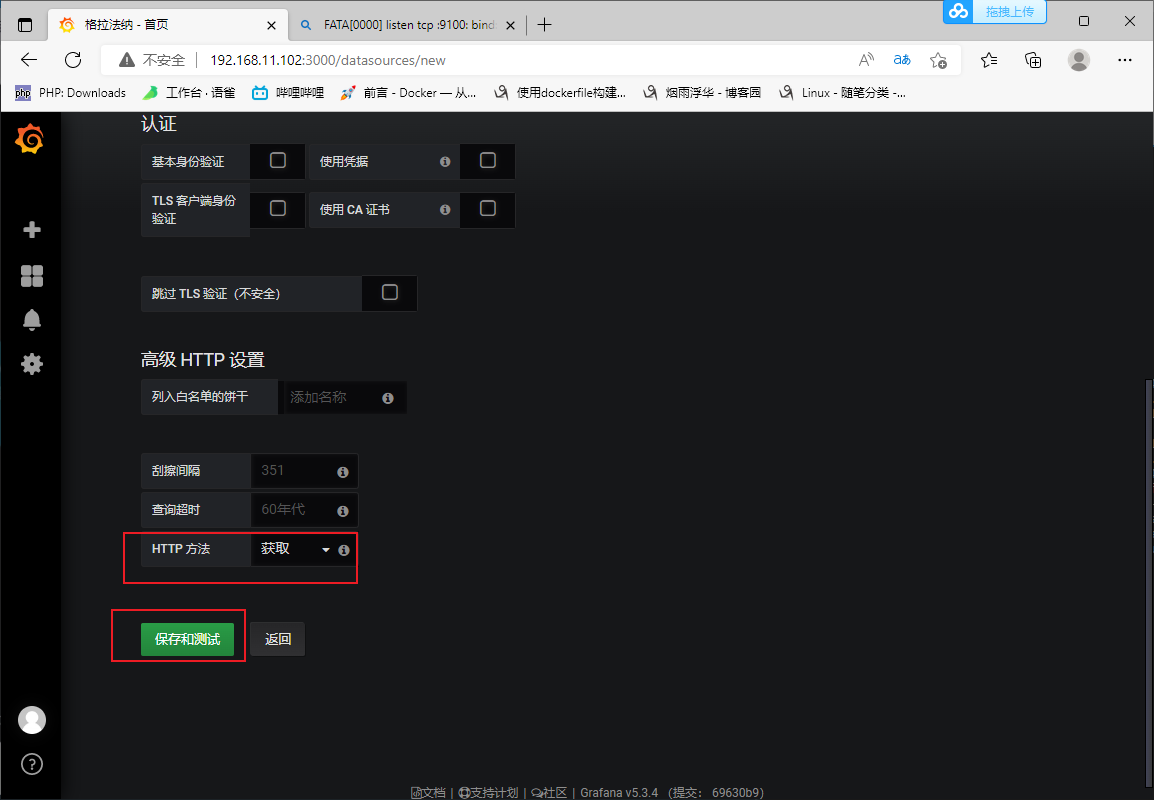
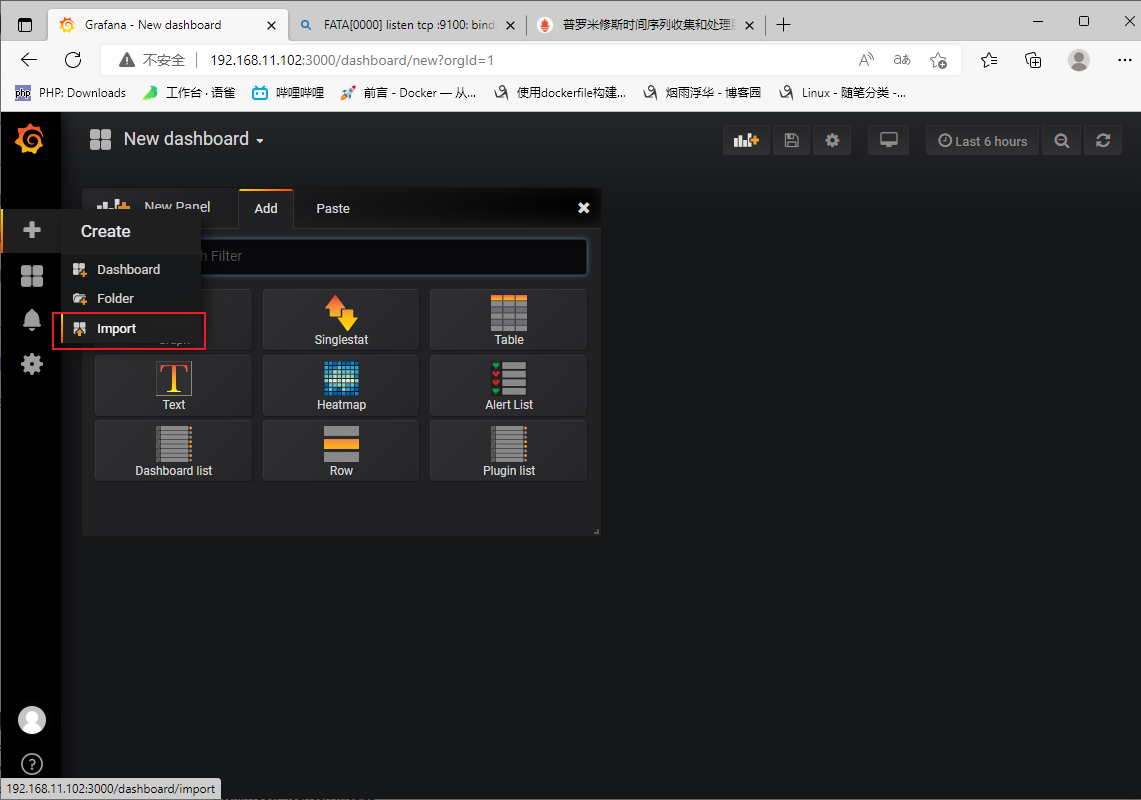
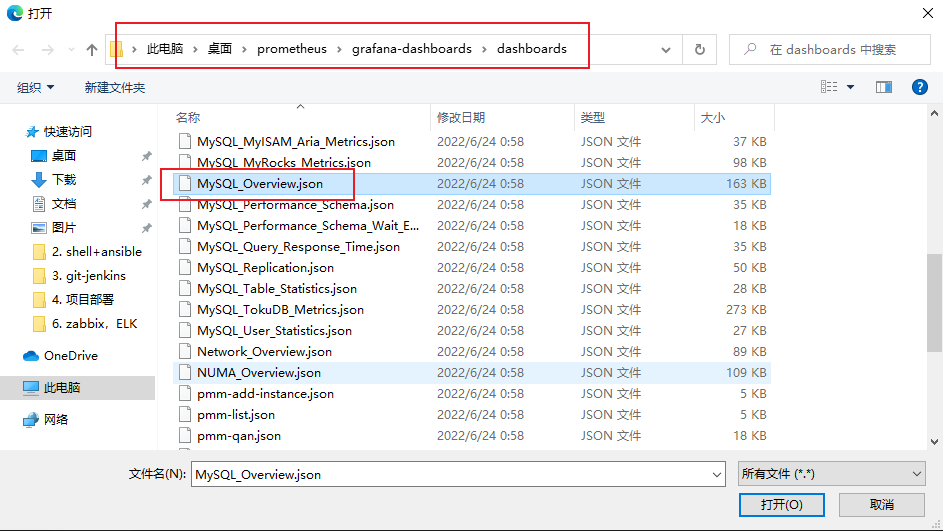
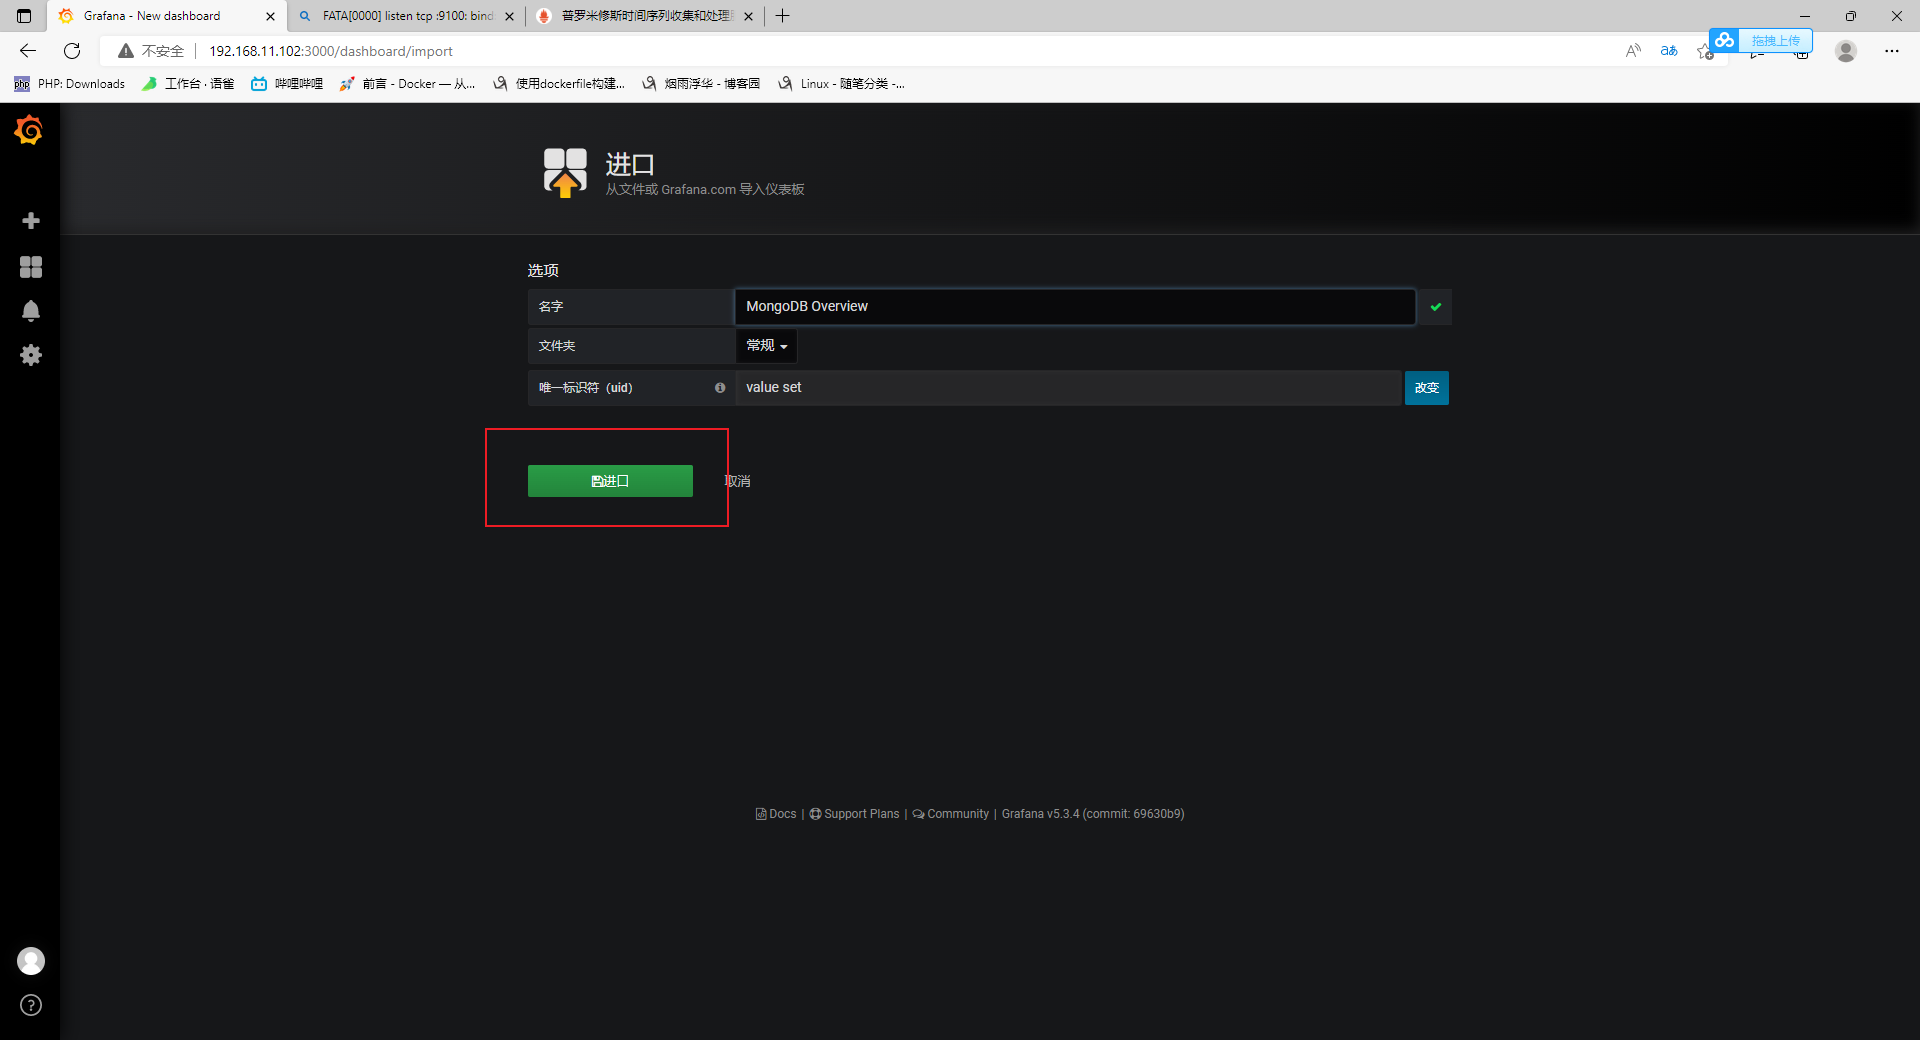
三、增加监控的内容
添加面板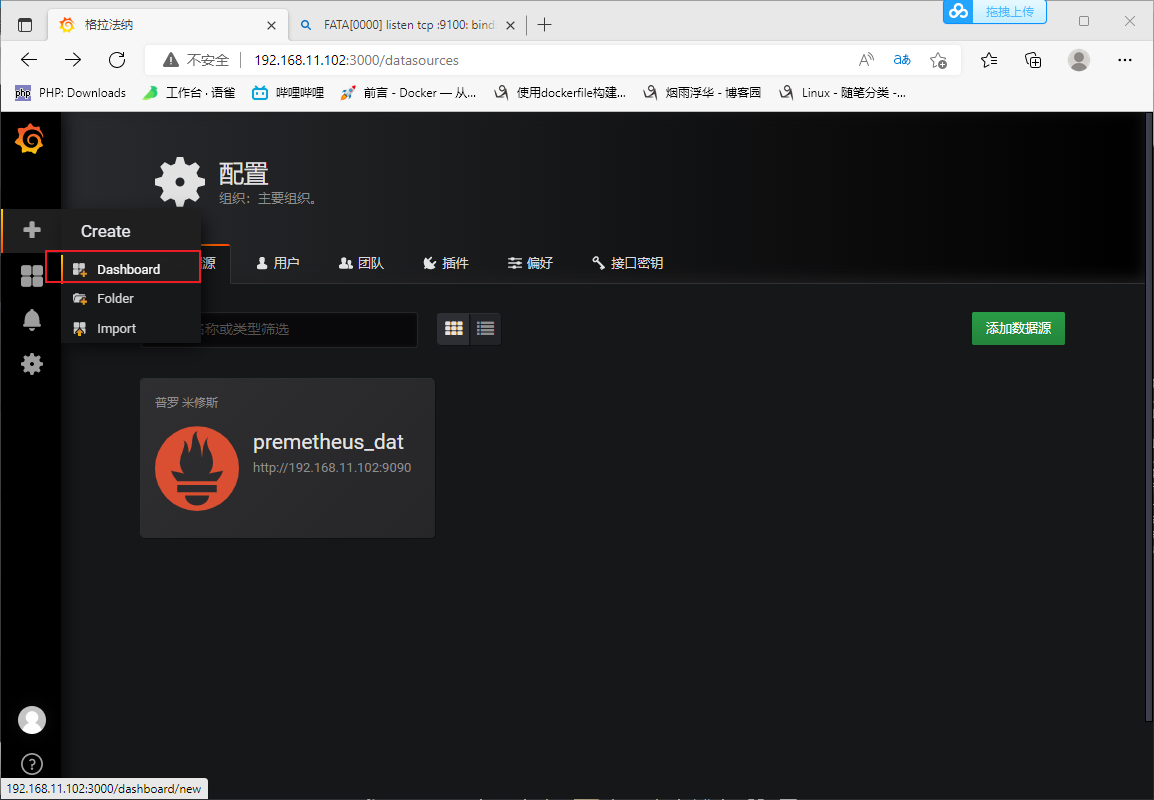
添加图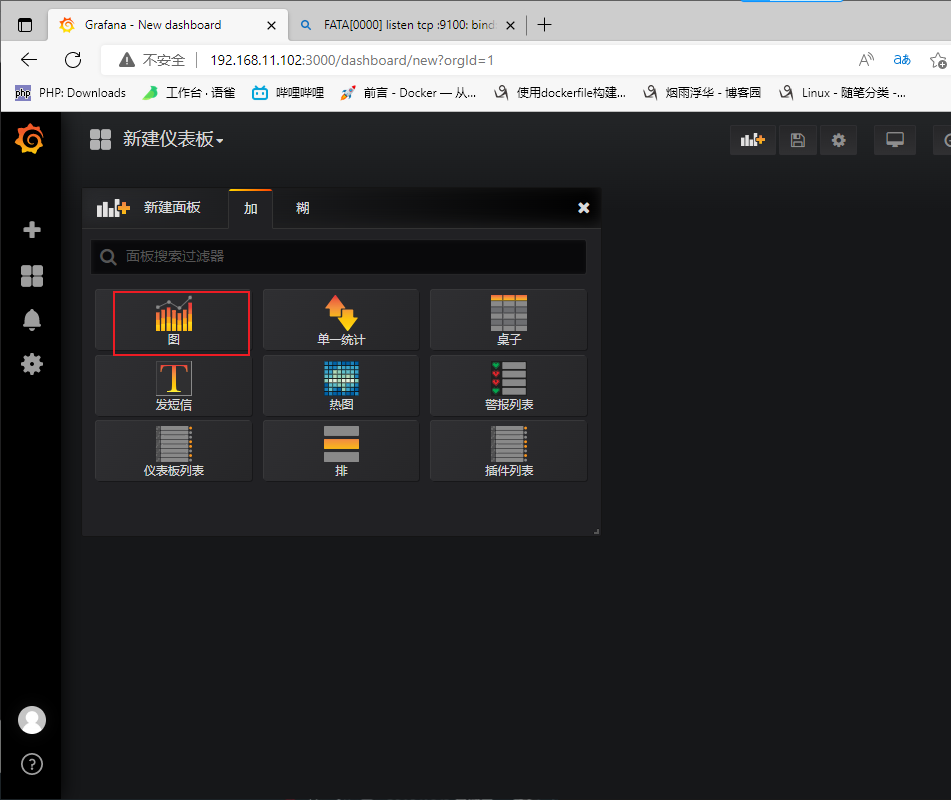
编辑图行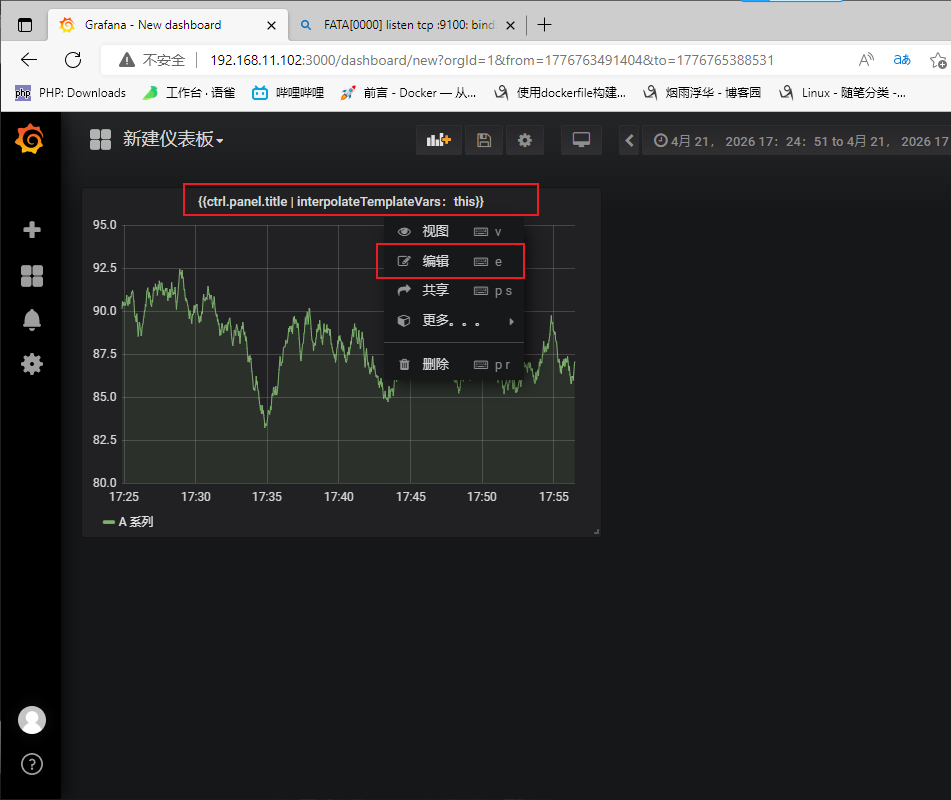
添加数据源——->添加你想查的数据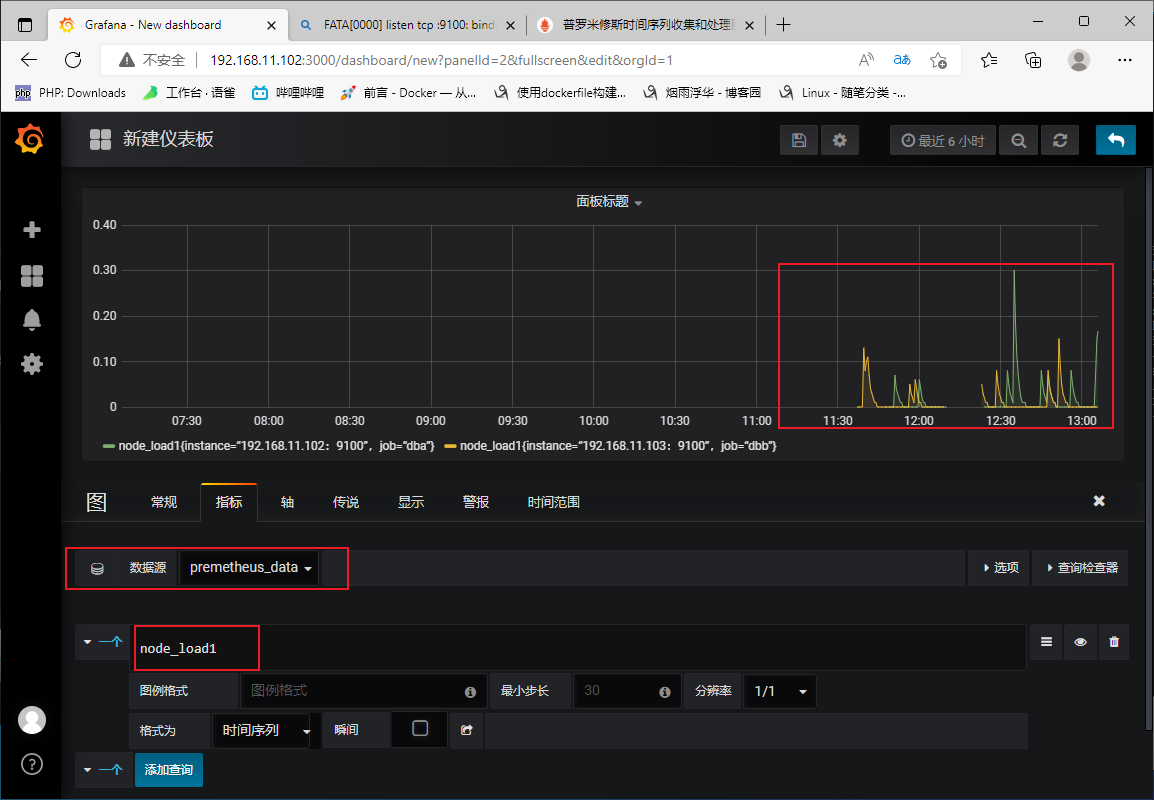
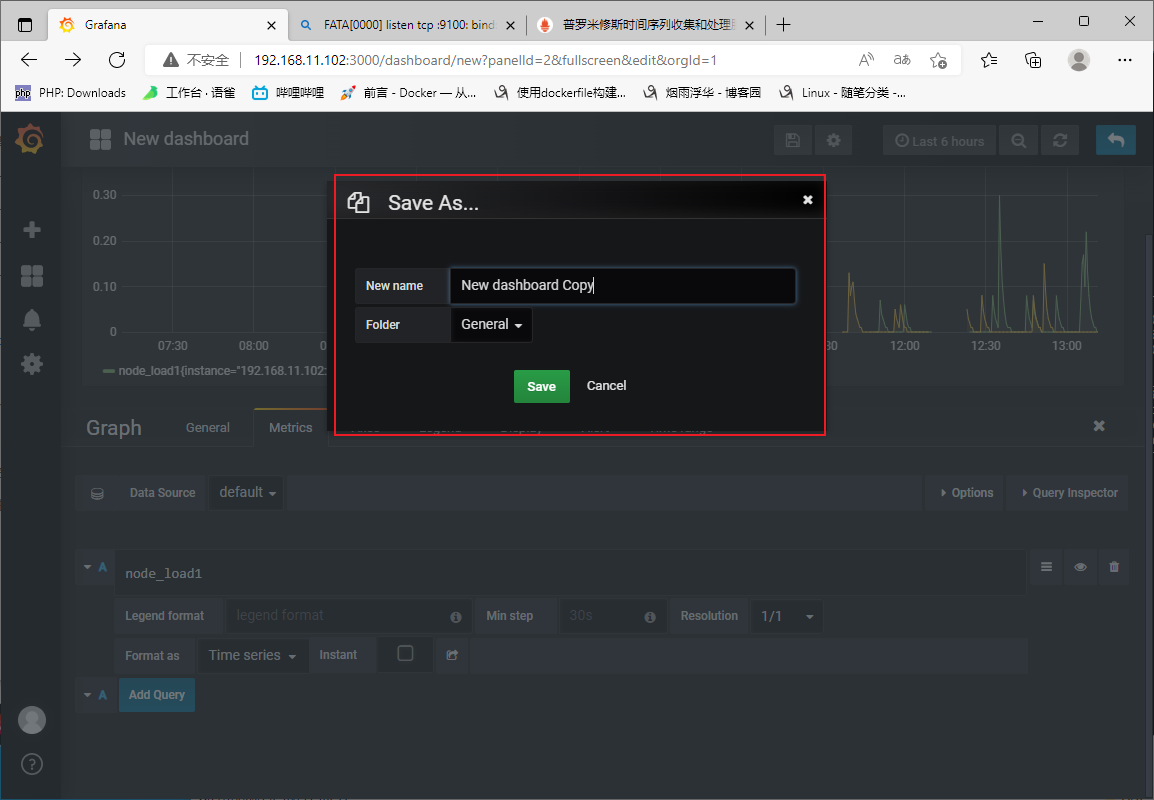
保存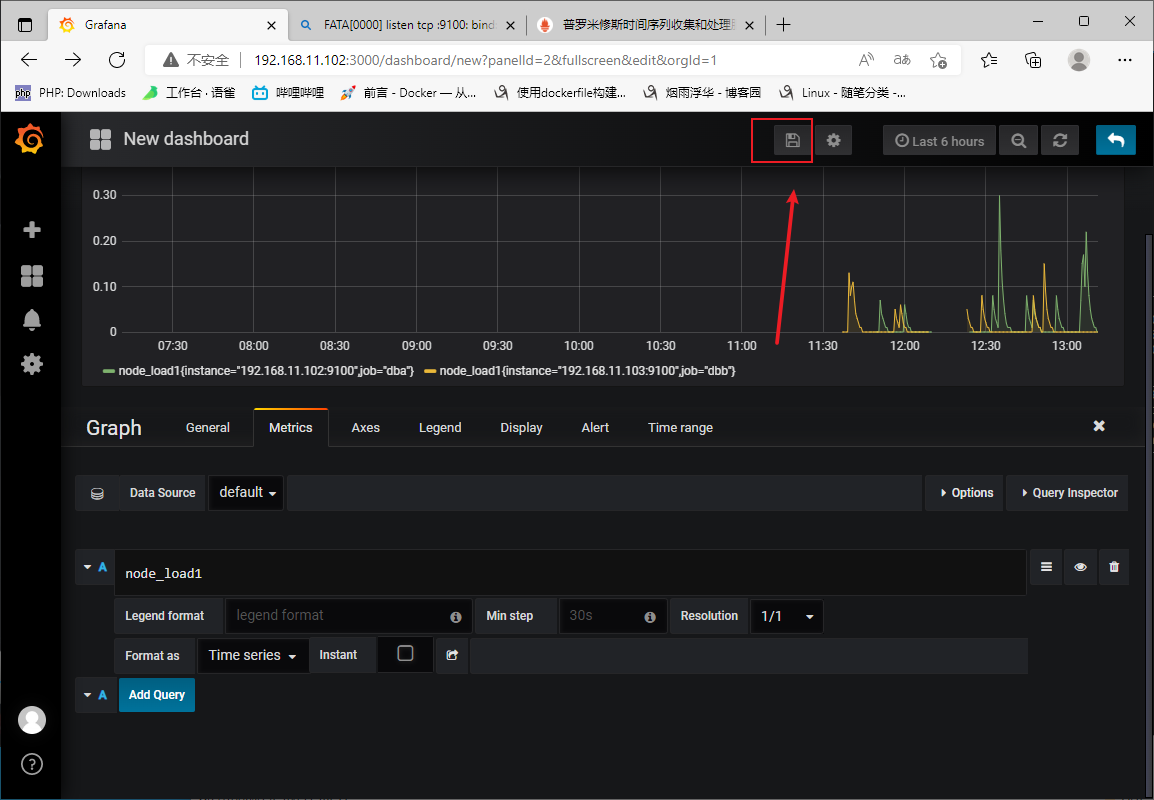
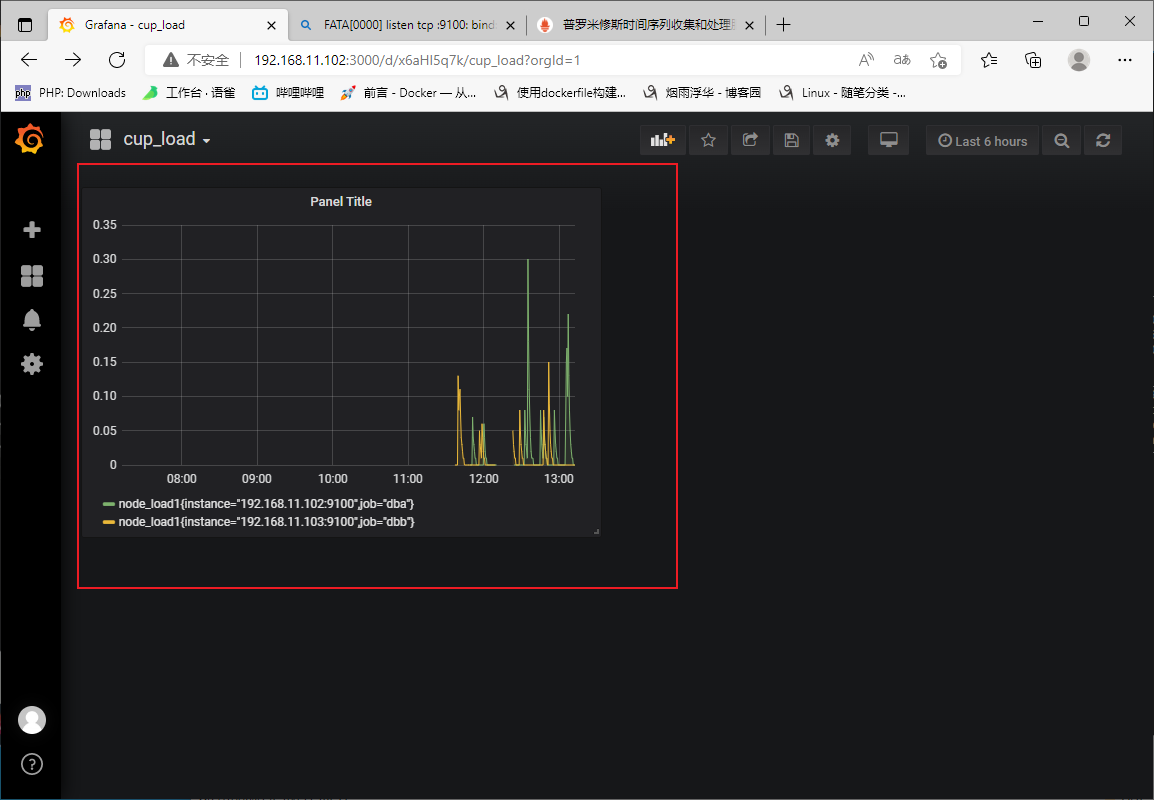
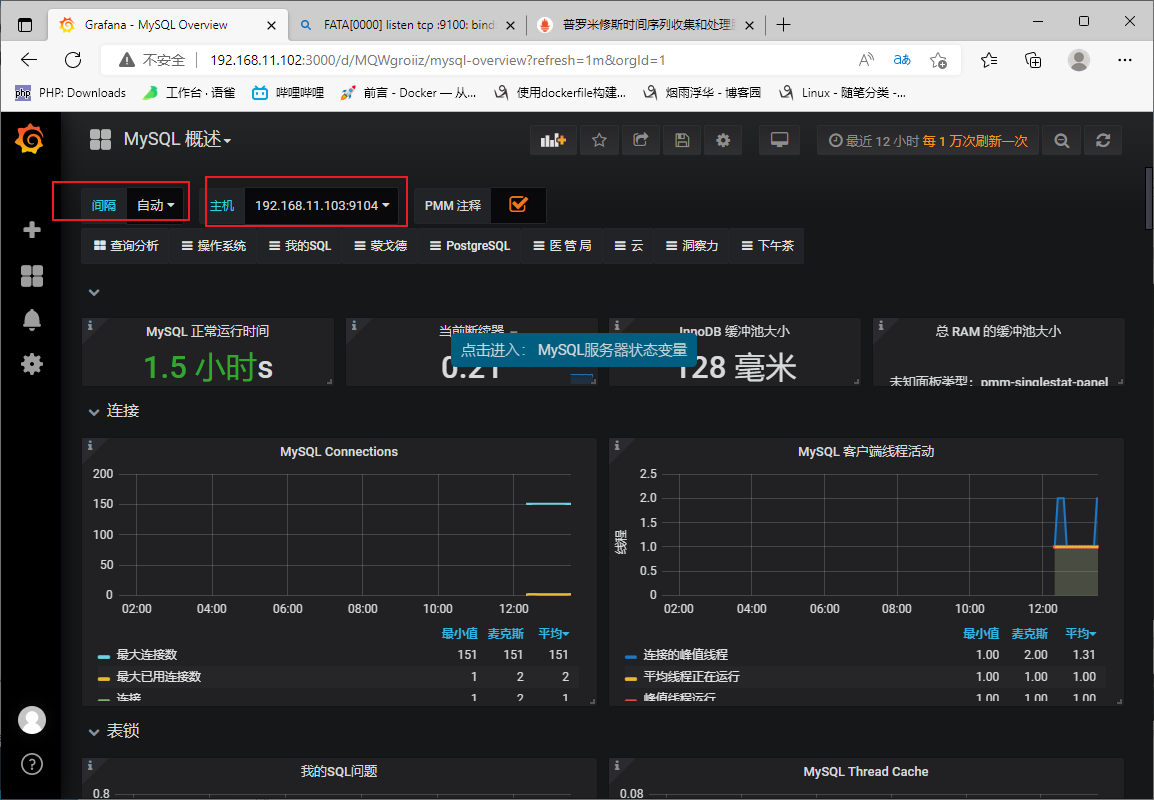
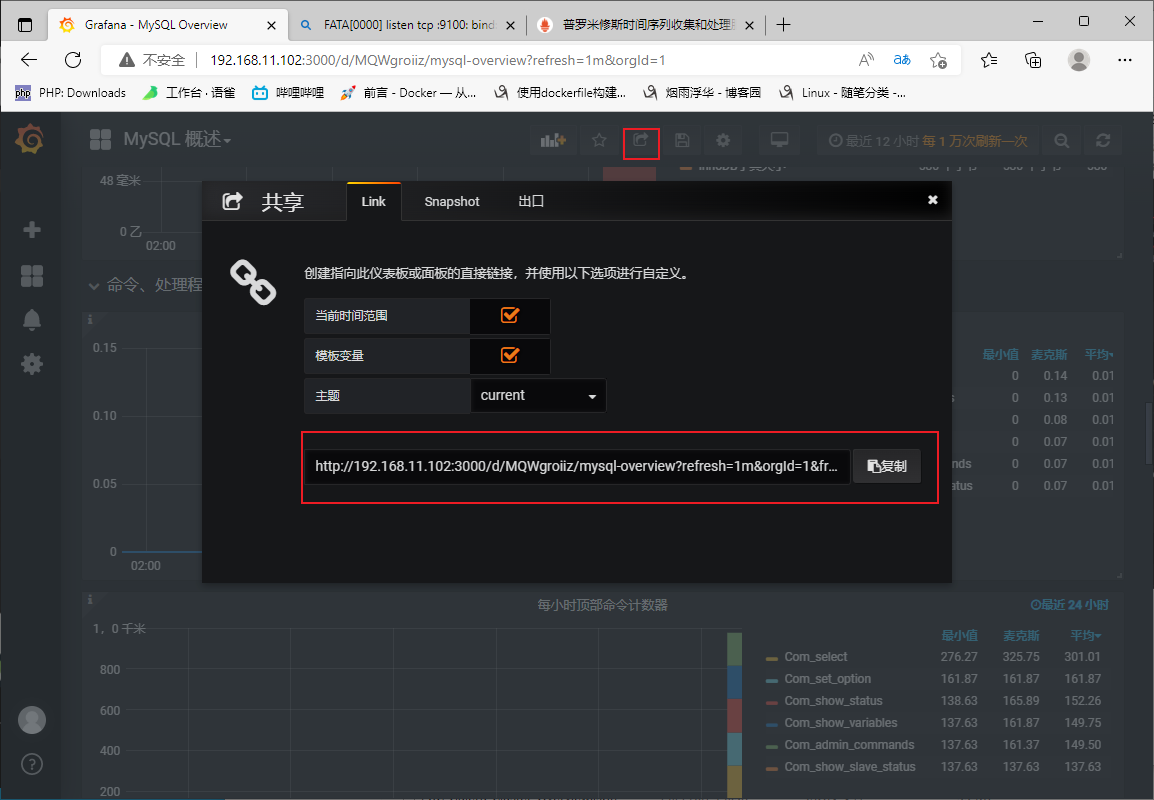
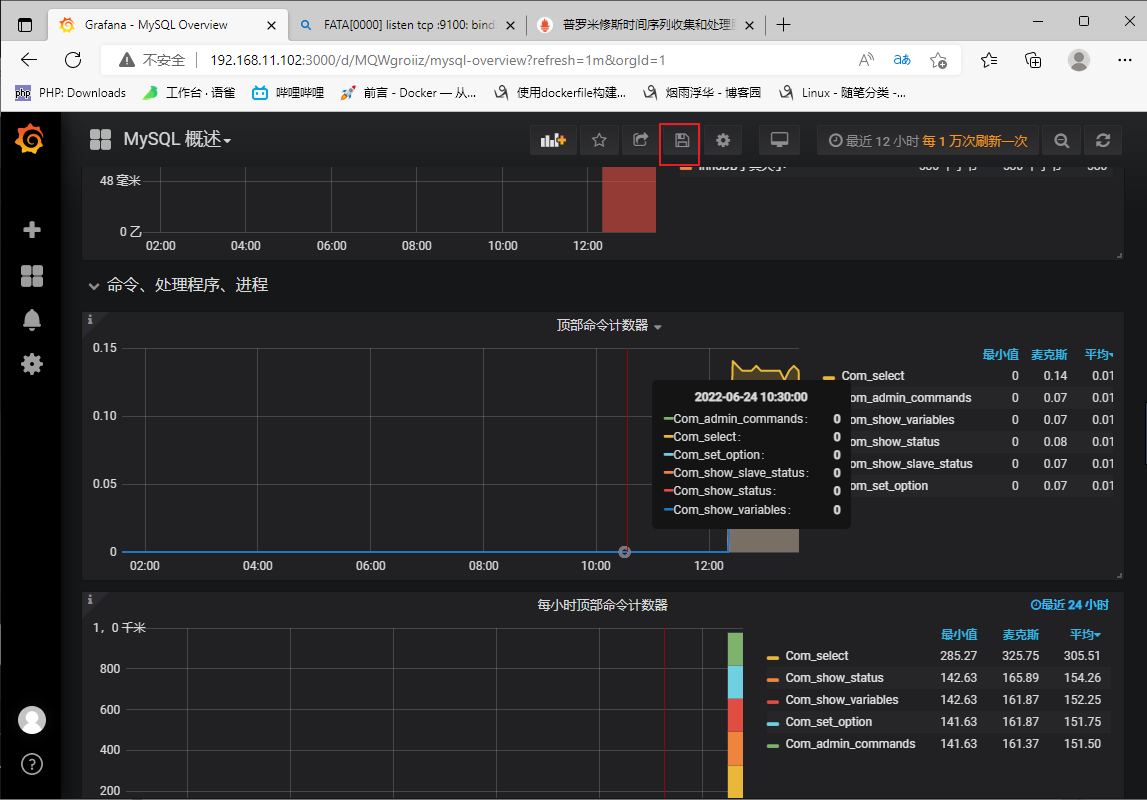
四、grafana图形显示mysql监控数据


五、grafana+onealert报警
需要设置对接的报警通道 (我们这直接对接睿象云)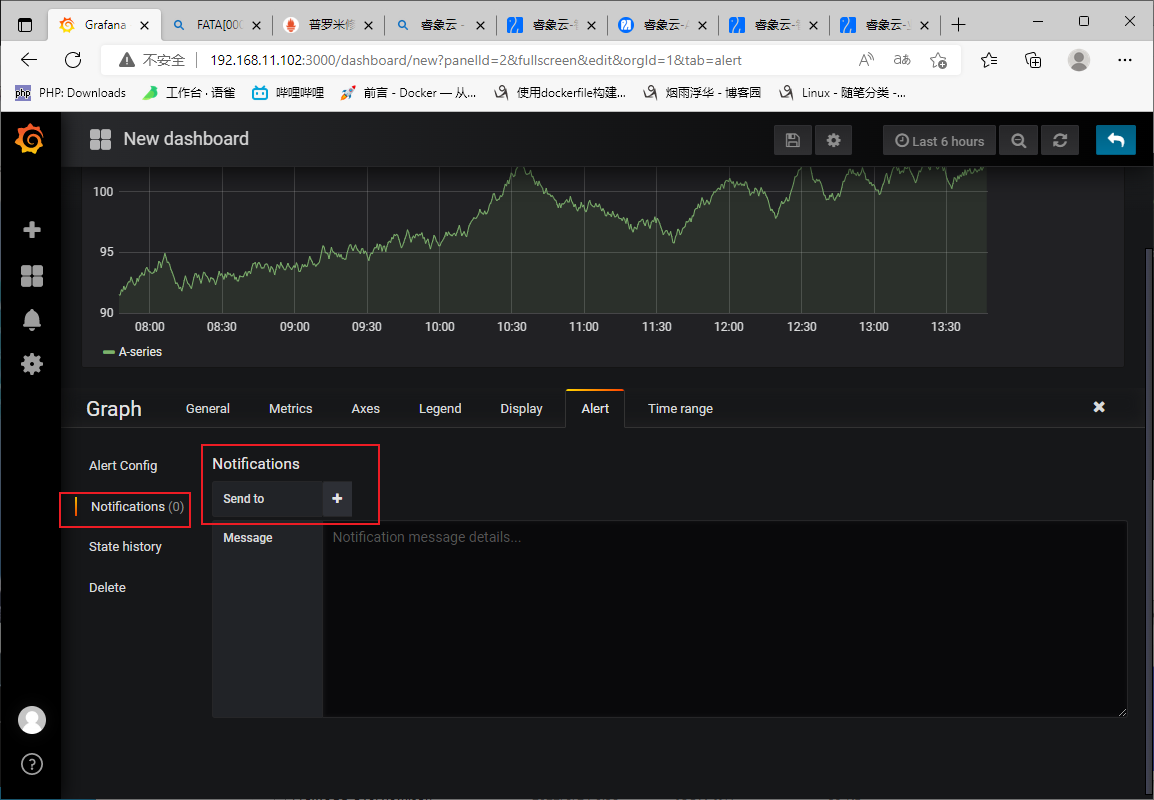 登录使用睿象云平台 登录注册
登录进去后点击智能告警平台
集成——>grafana —>设置名称—->保存应用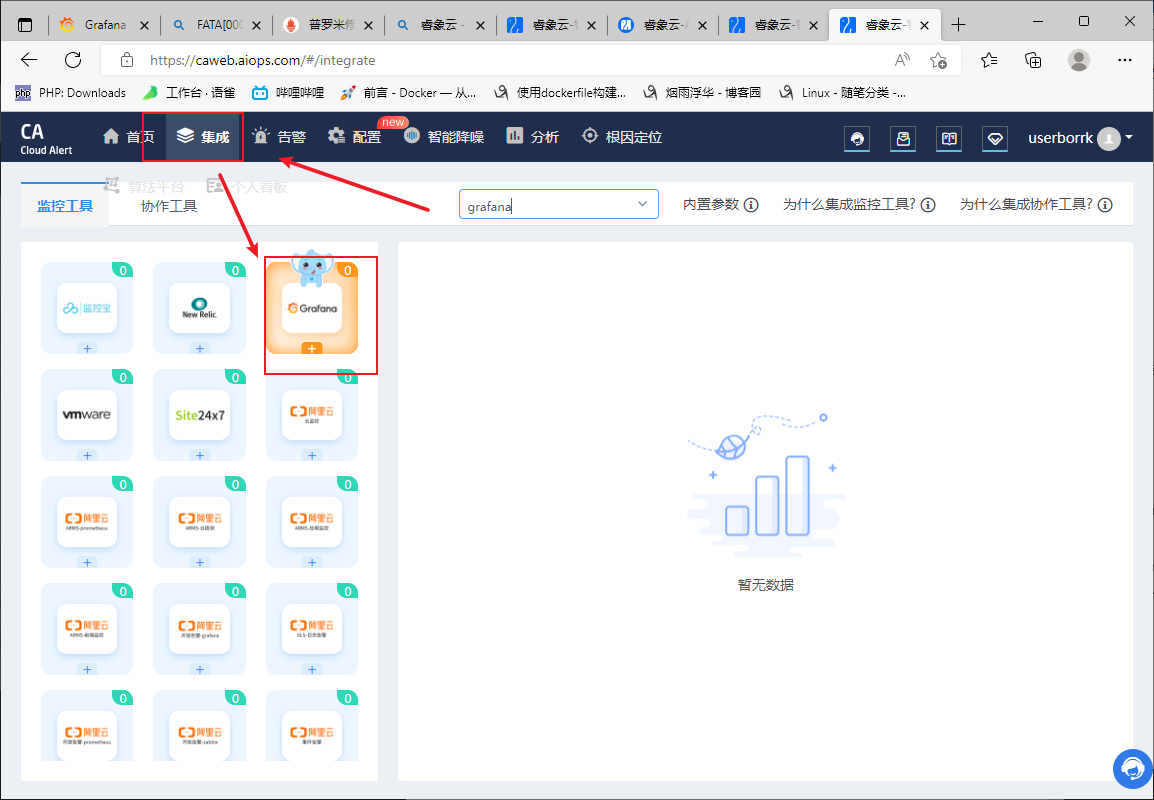
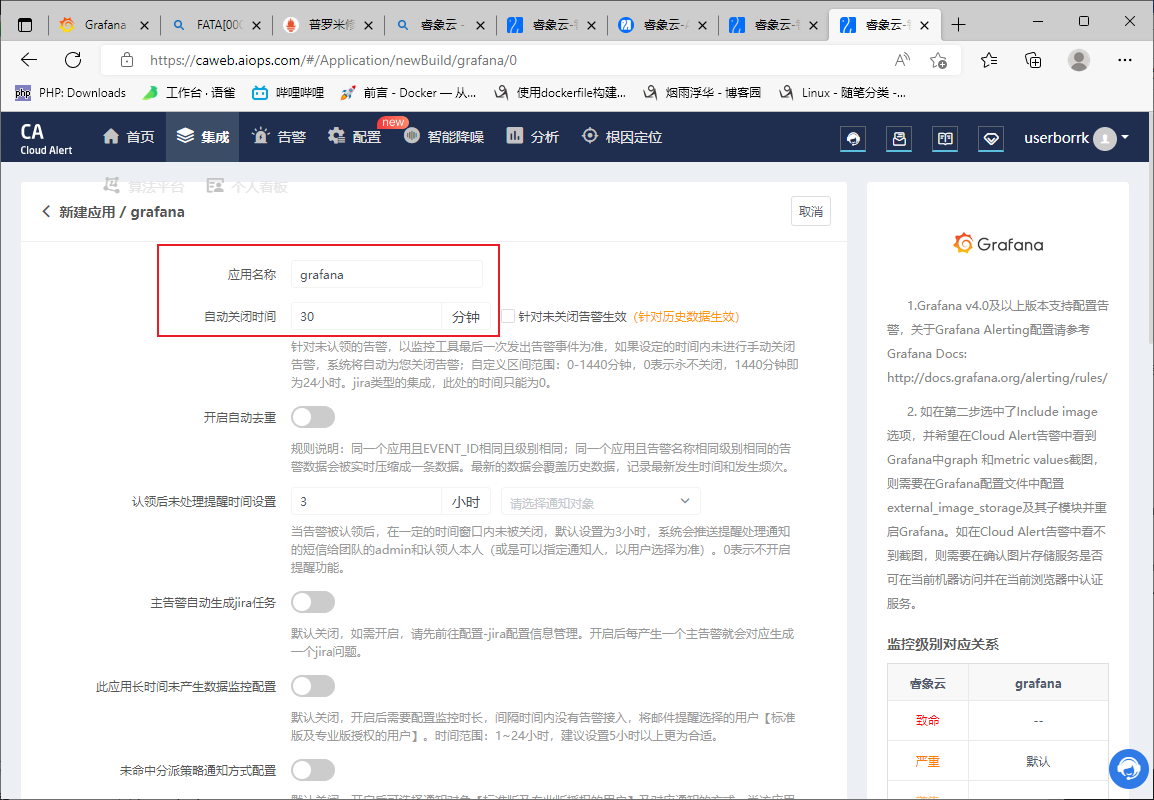
跟着官方文档配置一下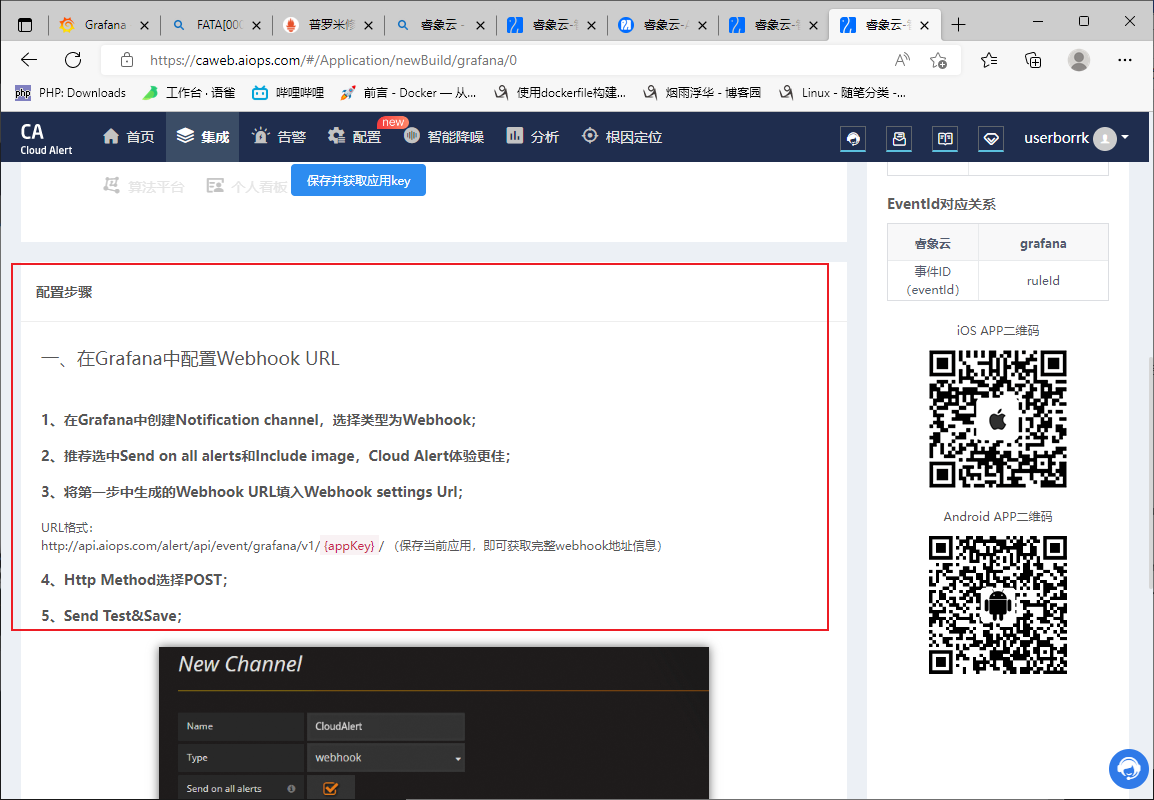
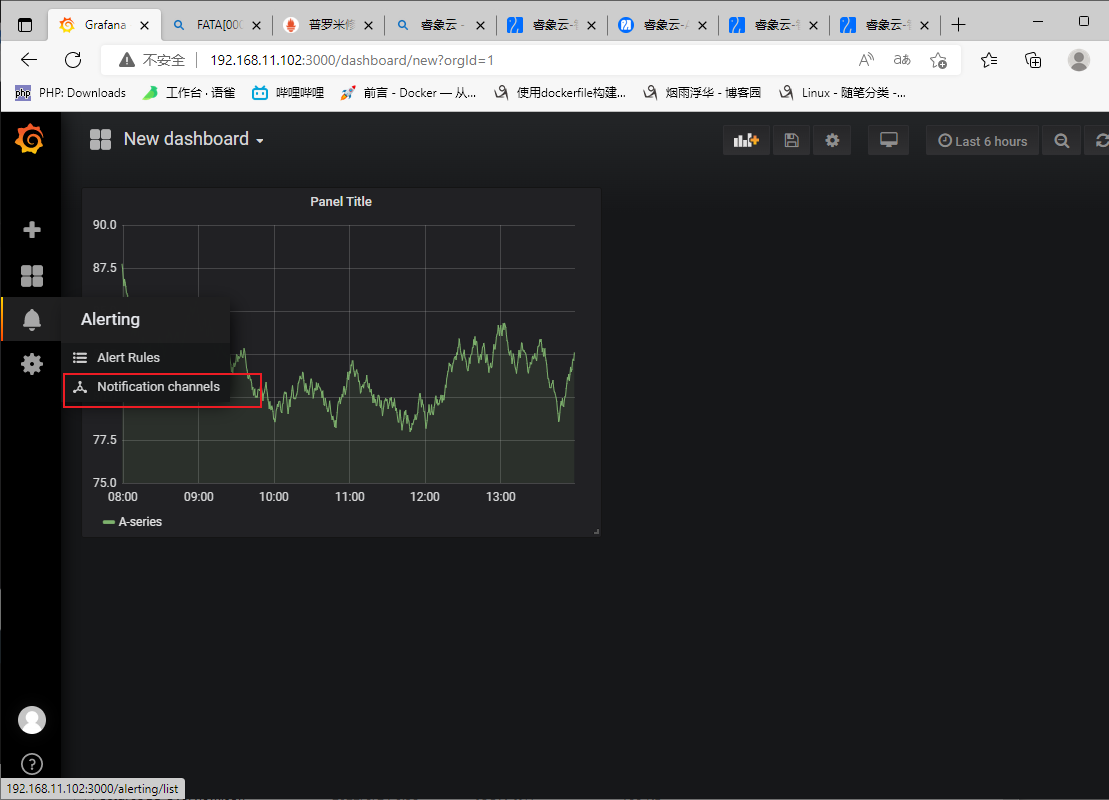
添加通道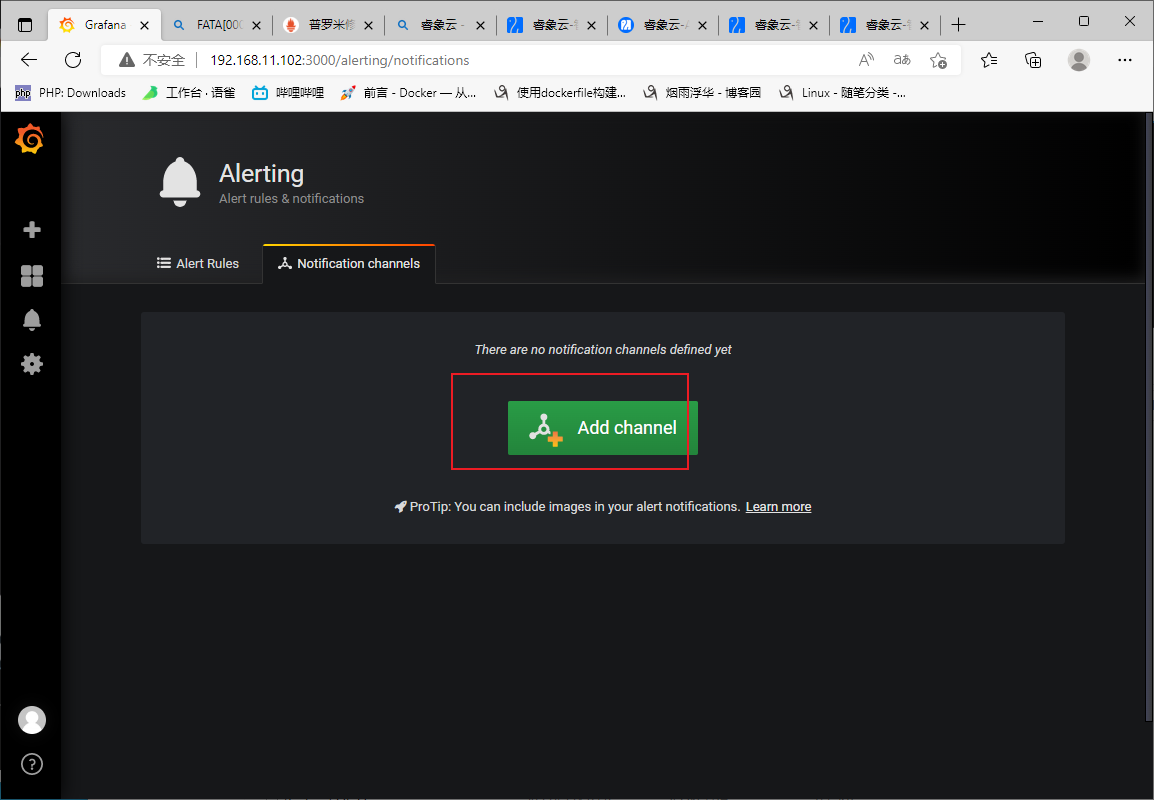

添加报警
确保以有报警通道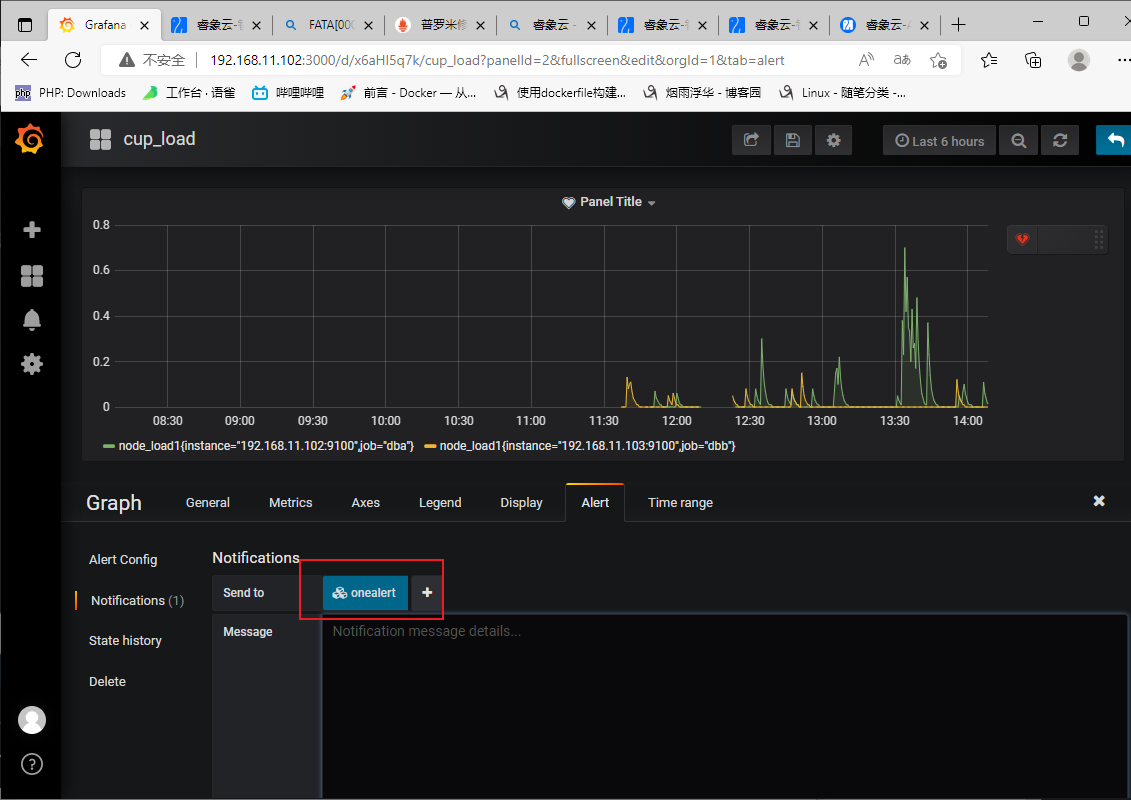
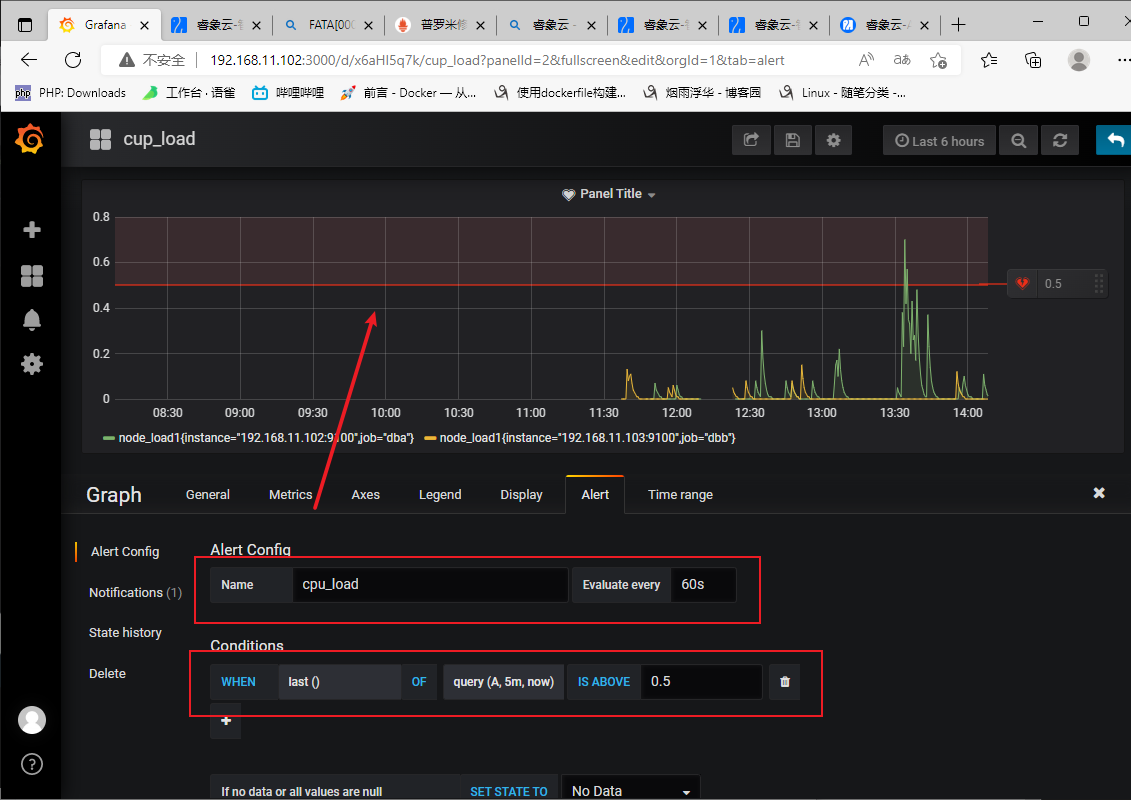
定义报警(自定义)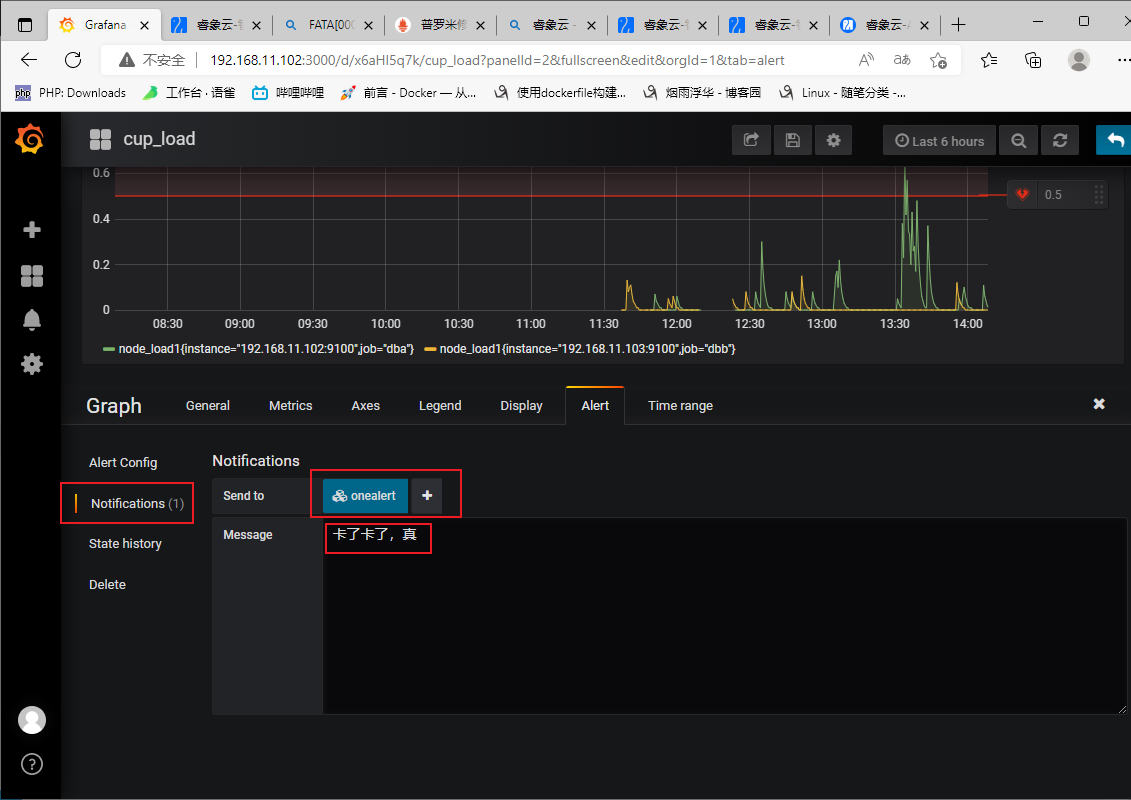
保存
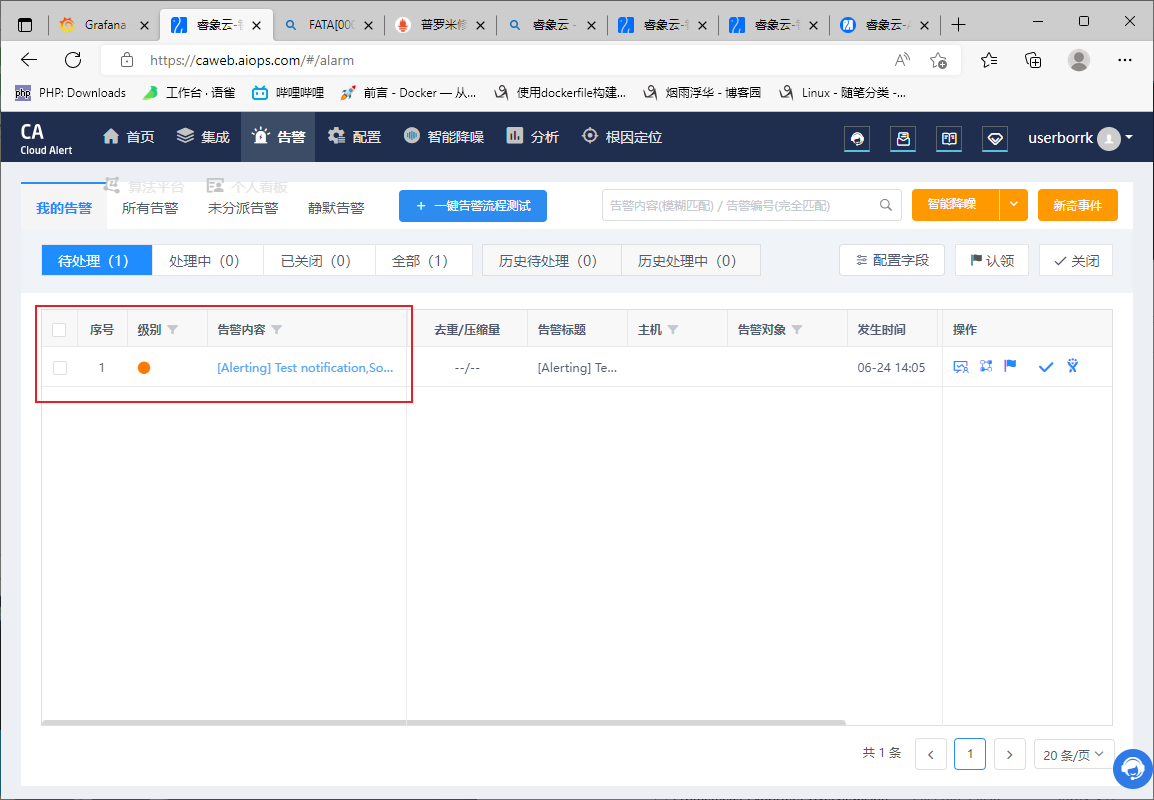
测试

若有收获,就点个赞吧
0 人点赞
