Ant Design Charts 是 G2Plot 的 React 版本,基于 React、TypeScript 封装了所有的 G2Plot 图表,继承了 G2Plot 的所有配置,对 React 技术栈的同学更加友好,同一团队开发。
由于版本更新迭代,下述部分问题可能不会一直存在,请理性观看,蟹蟹୧(๑•̀⌄•́๑)૭!
1. 仪表盘(单色渐变)进度问题
问题描述:当 percent 属性为 0 时进度条会显示为100%状态。
解决方案:
percent: 0.0001// 当数值为0时设置其为0.001
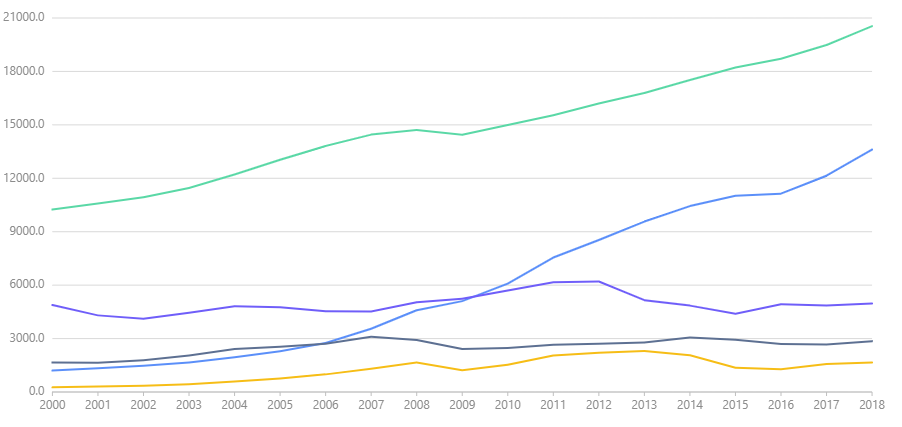
2. 怎么设置横轴从 0 开始
问题描述:横轴默认左右两边有一段距离,需要手都配置,所有带直角坐标系的图表通用。
问题截图: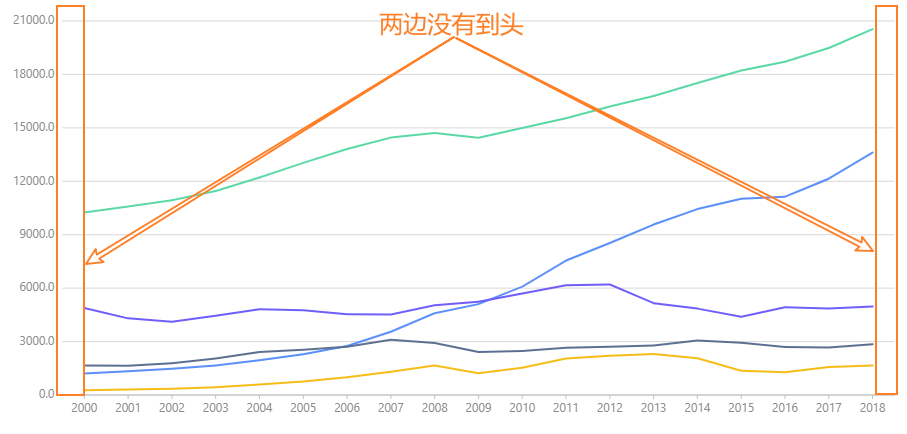
解决方案:
meta: {// 属性字段是什么这里就是什么,例如year表示年份这里就是year:{range: [0, 1]}[xField]: {range: [0, 1]}}
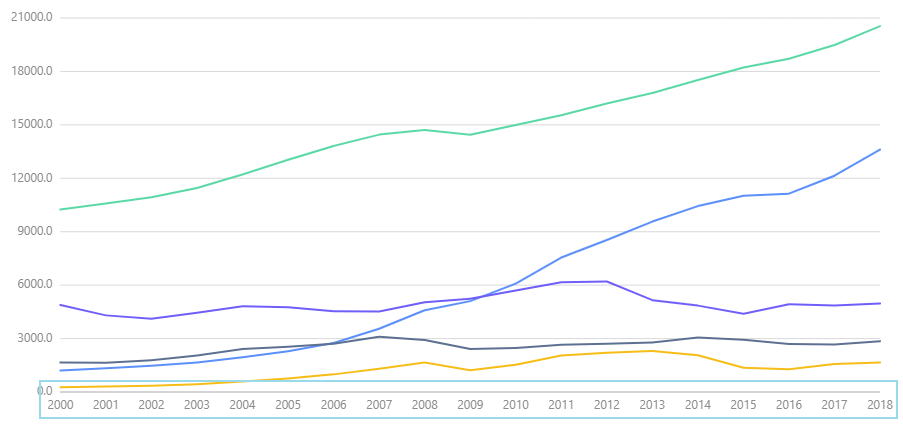
3. 隐藏坐标轴刻度线的配置项
一个容易被忽略的配置项。
问题截图: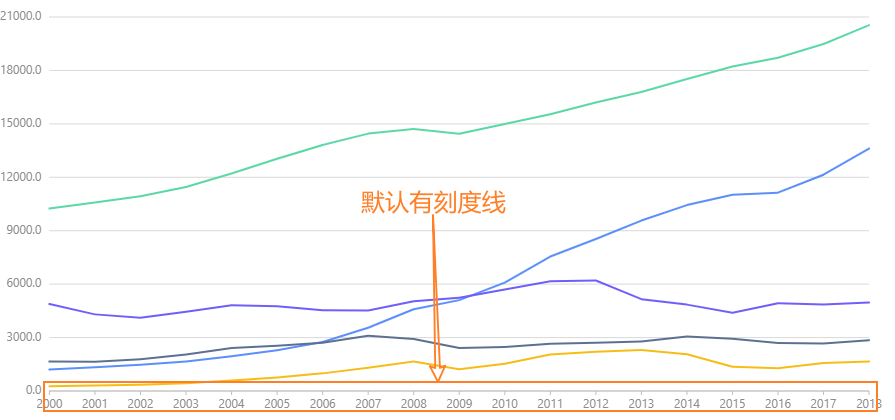
解决方案:
xAxis: { tickLine: false },// x 轴yAxis: { tickLine: false },// y 轴
4. 修改 tooltip 样式
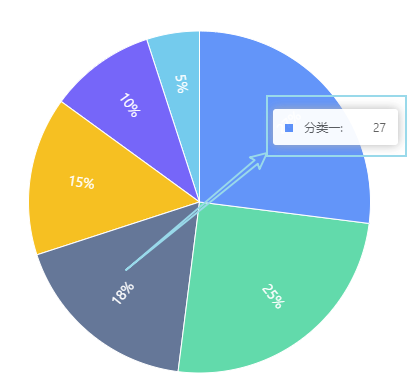
问题描述:修改 tooltip 的小圆点样式为矩形。
问题截图: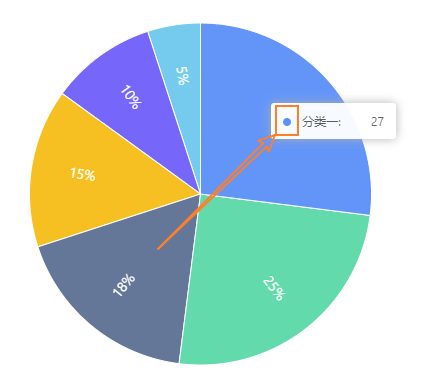
解决方案:
tooltip: {domStyles: { "g2-tooltip-marker": { borderRadius: "0" } }}
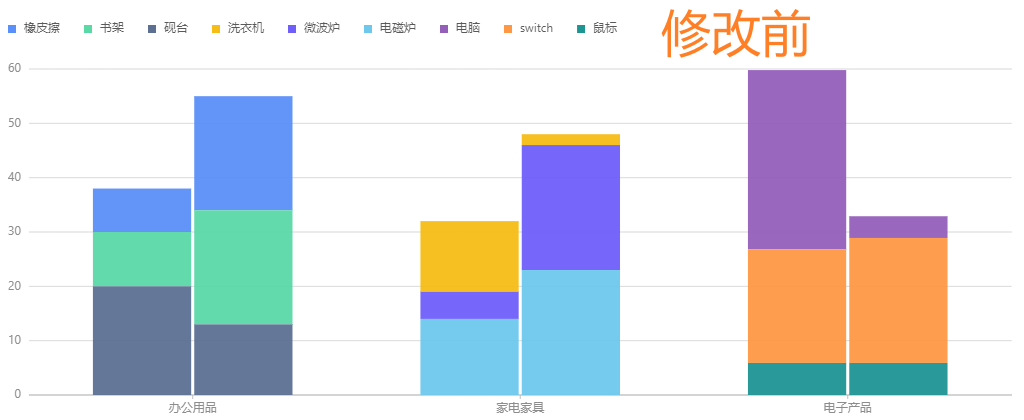
5. 修改 legend 样式
问题描述:修改 legend 小圆点样式为矩形。
问题截图: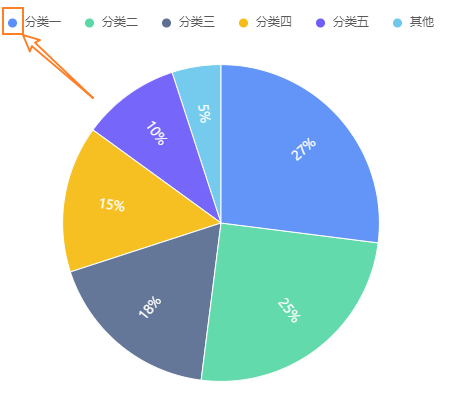
解决方案:
legend: {marker: { symbol: "square" }}
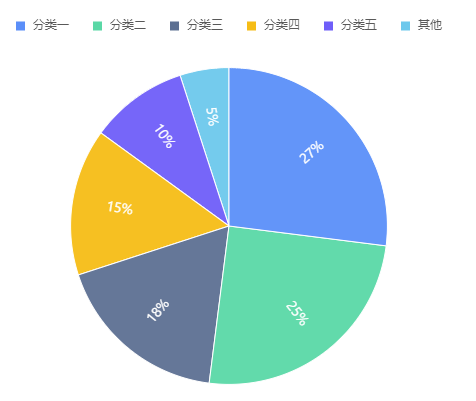
当图表类型为折线时,还需要额外添加配置项:
marker: {symbol: "square",style: item => ({ ...item, fill: item.stroke })}
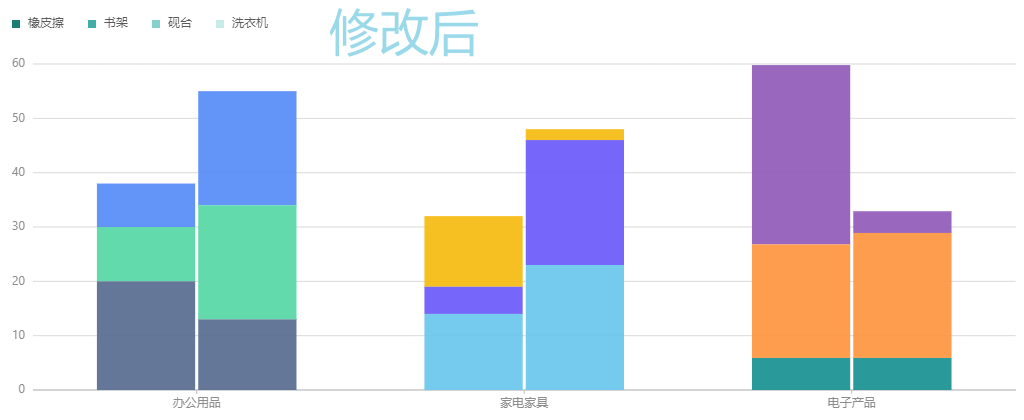
6. 自定义 legend
解决方案:
legend: {position: 'top-left',marker: { symbol: 'square' },// 关键代码custom: true,items: [// name 需要和数据对应起来,才能有效果{ name: '橡皮擦', marker: { style: { fill: '#177D77' } } },{ name: '书架', marker: { style: { fill: '#43AEA8' } } },{ name: '砚台', marker: { style: { fill: '#81D2CD' } } },{ name: '洗衣机', marker: { style: { fill: '#C6EDEA' } } }]}
