<div class="content_lisechart"><div id="myChart" :style="{width: '100%', height: '100%'}"></div><div class="content_lisechartpos"><div class="content_lisechartpos_lis"><span>90</span><span>分</span></div><div class="content_lisechartpos_lis2"><p>超越 <span>58%</span>的用户</p><p>谨慎型</p></div></div</div>
.content_lisechartpos {width: 190px;height: 190px;border-radius: 50%;position: absolute;top: 0;right: 0;left: 0;bottom: 0;margin: auto;// background: rgba(0,0,0,0.5);.content_lisechartpos_lis {padding-top: 10px;box-sizing: border-box;text-align: center;// border-bottom: 1px solid #CCCCCC;;position: relative;span:nth-child(1) {font-size: 68px;font-family: Barlow-SemiBold;line-height: 82px;color: #424854;opacity: 1;}span:nth-child(2) {font-size: 25px;font-family: FZLTHJW--GB1-0;line-height: 30px;color: #424854;opacity: 1;}}.content_lisechartpos_lis:after {content: " ";width: 90%;height: 1px;background: #CCCCCC;position: absolute;bottom: 0;left: 0;right: 0;margin: auto;}}
//rem 图表搭配remToPx(rem) {const fontSize = document.documentElement.style.fontSize;return Math.floor(rem * fontSize.replace('px', ''));},// 案例图表drawLine() {var that = this;var getvalue = [88];let myChart = that.$echarts.init(document.getElementById('myChart'))myChart.setOption({title: {// text: getvalue + '分',// textStyle: {// color: '#28BCFE',// fontSize: this.remToPx(.5),// },// subtext: '综合得分',// subtextStyle: {// color: '#666666',// fontSize:this.remToPx(.5),// },// itemGap:this.remToPx(.1),// left: 'center',// top: '43%',},tooltip: {formatter: function(params) {return '<span style="color: #fff;">综合得分:' + getvalue + '分</span>';},},angleAxis: {max: 100,clockwise: true, // 逆时针// 隐藏刻度线show: false,startAngle: 200, //起始角度},radiusAxis: {type: 'category',show: true,axisLabel: {show: false,},axisLine: {show: false,},axisTick: {show: false,},},polar: {center: ['50%', '50%'], //设置圆居中radius: '150%', //图形大小},series: [{type: 'bar',data: getvalue,showBackground: true,backgroundStyle: {color: '#BDEBFF',},itemStyle: {normal: {// 设置阴影shadowBlur: that.remToPx(.3),shadowColor: '#34BCFF',shadowOffsetX: that.remToPx(-0.1),shadowOffsetY: that.remToPx(0.1)}},coordinateSystem: 'polar',roundCap: true,barWidth: that.remToPx(.2),itemStyle: {normal: {opacity: 1,color: new that.$echarts.graphic.LinearGradient(0, 0, 0, 1, [{offset: 0,color: '#25BFFF',},{offset: 1,color: '#5284DE',},]),shadowBlur: that.remToPx(.1),shadowColor: '#2A95F9',},},}, ],})},//vue 可直接引入 this.getDefaultSelected(myChart)//原生https://www.makeapie.com/editor.html?c=xaoiOl5b5m 案例已写好getDefaultSelected(myChart) {let index = 0;myChart.dispatchAction({type: 'highlight',seriesIndex: 0,dataIndex: 0,});myChart.on('mouseover', (e) => {if (e.dataIndex !== index) {myChart.dispatchAction({type: 'downplay',seriesIndex: 0,dataIndex: index,});}});myChart.on('mouseout', (e) => {index = e.dataIndex;myChart.dispatchAction({type: 'highlight',seriesIndex: 0,dataIndex: e.dataIndex,});});},
项目已经公用希望帮的到你
饼图: https://www.makeapie.com/editor.html?c=xaoiOl5b5m
效果图: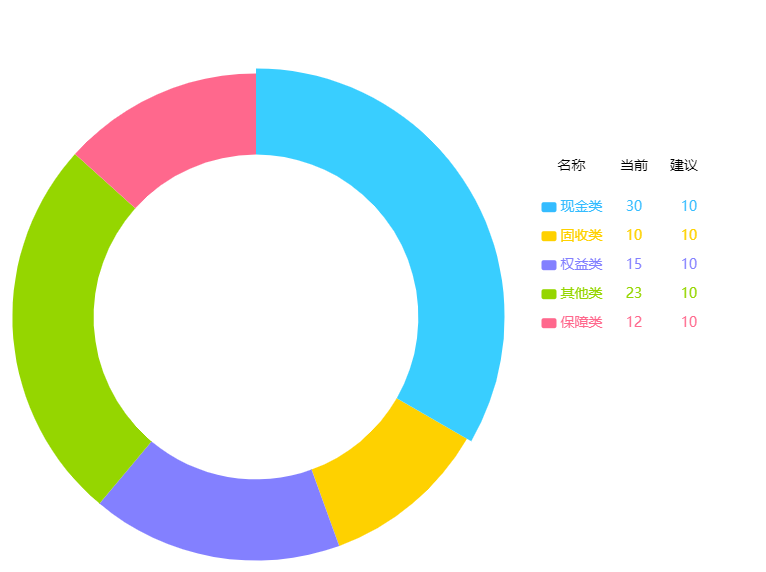
圆 : https://www.makeapie.com/editor.html?c=xk9Rxce3F6&v=2
效果图:

若有收获,就点个赞吧
0 人点赞
