效果
黑色指针会指向最新的遥测数据的温度值。温度实时变化指针左右摇摆。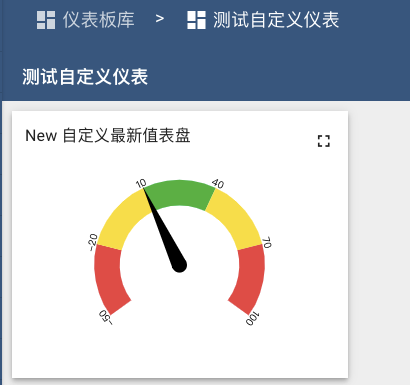
先提一下仪表小部件开发需要了解的内容,以免js代码不明白。
基本小部件API
官网介绍https://thingsboard.io/docs/user-guide/contribution/widgets-development/#basic-widget-api
需要了解
- 内置变量上下文有哪些属性
- 小部件的JavaScript函数
- 内置变量上下文 的订阅对象的字段(defaultSubscription)很多数据都是从这个属性获取
- 时间窗口函数
- 控制API
- 操作API
- 仪表板状态控制器
上下文属性使用 self.ctx.xxproperty来获取
文档中列出的所有属性都可以这样调用,例如:
小部件容器高度 获取: var height=self.ctx.height 设置:self.ctx.height = 60;
遇到undefined等错误可以用window.alert(JSON.stringify(data))来调试。
开始
- 在部件库中新建一个部件包
- 点击右下角大加号,单击“创建新小部件类型”按钮
- 选择窗口部件类型->最新值
打开“RESOURCES”选项卡,单击“添加”,然后插入以下链接:
https://bernii.github.io/gauge.js/dist/gauge.min.js
清除CSS选项卡的内容。
HTML选项卡加入下面的html代码
<canvas id="my-gauge"></canvas>
左下角Javascript插入js代码,不要感觉多 就下面的三个方法重要,opts就是gauge.js的配置!gauge官网拷贝的! ```javascript var canvasElement; var gauge;
var opts = { angle: -0.2, // The span of the gauge arc lineWidth: 0.2, // The line thickness radiusScale: 1, // Relative radius pointer: { length: 0.6, // // Relative to gauge radius strokeWidth: 0.035, // The thickness color: ‘#000000’ // Fill color }, limitMax: false, // If false, max value increases automatically if value > maxValue limitMin: false, // If true, the min value of the gauge will be fixed colorStart: ‘#6F6EA0’, // Colors colorStop: ‘#8FC0DA’, // just experiment with them strokeColor: ‘#E0E0E0’, // to see which ones work best for you generateGradient: true, highDpiSupport: true, // High resolution support staticLabels: { font: “10px sans-serif”, // Specifies font labels: [-50, -20, 10, 40, 70, 100], // Print labels at these values color: “#000000”, // Optional: Label text color fractionDigits: 0 // Optional: Numerical precision. 0=round off. }, staticZones: [ {strokeStyle: “#F03E3E”, min: -50, max: -20}, // Red from 100 to 130 {strokeStyle: “#FFDD00”, min: -20, max: 10}, // Yellow {strokeStyle: “#30B32D”, min: 10, max: 40}, // Green {strokeStyle: “#FFDD00”, min: 40, max: 70}, // Yellow {strokeStyle: “#F03E3E”, min: 70, max: 100} // Red ], };
self.onInit = function() { canvasElement = $(‘#my-gauge’, self.ctx.$container)[0]; gauge = new Gauge(canvasElement).setOptions(opts); gauge.minValue = -50; gauge.maxValue = 100; gauge.animationSpeed = 32; self.onResize(); }
self.onResize = function() { canvasElement.width = self.ctx.width; canvasElement.height = self.ctx.height; gauge.update(true); gauge.render(); }
self.onDataUpdated = function() {
//这里看不懂就去官网文档了解下上下文的属性
//https://thingsboard.io/docs/user-guide/contribution/widgets-development/
data = self.ctx.defaultSubscription.data
//这里不判断的话 会报undefined异常
if(data[0].data[0] != undefined){
gauge.set(data[0].data[0][1]);
}
}
点击运行查看效果。效果可能会逐渐扭曲。类似这样<br />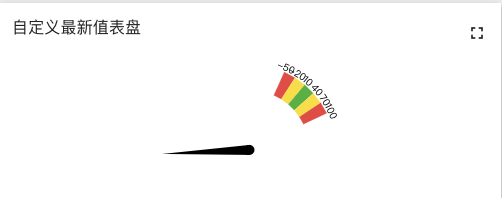<br />这个和代码中的最大值最小值有关。实际应用如果温度不超过此范围是不会有问题的。<br />gauge.minValue = -50; <br />gauge.maxValue = 100;<a name="Rc9Sm"></a>## 应用创建一个设备,复制访问令牌,通过mqttbox上传遥测数据```json{"temperature":10}{"temperature":70}
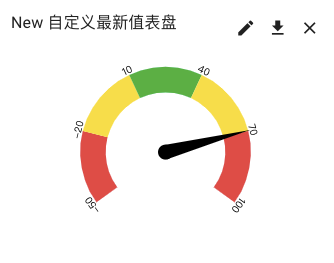
到仪表盘库添加仪表盘,选择自定义的部件包中的最新值组件。并添加数据源指向之前创建的设备的temperature属性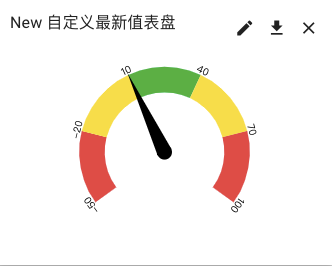

若有收获,就点个赞吧
0 人点赞
