背景 :
项目中需要使用到 charts图表,技术方案定的是用 uCharts 插件。
关于uCharts :
- 官方文档 : https://www.ucharts.cn/
- uCharts 分为 v1 和 v2 两个版本。
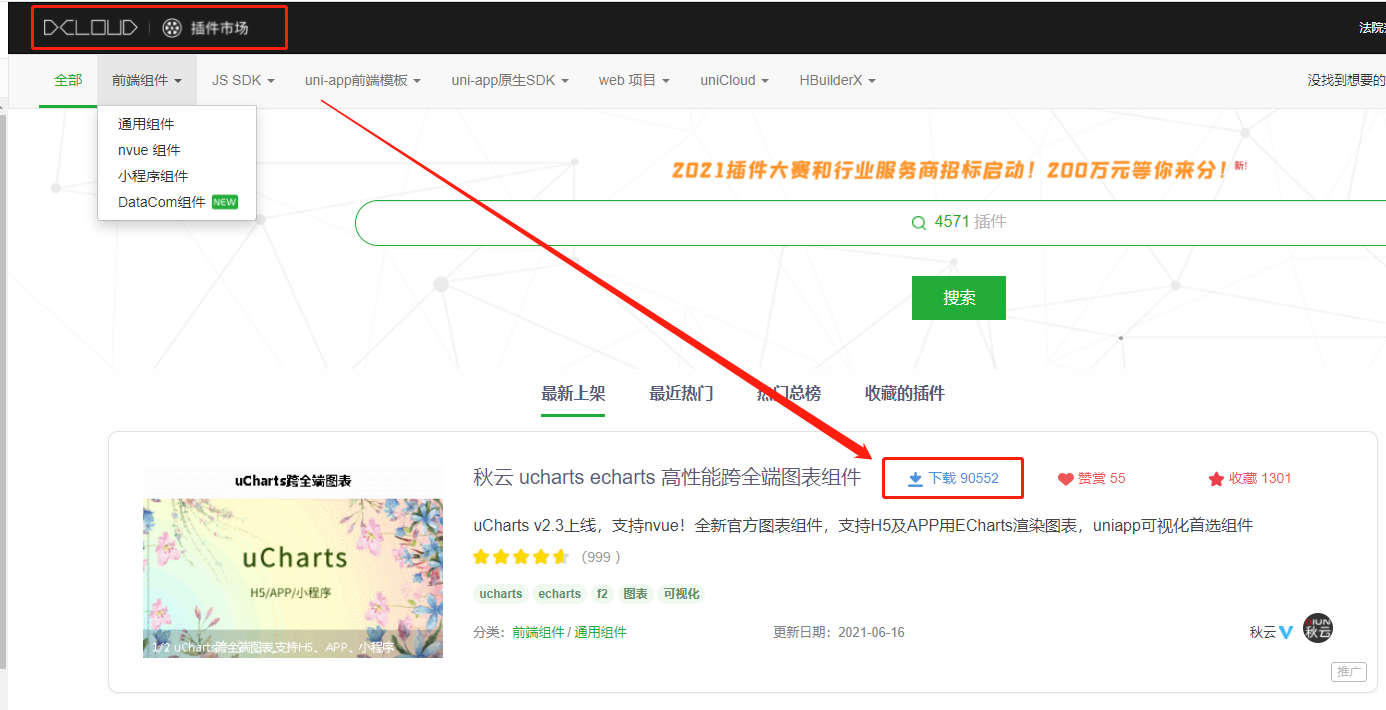
使用uCharts :
- 下载插件 -> 进入DClound插件市场进行下载
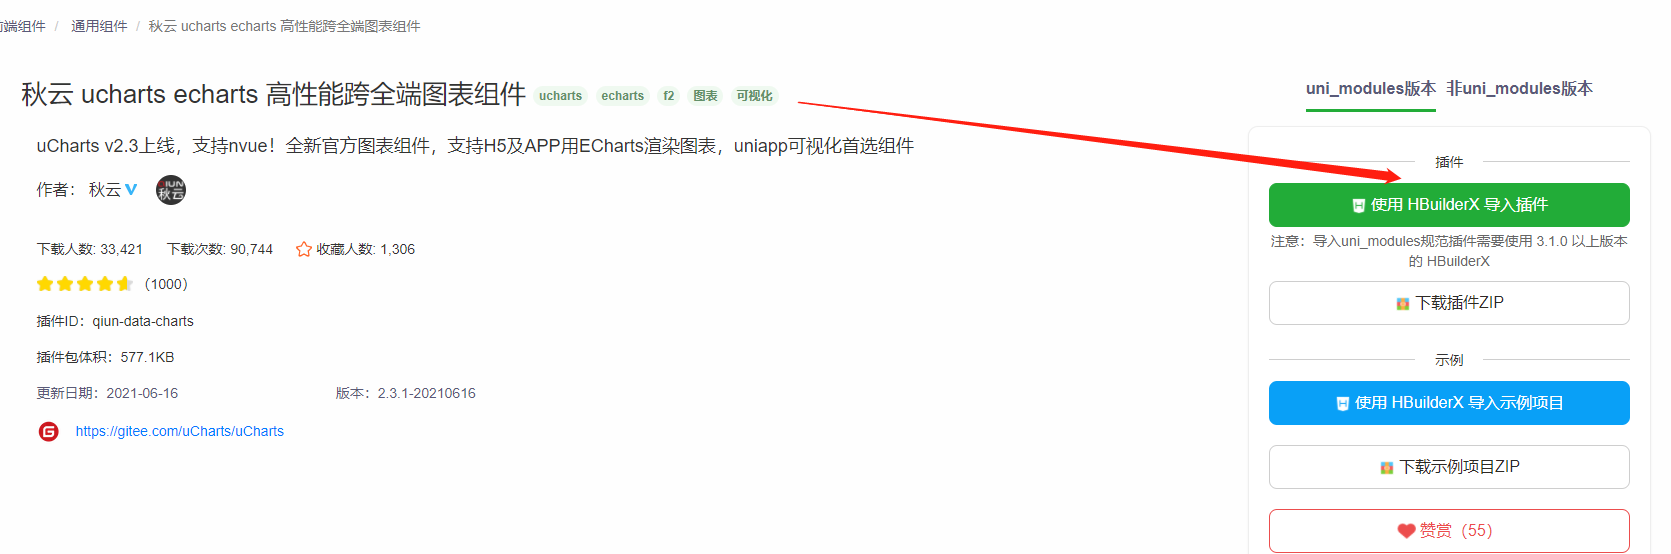
- 插件的使用, 分为两个版本: v1 和 v2 -> 两个版本使用方法不同。具体见以下示例
————————————————————- Demo 分割线————————————————————————————————-
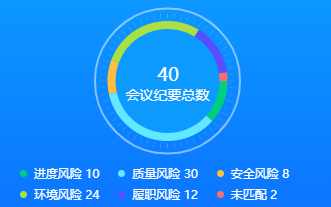
V1 版本
<template><view><canvas canvas-id="canvasRing" id="canvasRing" class="charts"></canvas></view></template><script>import uCharts from '@/components/u-charts/u-charts.js';let _self;export default {data() {return {ballSeries: {series: []},ballCount: 40,cWidth: '',cHeight: '',pixelRatio: 1,eunmList: [{key: '5',name: '进度风险',data: 10,color: '#00CF7D'},{key: '4',name: '质量风险',data: 30,color: '#64E8FF'},{key: '3',name: '安全风险',data: 8,color: '#FFBD3F'},{key: '3',name: '环境风险',data: 24,color: '#AAE044'},{key: '3',name: '履职风险',data: 12,color: '#594DFF'},{key: '3',name: '未匹配',data: 2,color: '#FF6A6A'},],}},mounted() {_self = this;this.cWidth = uni.upx2px(750);this.cHeight = uni.upx2px(300);this.showRing("canvasRing", this.eunmList, this.ballCount);},methods: {showRing(canvasId, chartData, count) {_self.pixelRatio = 1new uCharts({$this: _self,canvasId: canvasId,canvas2d: true,type: 'ring',fontSize: 11,padding: [5, 5, 5, 5],// 图例配置legend: {show: false,position: 'right',float: 'center',itemGap: 10,padding: 5,lineHeight: 26,margin: 5,borderWidth: 1},background: '#0c9aff',pixelRatio: _self.pixelRatio,series: chartData,animation: true,width: _self.cWidth * _self.pixelRatio,height: _self.cHeight * _self.pixelRatio,disablePieStroke: true,// 区域占比提示dataLabel: false,subtitle: {name: '会议纪要总数',color: '#ffffff',fontSize: 14 * _self.pixelRatio,},title: {name: count,color: '#ffffff',fontSize: 18 * _self.pixelRatio,fontWight: 500},extra: {pie: {offsetAngle: 0,// 圆环的宽度ringWidth: 8 * _self.pixelRatio,labelWidth: 15}},});},}}</script>
V2 版本
<template><view><view class="charts-box"><qiun-data-charts type="bar" canvas2d :chartData="chartData" :opts="chartOpts" background="none" canvasId="through_stack_bar" /></view></view></template><script>import qiunDataCharts from './qiun-data-charts/components/qiun-data-charts/qiun-data-charts.vue';let _self;export default {components: {qiunDataCharts,},data() {return {cWidth: '',cHeight: '',chartData: {categories: ["火车东站项目","萧山机场项目","凤起路广场项目","希尔顿酒店项目",],series: [{"name": "进度风险","legendShape": "square","data": [35,36,31,33,]},{"name": "质量风险","legendShape": "square","data": [18,27,1,4,]},{"name": "安全风险","legendShape": "square","data": [8,7,21,24,]}, {"name": "履职风险","legendShape": "square","data": [18,2,2,24,]}],},chartOpts: {"type": "bar","canvasId": "through_stack_bar","canvas2d": true,"background": "none","dataLabel": false, // 隐藏图形上数据"color": ["#00C083","#3996FF","#FFBD3F","#90A9FF",],"xAxis": {"disabled": true,"disableGrid": true, // 隐藏x做标轴 及 x轴分割线},"yAxis": {"disableGrid": true,"showTitle": false,},"extra": {"bar": {"type": "stack", // 堆叠柱状图"width": 20,"axisLine": false,},}}}},methods: {},mounted() {_self = this;this.cWidth = uni.upx2px(750);this.cHeight = uni.upx2px(300);},}</script><style lang="scss">.charts-box {background: #fff;}</style>
- 下载v2版本,应用到项目中(我这里因为只有自己使用的是v2 , 业务上需要实现堆叠条状图,v1版本不支持。所以我把v2的包放在自己的目录里面,目的是分包打包,减小主应用体积)
- 修改包引用路径(下载到的目录是umi-modules,使用是components)
- 在业务组件中引用 qiun-data-charts
- 配置chartData(数据) 、opts(图表配置项)、canvasId(图标Id)
运行效果: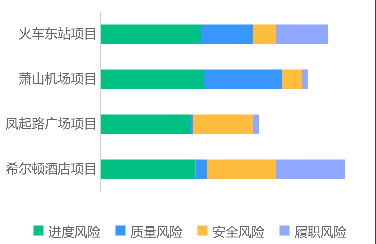

若有收获,就点个赞吧
0 人点赞
