F2 可视化方案 饼图 和 进度条
文档
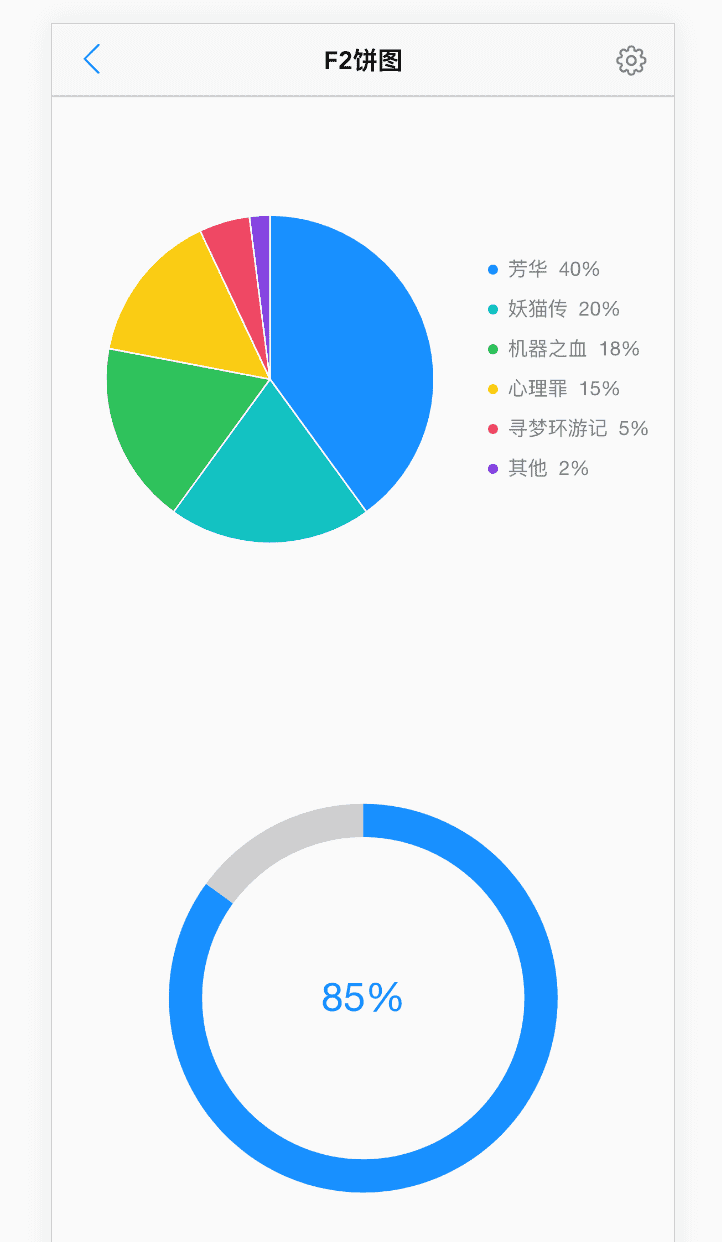
ui 组件中集成了 F2 移动端可视化方案文档中写了俩个简单的 圆形图的 demo具体需要使用查看F2 的官方文档
效果展示
代码示例
<template><div><canvas id="mountNode" height="260"></canvas><br/><br/><br/><canvas id="mountNode2" height="260"></canvas></div></template><script>import F2 from '@antv/f2'export default {created() {this.$nextTick(() => {this.setNavbar(); // 设置topbar// 画饼图this.playMountNode();// 画进度圆this.mountNode2();});},data () {return {list: [{name: '芳华',percent: 0.4,a: '1'}, {name: '妖猫传',percent: 0.2,a: '1'}, {name: '机器之血',percent: 0.18,a: '1'}, {name: '心理罪',percent: 0.15,a: '1'}, {name: '寻梦环游记',percent: 0.05,a: '1'}, {name: '其他',percent: 0.02,a: '1'}],}},methods: {setNavbar(){AI.setNavbar({title: 'F2饼图',})},// 画饼图playMountNode() {var map = {'芳华': '40%','妖猫传': '20%','机器之血': '18%','心理罪': '15%','寻梦环游记': '5%','其他': '2%'};var chart = new F2.Chart({id: 'mountNode',pixelRatio: window.devicePixelRatio});chart.source(this.list, {percent: {formatter: function formatter(val) {return val * 100 + '%';}}});chart.legend({position: 'right',itemFormatter: function itemFormatter(val) {return val + ' ' + map[val];}});chart.tooltip(false);chart.coord('polar', {transposed: true,radius: 0.85});chart.axis(false);chart.interval().position('a*percent').color('name', ['#1890FF', '#13C2C2', '#2FC25B', '#FACC14', '#F04864', '#8543E0']).adjust('stack').style({lineWidth: 1,stroke: '#fff',lineJoin: 'round',lineCap: 'round'}).animate({appear: {duration: 1200,easing: 'bounceOut'}});chart.render();},// 画进度圆mountNode2() {var fontSize = 24 * (window.innerWidth / 375); // 字体适配不同屏幕var data = [{x: '1',y: 85}];var chart = new F2.Chart({id: 'mountNode2',pixelRatio: window.devicePixelRatio});chart.source(data, {y: {max: 100,min: 0}});chart.axis(false);chart.tooltip(false);chart.coord('polar', {transposed: true,innerRadius: 0.8,radius: 0.85});chart.guide().arc({start: [0, 0],end: [1, 99.98],top: false,style: {lineWidth: 20,stroke: '#ccc'}});chart.guide().text({position: ['50%', '50%'],content: '85%',style: {fontSize: fontSize,fill: '#1890FF'}});chart.interval().position('x*y').size(20).animate({appear: {duration: 1200,easing: 'cubicIn'}});chart.render();}}}</script><style>#mountNode, #mountNode2{width: 100%;}</style>

若有收获,就点个赞吧
0 人点赞
