一、掌握跟踪调试参数
1.1 打印GC日志
public class TestGC {public static void main(String[] args) {List<String> a =new ArrayList<>();for (int i = 0; i < 500000; i++) {a.add("Java");}}}javac TestGC.javajava [options] TestGCoptions:-Xms5m 堆最小内存-Xmx5m 堆最大内存-XX:+PrintGC 打印GC日志-XX:+PrintGCDetails 打印GC日志详情
-XX:+PrintGC
#打印日志:堆使用了31744K(32m),GC后堆使用了520K, 堆可用121856K(120m)内存, GC执行的时间0.0033417秒[GC (Allocation Failure) 31744K->520K(121856K), 0.0033417 secs]
-XX:+PrintGCDetails ```java
日志
进行了5次GC ,最后一次是Full GC, 清空了PSYoungGen(年轻代), ParOldGen(老年代)从3m降低到2m, Metaspace(元空间)无变化
user=0.03(用户态CPU耗时,sys(系统CPU耗时),real(实际耗时))
[GC (Allocation Failure) [PSYoungGen: 1024K->496K(1536K)] 1024K->504K(5632K), 0.0010919 secs] [Times: user=0.00 sys=0.00, real=0.00 secs] [GC (Allocation Failure) [PSYoungGen: 1425K->505K(1536K)] 1433K->661K(5632K), 0.0016888 secs] [Times: user=0.01 sys=0.00, real=0.00 secs] [GC (Allocation Failure) [PSYoungGen: 1218K->352K(1536K)] 4344K->3478K(5632K), 0.0103012 secs] [Times: user=0.01 sys=0.00, real=0.01 secs] [GC (Allocation Failure) [PSYoungGen: 352K->416K(1536K)] 3478K->3542K(5632K), 0.0071386 secs] [Times: user=0.02 sys=0.00, real=0.00 secs] [Full GC (Allocation Failure) [PSYoungGen: 416K->0K(1536K)] [ParOldGen: 3126K->1854K(4096K)] 3542K->1854K(5632K), [Metaspace: 3000K->3000K(1056768K)], 0.0221790 secs] [Times: user=0.03 sys=0.00, real=0.03 secs]
[0x00000000ffe00000, 0x0000000100000000, 0x0000000100000000) 分别表示PSYoungGen(新生代)
分配空间的下界,当前上界和上界, 上界减去下界就可以得到所分配的空间大小
Heap PSYoungGen total 1536K, used 41K [0x00000000ffe00000, 0x0000000100000000, 0x0000000100000000) eden space 1024K, 4% used [0x00000000ffe00000,0x00000000ffe0a560,0x00000000fff00000) from space 512K, 0% used [0x00000000fff80000,0x00000000fff80000,0x0000000100000000) to space 512K, 0% used [0x00000000fff00000,0x00000000fff00000,0x00000000fff80000) ParOldGen total 4096K, used 3964K [0x00000000ffa00000, 0x00000000ffe00000, 0x00000000ffe00000) object space 4096K, 96% used [0x00000000ffa00000,0x00000000ffddf160,0x00000000ffe00000) Metaspace used 3006K, capacity 4496K, committed 4864K, reserved 1056768K class space used 321K, capacity 388K, committed 512K, reserved 1048576K
- -XX:+PrintHeapAtGC,它会在每次 GC 前后分别打印堆的信息```java{Heap before GC invocations=1 (full 0):PSYoungGen total 1536K, used 1024K [0x00000000ffe00000, 0x0000000100000000, 0x0000000100000000)eden space 1024K, 100% used [0x00000000ffe00000,0x00000000fff00000,0x00000000fff00000)from space 512K, 0% used [0x00000000fff80000,0x00000000fff80000,0x0000000100000000)to space 512K, 0% used [0x00000000fff00000,0x00000000fff00000,0x00000000fff80000)ParOldGen total 4096K, used 0K [0x00000000ffa00000, 0x00000000ffe00000, 0x00000000ffe00000)object space 4096K, 0% used [0x00000000ffa00000,0x00000000ffa00000,0x00000000ffe00000)Metaspace used 2583K, capacity 4494K, committed 4864K, reserved 1056768Kclass space used 277K, capacity 386K, committed 512K, reserved 1048576KHeap after GC invocations=1 (full 0):PSYoungGen total 1536K, used 464K [0x00000000ffe00000, 0x0000000100000000, 0x0000000100000000)eden space 1024K, 0% used [0x00000000ffe00000,0x00000000ffe00000,0x00000000fff00000)from space 512K, 90% used [0x00000000fff00000,0x00000000fff74010,0x00000000fff80000)to space 512K, 0% used [0x00000000fff80000,0x00000000fff80000,0x0000000100000000)ParOldGen total 4096K, used 0K [0x00000000ffa00000, 0x00000000ffe00000, 0x00000000ffe00000)object space 4096K, 0% used [0x00000000ffa00000,0x00000000ffa00000,0x00000000ffe00000)Metaspace used 2583K, capacity 4494K, committed 4864K, reserved 1056768Kclass space used 277K, capacity 386K, committed 512K, reserved 1048576K}//省略...
-XX:+PrintGCTimeStamps,该参数会在每GC 发生时, 额外输出 GC 发生的时间,该输 时间为虚拟机启动后的时间偏移量。
0.061: [GC (Allocation Failure) 1024K->464K(5632K), 0.0022659 secs]0.074: [GC (Allocation Failure) 1349K->629K(5632K), 0.0014800 secs]0.079: [GC (Allocation Failure) 4333K->3462K(5632K), 0.0122012 secs]0.092: [GC (Allocation Failure) 3462K->3462K(5632K), 0.0145559 secs]0.106: [Full GC (Allocation Failure) 3462K->1816K(5632K), 0.0299941 secs]
-XX:+PrintGCApplicationConcurrentTime: 打印应用程序执行时间
0.070: [GC (Allocation Failure) 1024K->464K(5632K), 0.0013033 secs]0.083: Application time: 0.0107491 seconds0.083: [GC (Allocation Failure) 1406K->669K(5632K), 0.0063083 secs]0.099: Application time: 0.0092224 seconds0.099: [GC (Allocation Failure) 4373K->3502K(5632K), 0.0090237 secs]0.108: [GC (Allocation Failure) 3502K->3470K(5632K), 0.0105479 secs]0.119: [Full GC (Allocation Failure) 3470K->1844K(5632K), 0.0271868 secs]0.147: Application time: 0.0013595 seconds
- -XX:+PrintGCApplicationStoppedTime: 可以打印应用程序由于GC而产生的停顿时间
0.068: [GC (Allocation Failure) 1024K->496K(5632K), 0.0010473 secs]0.070: Total time for which application threads were stopped: 0.0018480 seconds, Stopping threads took: 0.0007423 seconds0.079: Application time: 0.0043464 seconds0.079: [GC (Allocation Failure) 1425K->657K(5632K), 0.0042258 secs]0.083: Total time for which application threads were stopped: 0.0043926 seconds, Stopping threads took: 0.0000275 seconds0.088: Application time: 0.0054956 seconds0.089: [GC (Allocation Failure) 4361K->3474K(5632K), 0.0100223 secs]0.099: [GC (Allocation Failure) 3474K->3474K(5632K), 0.0087509 secs]0.107: [Full GC (Allocation Failure) 3474K->1844K(5632K), 0.0179186 secs]0.125: Total time for which application threads were stopped: 0.0368317 seconds, Stopping threads took: 0.0000252 seconds0.127: Application time: 0.0014421 seconds
- -XX:+PrintreferenceGC: 跟踪系 统内的软引用、弱引用 、虚引用和 Finallize队列
- -Xloggc:./log.gc : 输出到文件
1.2 类加载/卸载的跟踪
- -verbose:class 跟踪类的装载和卸载
- -XX:+TraceClassLoading 跟踪类的装载。
- -XX:+TraceClassUnloading 跟踪类的卸载。
- -XX:+PrintClassHistogram 打印、查看系统中的类分布情况, 在Java控制台Ctrl+Back组合键(没执行过)
1.3 系统参数查看
- -XX:+PrintVMOptions 打印配置的虚拟机参数
- -XX:+PrintFlagsFinal 打印系统详细参数
二、学习堆的配置参数
2.1 最大堆和初始堆的设置
- -Xms 最小堆大小设置
-
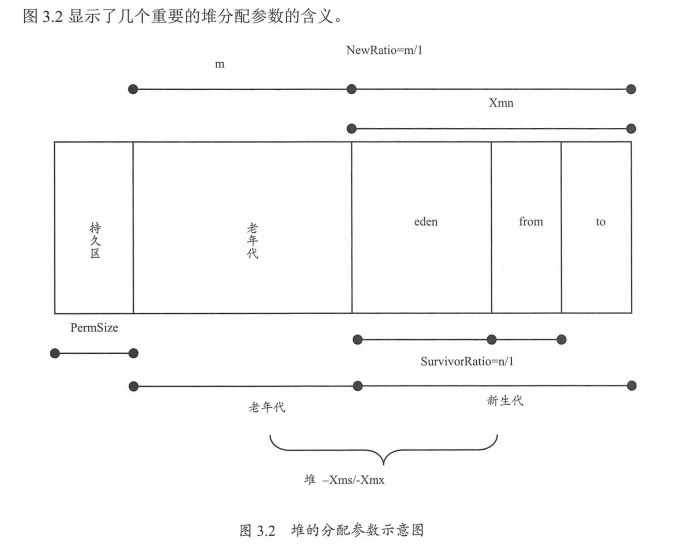
2.2 新生代的配置
-Xmn 设置新生代的大小,新生代的大小一般设置为整个堆空间的 1/3 或1/4左右。
- -XX:SurvivorRatio用来设置新生代eden空间和from/to 间的比例关系
-XX:SurvivorRatio=eden/from=eden/to - 测试堆分配的影响
//每次向内存申请1,public class NewSizeDemo {public static void main(String[] args) {byte[] b = null;for (int i = 0; i < 10; i++) {b = new byte[1 * 1024 * 1024];}}}
- 配置参数
-Xmx20m #最大堆-Xms20m #最小堆-Xmn2m #新生代, 64bit机器不能设置小于1.5 ,否则将采用默认值1.5-XX:SurvivorRatio=2 #eden空间和from/to 间的比例 2/1-XX:+PrintGCDetails #打印GC详细信息
[GC (Allocation Failure) [PSYoungGen: 1024K->496K(1536K)] 1024K->496K(19968K), 0.0012662 secs] [Times: user=0.00 sys=0.00, real=0.00 secs]HeapPSYoungGen total 1536K, used 884K [0x00000000ffe00000, 0x0000000100000000, 0x0000000100000000)eden space 1024K, 37% used [0x00000000ffe00000,0x00000000ffe61260,0x00000000fff00000)from space 512K, 96% used [0x00000000fff00000,0x00000000fff7c010,0x00000000fff80000)to space 512K, 0% used [0x00000000fff80000,0x00000000fff80000,0x0000000100000000)ParOldGen total 18432K, used 10240K [0x00000000fec00000, 0x00000000ffe00000, 0x00000000ffe00000)object space 18432K, 55% used [0x00000000fec00000,0x00000000ff6000a0,0x00000000ffe00000)Metaspace used 3002K, capacity 4496K, committed 4864K, reserved 1056768Kclass space used 321K, capacity 388K, committed 512K, reserved 1048576K
eden 与from 的大小比例为2/1, eden 的大小为1024k, 所以新生代可用的内存为1024K+512K=1536k, 新生代的总内存为1024K+512K+512K=2048K=2m
老年代最终占用10240k=10m
疑问:
- 新生代什么时候会触发GC?
- eden 有1m 空间,为什么还会触发GC呢? (网上查看的博客都写着不会,等学完GC再回看)
- 修改参数
-Xmx20m #最大堆-Xms20m #最小堆-Xmn7m #新生代-XX:SurvivorRatio=2 #eden空间和from/to 间的比例 2/1-XX:+PrintGCDetails #打印GC详细信息
[GC (Allocation Failure) [PSYoungGen: 3503K->1504K(5632K)] 3503K->1520K(18944K), 0.0026744 secs] [Times: user=0.01 sys=0.00, real=0.00 secs][GC (Allocation Failure) [PSYoungGen: 4653K->1504K(5632K)] 4669K->1520K(18944K), 0.0018696 secs] [Times: user=0.00 sys=0.00, real=0.00 secs][GC (Allocation Failure) [PSYoungGen: 4645K->1504K(5632K)] 4661K->1528K(18944K), 0.0029537 secs] [Times: user=0.00 sys=0.00, real=0.00 secs]HeapPSYoungGen total 5632K, used 3707K [0x00000000ff900000, 0x0000000100000000, 0x0000000100000000)eden space 4096K, 53% used [0x00000000ff900000,0x00000000ffb26e08,0x00000000ffd00000)from space 1536K, 97% used [0x00000000ffd00000,0x00000000ffe78030,0x00000000ffe80000)to space 1536K, 0% used [0x00000000ffe80000,0x00000000ffe80000,0x0000000100000000)ParOldGen total 13312K, used 24K [0x00000000fec00000, 0x00000000ff900000, 0x00000000ff900000)object space 13312K, 0% used [0x00000000fec00000,0x00000000fec06000,0x00000000ff900000)Metaspace used 3002K, capacity 4496K, committed 4864K, reserved 1056768Kclass space used 321K, capacity 388K, committed 512K, reserved 1048576K
eden 分配了7m 空间,因此所有的数组都首先分配在eden 区。但eden空间并不足以预留10m空间,故在程序运行期间,出现了3次新生代GC。 由于程序中每申请一次空间,也同时废弃了上一次申请的内存(上一次申请的内存失去引用),故在新生代GC中,有效回收了这些失效的内存。最终结果是:所有的内存分配都在新生代进行,通过GC保证了新生代有足够空间,而老年代没有为这些数组预留任何空间,只是在GC过程中,部分新生代对象晋升到老年代。
- 参数修改
-Xmx20m-Xms20m-Xmn15m-XX:+PrintGCDetails-XX:SurvivorRatio=8
HeapPSYoungGen total 13824K, used 12047K [0x00000000ff100000, 0x0000000100000000, 0x0000000100000000)eden space 12288K, 98% used [0x00000000ff100000,0x00000000ffcc3c40,0x00000000ffd00000)from space 1536K, 0% used [0x00000000ffe80000,0x00000000ffe80000,0x0000000100000000)to space 1536K, 0% used [0x00000000ffd00000,0x00000000ffd00000,0x00000000ffe80000)ParOldGen total 5120K, used 0K [0x00000000fec00000, 0x00000000ff100000, 0x00000000ff100000)object space 5120K, 0% used [0x00000000fec00000,0x00000000fec00000,0x00000000ff100000)Metaspace used 3002K, capacity 4496K, committed 4864K, reserved 1056768Kclass space used 321K, capacity 388K, committed 512K, reserved 1048576K
由于新生代分配了15m,其中eden 分配了12288K,满足分配10m的内存,因此所有分配行为都在eden中直接进行
,且没有发生GC。
由此可见堆的分配不同情况,会对系统执行产生一定影响。在实际工作中,的设置策略是:尽可能把对象预留在新生代,减少老年代GC的次数
- 参数设置: -XX:NewRatio=老年代/新生代 的比例
-Xmx20m-Xms20m-XX:+PrintGCDetails-XX:NewRatio=2 #老年代/新生代 的比例为2/1
[GC (Allocation Failure) [PSYoungGen: 5554K->512K(6144K)] 5554K->1552K(19968K), 0.0021799 secs] [Times: user=0.00 sys=0.00, real=0.00 secs][GC (Allocation Failure) [PSYoungGen: 5740K->512K(6144K)] 6780K->2576K(19968K), 0.0016115 secs] [Times: user=0.00 sys=0.00, real=0.00 secs]HeapPSYoungGen total 6144K, used 1649K [0x00000000ff980000, 0x0000000100000000, 0x0000000100000000)eden space 5632K, 20% used [0x00000000ff980000,0x00000000ffa9c410,0x00000000fff00000)from space 512K, 100% used [0x00000000fff80000,0x0000000100000000,0x0000000100000000)to space 512K, 0% used [0x00000000fff00000,0x00000000fff00000,0x00000000fff80000)ParOldGen total 13824K, used 2064K [0x00000000fec00000, 0x00000000ff980000, 0x00000000ff980000)object space 13824K, 14% used [0x00000000fec00000,0x00000000fee04020,0x00000000ff980000)Metaspace used 3003K, capacity 4496K, committed 4864K, reserved 1056768Kclass space used 321K, capacity 388K, committed 512K, reserved 1048576K
因为设置了老年代/新生代 的比例为2/1, 所以从log中可以看出,新生代分配了6144K = 6m 左右内存,老年代分配了13824K=13m左右的内存。由于新生代GC时,from/to空间不足以容纳任何一个1m数组,影响了新生代的正常回收,故在新生代回收时需要老年代进行空间担保。因此,导致1m数组进入老年代(在新生代GC时,尚有1m数组幸存,理应进入from/to, 而from/to只有512k,不足以容纳)
在最后一次GC中可以看出GC后还剩余2576K, 进入了from 512k, 还剩余2064K进入了老年代
2.3 OOM 处理
- 参数: -XX:+HeapDumpOnOutOfMemoryError ,在堆溢出时,导出整个堆信息
- -XX:+HeapDumpPath : 配置导出堆信息的文件路径
三、了解非堆的配置参数
3.1 方法区配置
- Java8以前版本设置
-XX:PermSize 方法区初始化大小-XX:MaxPermSize 方法区初始化大小
- Java8后
-XX:MetaspaceSize 元空间初始化大小-XX:MaxMetaspaceSize 元空间最大大小
3.2 栈配置
- -Xss 设置指定线程的栈大小
3.3 直接内存配置
- -XX:MaxDirectMemorySize 最大可用直接内存
注意:
- 当直接内存到达-XX:MaxDirectMemorySize时,就会触发GC, 如果垃圾回收不能释放足够内存,就会导致OOM
- :直接内存适合申请次数较少、访问较频繁的场合。如果内存空间本身需要频繁申请,则并不适合使用直接内存
3.4 Client Server 二选一:虚拟机的工作模式
- -client 客户端模式
- -server 服务端模式
参考
- 《实战Java虚拟机:JVM故障诊断与性能优化》
- https://docs.oracle.com/en/java/javase/13/docs/specs/man/java.html

若有收获,就点个赞吧
0 人点赞
