一、入门
1. 使用Maven搭建基准测试项目骨架
在命令行运行
mvn archetype:generate \-DinteractiveMode=false \-DarchetypeGroupId=org.openjdk.jmh \-DarchetypeArtifactId=jmh-java-benchmark-archetype \-DgroupId=cn.hdj \-DartifactId=demo-jmh \-Dversion=1.0
生成的项目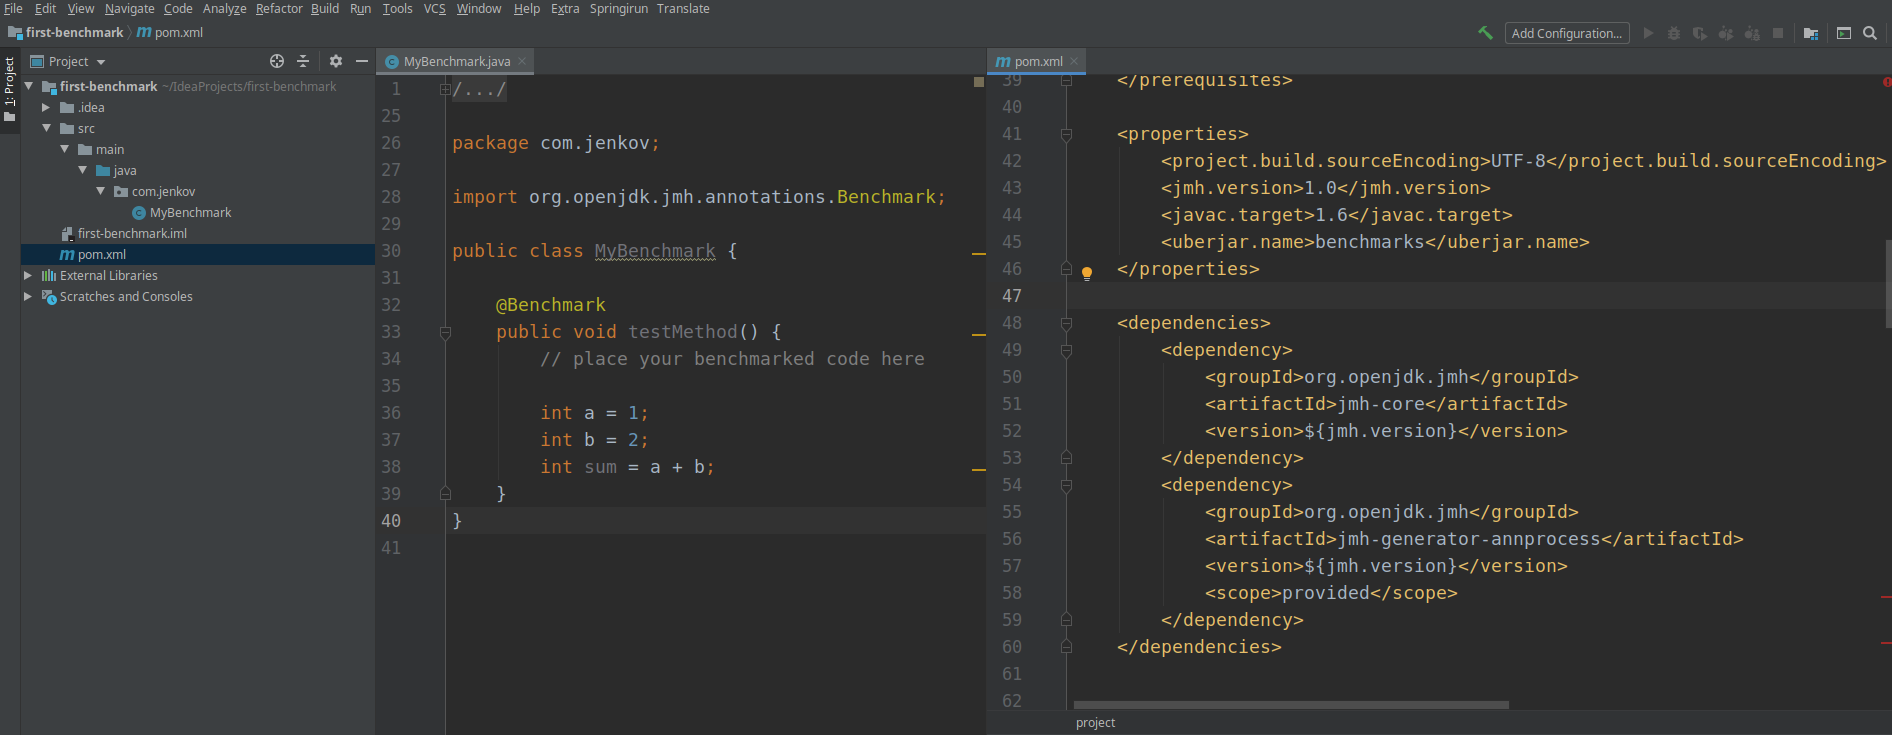
jmh 需要的依赖
<dependency><groupId>org.openjdk.jmh</groupId><artifactId>jmh-core</artifactId><version>1.0</version></dependency><dependency><groupId>org.openjdk.jmh</groupId><artifactId>jmh-generator-annprocess</artifactId><version>1.0</version><scope>provided</scope></dependency>
打包运行
mvn clean packagejava -jar target/benchmarks.jar
或者直接IDE启动
public static void main(String[] args) throws RunnerException {Options options = new OptionsBuilder().include(MyBenchmark.class.getSimpleName()).build();new Runner(options).run();}
2. 测试结果说明
/usr/lib/jvm/java-1.8.0-amazon-corretto/bin/java -Dvisualvm.id=1611482863790 -javaagent:/home/hdj/software/idea-IC-192.6817.14/lib/idea_rt.jar=41045:/home/hdj/software/idea-IC-192.6817.14/bin -Dfile.encoding=UTF-8 -classpath /usr/lib/jvm/java-1.8.0-amazon-corretto/jre/lib/charsets.jar:/usr/lib/jvm/java-1.8.0-amazon-corretto/jre/lib/ext/cldrdata.jar:/usr/lib/jvm/java-1.8.0-amazon-corretto/jre/lib/ext/dnsns.jar:/usr/lib/jvm/java-1.8.0-amazon-corretto/jre/lib/ext/jaccess.jar:/usr/lib/jvm/java-1.8.0-amazon-corretto/jre/lib/ext/jfxrt.jar:/usr/lib/jvm/java-1.8.0-amazon-corretto/jre/lib/ext/localedata.jar:/usr/lib/jvm/java-1.8.0-amazon-corretto/jre/lib/ext/nashorn.jar:/usr/lib/jvm/java-1.8.0-amazon-corretto/jre/lib/ext/sunec.jar:/usr/lib/jvm/java-1.8.0-amazon-corretto/jre/lib/ext/sunjce_provider.jar:/usr/lib/jvm/java-1.8.0-amazon-corretto/jre/lib/ext/sunpkcs11.jar:/usr/lib/jvm/java-1.8.0-amazon-corretto/jre/lib/ext/zipfs.jar:/usr/lib/jvm/java-1.8.0-amazon-corretto/jre/lib/jce.jar:/usr/lib/jvm/java-1.8.0-amazon-corretto/jre/lib/jfxswt.jar:/usr/lib/jvm/java-1.8.0-amazon-corretto/jre/lib/jsse.jar:/usr/lib/jvm/java-1.8.0-amazon-corretto/jre/lib/management-agent.jar:/usr/lib/jvm/java-1.8.0-amazon-corretto/jre/lib/resources.jar:/usr/lib/jvm/java-1.8.0-amazon-corretto/jre/lib/rt.jar:/home/hdj/IdeaProjects/demo-jmh/target/classes:/home/hdj/.m2/repository/org/openjdk/jmh/jmh-core/1.0/jmh-core-1.0.jar:/home/hdj/.m2/repository/net/sf/jopt-simple/jopt-simple/4.6/jopt-simple-4.6.jar:/home/hdj/.m2/repository/org/apache/commons/commons-math3/3.2/commons-math3-3.2.jar cn.hdj.MyBenchmark# VM invoker: /usr/lib/jvm/java-1.8.0-amazon-corretto/jre/bin/java# VM options: -Dvisualvm.id=1611482863790 -javaagent:/home/hdj/software/idea-IC-192.6817.14/lib/idea_rt.jar=41045:/home/hdj/software/idea-IC-192.6817.14/bin -Dfile.encoding=UTF-8# Warmup: 20 iterations, 1 s each# Measurement: 20 iterations, 1 s each# Threads: 1 thread, will synchronize iterations# Benchmark mode: Throughput, ops/time# Benchmark: cn.hdj.MyBenchmark.testMethod# Run progress: 0.00% complete, ETA 00:01:20# Fork: 1 of 2# Warmup Iteration 1: 3138283965.494 ops/s# Warmup Iteration 2: 3343881235.996 ops/s# Warmup Iteration 3: 3348834653.937 ops/s# Warmup Iteration 4: 3330039593.773 ops/s# Warmup Iteration 5: 3247983530.809 ops/s# Warmup Iteration 6: 3318130296.568 ops/s# Warmup Iteration 7: 3278282514.072 ops/s# Warmup Iteration 8: 3337975530.668 ops/s# Warmup Iteration 9: 3331120417.067 ops/s# Warmup Iteration 10: 3348364691.490 ops/s# Warmup Iteration 11: 3344805534.396 ops/s# Warmup Iteration 12: 3349783444.367 ops/s# Warmup Iteration 13: 3329624986.329 ops/s# Warmup Iteration 14: 3345768149.363 ops/s# Warmup Iteration 15: 3335593072.642 ops/s# Warmup Iteration 16: 3278417352.303 ops/s# Warmup Iteration 17: 3351830850.728 ops/s# Warmup Iteration 18: 3357026177.207 ops/s# Warmup Iteration 19: 3349489692.778 ops/s# Warmup Iteration 20: 3303576642.448 ops/sIteration 1: 3302628316.687 ops/sIteration 2: 3355204295.771 ops/sIteration 3: 3352822812.457 ops/sIteration 4: 3293838208.499 ops/sIteration 5: 3348386854.812 ops/sIteration 6: 3356557432.133 ops/sIteration 7: 3352918338.829 ops/sIteration 8: 3357925024.540 ops/sIteration 9: 3275335806.697 ops/sIteration 10: 3346282350.779 ops/sIteration 11: 3355910719.360 ops/sIteration 12: 3286355804.692 ops/sIteration 13: 3353997306.250 ops/sIteration 14: 3345386706.248 ops/sIteration 15: 3098585828.297 ops/sIteration 16: 3320139197.980 ops/sIteration 17: 3296801550.881 ops/sIteration 18: 3355494734.902 ops/sIteration 19: 3356800903.223 ops/sIteration 20: 3337077281.418 ops/s# Run progress: 50.00% complete, ETA 00:00:48# Fork: 2 of 2# Warmup Iteration 1: 3231242417.192 ops/s# Warmup Iteration 2: 3325570290.132 ops/s# Warmup Iteration 3: 3096949615.262 ops/s# Warmup Iteration 4: 3332459099.679 ops/s# Warmup Iteration 5: 3271409988.593 ops/s# Warmup Iteration 6: 3339628843.979 ops/s# Warmup Iteration 7: 3347272201.167 ops/s# Warmup Iteration 8: 3326039572.106 ops/s# Warmup Iteration 9: 3343615974.048 ops/s# Warmup Iteration 10: 3340006349.379 ops/s# Warmup Iteration 11: 3350308589.717 ops/s# Warmup Iteration 12: 3343823064.788 ops/s# Warmup Iteration 13: 3342492145.958 ops/s# Warmup Iteration 14: 3359616251.572 ops/s# Warmup Iteration 15: 3328707715.588 ops/s# Warmup Iteration 16: 3347526411.075 ops/s# Warmup Iteration 17: 3332288499.407 ops/s# Warmup Iteration 18: 3333285221.323 ops/s# Warmup Iteration 19: 3363231847.951 ops/s# Warmup Iteration 20: 3324800707.451 ops/sIteration 1: 3329347165.195 ops/sIteration 2: 3343019432.956 ops/sIteration 3: 3359178908.665 ops/sIteration 4: 3359706227.777 ops/sIteration 5: 3323662154.636 ops/sIteration 6: 3342720460.496 ops/sIteration 7: 3358126610.714 ops/sIteration 8: 3355181834.419 ops/sIteration 9: 3304847464.277 ops/sIteration 10: 3343412260.638 ops/sIteration 11: 3361426396.016 ops/sIteration 12: 3358865902.968 ops/sIteration 13: 3361451162.560 ops/sIteration 14: 3347432510.258 ops/sIteration 15: 3344210584.374 ops/sIteration 16: 3344063073.737 ops/sIteration 17: 3347884645.408 ops/sIteration 18: 3336115349.114 ops/sIteration 19: 3360040161.433 ops/sIteration 20: 3349369254.004 ops/sResult: 3334462775.852 ±(99.9%) 25009132.058 ops/s [Average]Statistics: (min, avg, max) = (3098585828.297, 3334462775.852, 3361451162.560), stdev = 44453710.274Confidence interval (99.9%): [3309453643.794, 3359471907.910]# Run complete. Total time: 00:01:37Benchmark Mode Samples Score Score error Unitsc.h.MyBenchmark.testMethod thrpt 40 3334462775.852 25009132.058 ops/sProcess finished with exit code 0
- Fork: 执行线程
- Warmup Iteration : 预热迭代执行
- Iteration :正常的迭代执行
- result : 最后是结果
- Benchmark : 执行的方法
- Mode: 基准测试模式
- Throughput(默认模式): 整体吞吐量,例如“1秒内可以执行多少次调用”。
- Average Time: 调用的平均时间,例如“每次调用平均耗时xxx毫秒”。
- Sample Time:随机取样,最后输出取样结果的分布,例如“99%的调用在xxx毫秒以内,99.99%的调用在xxx毫秒以内”
- Single Shot Time:以上模式都是默认一次 iteration 是 1s,唯有 SingleShotTime 是只运行一次。往往同时把 warmup 次数设为0,用于测试冷启动时的性能。
- All: 测量以上所有
- Samples: 表示采样次数
- Score(最后关心结果): 对这次评测的打分
- Score error: 这里表示性能统计上的误差
- Units: 单位 每秒操作
3. 常用注解说明
3.1 @BenchmarkMode
表示 JMH 进行 Benchmark 时所使用的模式。默认的模式是Throughput
@Inherited@Target({ElementType.METHOD, ElementType.TYPE})@Retention(RetentionPolicy.RUNTIME)public @interface BenchmarkMode {/*** @return Which benchmark modes to use.* @see Mode*/Mode[] value();}
3.2 @OutputTimeUnit
表示JMH 进行Benchmark时,输出结果的时间单位
@Inherited@Target({ElementType.METHOD,ElementType.TYPE})@Retention(RetentionPolicy.RUNTIME)public @interface OutputTimeUnit {/*** @return Time unit to use.*/TimeUnit value();}
支持以下单位
- NANOSECONDS 纳秒
- MICROSECONDS 微秒
- MILLISECONDS 毫秒
- SECONDS 秒
- MINUTES 分钟
- HOURS 小时
- DAYS 天
3.3 @State
用于标识状态对象,以便作为Benchmark的参数
@Inherited@Target(ElementType.TYPE)@Retention(RetentionPolicy.RUNTIME)public @interface State {/*** State scope.* @return state scope* @see Scope*/Scope value(); //状态的共享范围}
- Scope
- Benchmark: 该状态的意思是会在所有的Benchmark的工作线程中共享变量内容。
- Group : 同一个Group的线程可以享有同样的变量
- Thread: 每隔线程都享有一份变量的副本,线程之间对于变量的修改不会相互影响
State 类定义要求
@Setup 在基准测试之前运行的方法。 ```java @Target(ElementType.METHOD) @Retention(RetentionPolicy.RUNTIME) public @interface Setup {
/**
- @return Level of this method.
- @see Level */ Level value() default Level.Trial;
}
- @TearDown 在基准测试之后运行的方法。```java@Target(ElementType.METHOD)@Retention(RetentionPolicy.RUNTIME)public @interface TearDown {/*** @return At which level to run this fixture.* @see Level*/Level value() default Level.Trial;}
Level
@Fork: 需要运行的试验(迭代集合)数量。每个试验运行在单独的JVM进程中。也可以指定(额外的)JVM参数。
- @Measurement :提供真正的测试阶段参数。指定迭代的次数,每次迭代的运行时间和每次迭代测试调用的数量(通常使用@BenchmarkMode(Mode.SingleShotTime)测试一组操作的开销——而不使用循环)
- @Warmup: 与@Measurement相同,但是用于热身阶段
- @Threads 该测试使用的线程数。默认是Runtime.getRuntime().availableProcessors()
二、例子实践
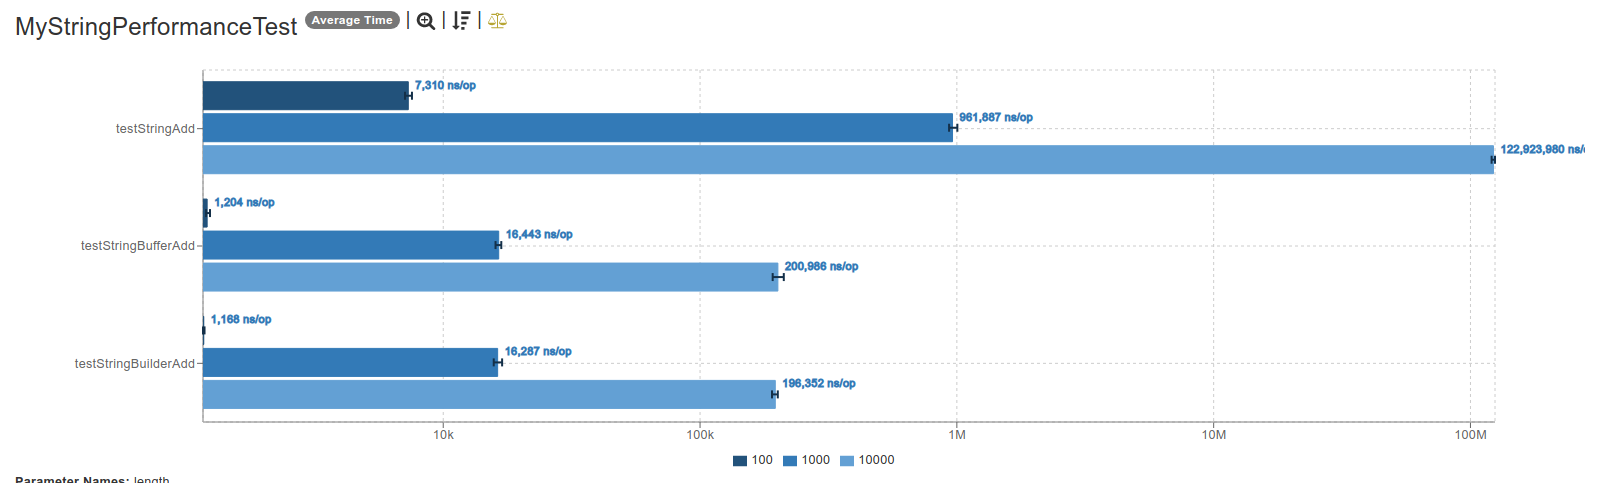
2.1 StringBuffer vs StringBuilder vs String +拼接
StringBuffer ,StringBuilder 是可变的字符串对象;StringBuffer是线程安全的,StringBuilder是线程不安全的。
代码 ```java @BenchmarkMode(Mode.AverageTime) //平均时间模式测试 @Warmup(iterations = 3, time = 1) //预热3次,每次1秒 @Measurement(iterations = 5, time = 5) //执行5次,每次5秒 @Threads(4) @Fork(1) @State(value = Scope.Benchmark) @OutputTimeUnit(TimeUnit.NANOSECONDS) public class MyStringPerformanceTest {
/**
- 测试从100 到 10000次的性能 */ @Param(value = {“100”, “1000”, “10000”}) private int length;
@Benchmarkpublic void testStringAdd(Blackhole blackhole) {String a = "";for (int i = 0; i < length; i++) {a += i;}blackhole.consume(a);}@Benchmarkpublic void testStringBuilderAdd(Blackhole blackhole) {StringBuilder sb = new StringBuilder();for (int i = 0; i < length; i++) {sb.append(i);}blackhole.consume(sb.toString());}@Benchmarkpublic void testStringBufferAdd(Blackhole blackhole) {StringBuffer sb = new StringBuffer();for (int i = 0; i < length; i++) {sb.append(i);}blackhole.consume(sb.toString());}public static void main(String[] args) throws RunnerException {Options options = new OptionsBuilder().include(MyStringPerformanceTest.class.getSimpleName()).resultFormat(ResultFormatType.JSON).result("jmh.json").build();new Runner(options).run();}
}
- 输出结果```shellResult: 196352.295 ±(99.9%) 16611.499 ns/op [Average]Statistics: (min, avg, max) = (190627.297, 196352.295, 200791.587), stdev = 4313.954Confidence interval (99.9%): [179740.796, 212963.794]# Run complete. Total time: 00:04:34Benchmark (length) Mode Samples Score Score error Unitsc.j.MyStringPerformanceTest.testStringAdd 100 avgt 5 7310.193 828.260 ns/opc.j.MyStringPerformanceTest.testStringAdd 1000 avgt 5 961887.214 102061.090 ns/opc.j.MyStringPerformanceTest.testStringAdd 10000 avgt 5 122923980.097 6239607.647 ns/opc.j.MyStringPerformanceTest.testStringBufferAdd 100 avgt 5 1204.133 67.151 ns/opc.j.MyStringPerformanceTest.testStringBufferAdd 1000 avgt 5 16443.466 1531.165 ns/opc.j.MyStringPerformanceTest.testStringBufferAdd 10000 avgt 5 200985.564 30430.347 ns/opc.j.MyStringPerformanceTest.testStringBuilderAdd 100 avgt 5 1167.801 22.221 ns/opc.j.MyStringPerformanceTest.testStringBuilderAdd 1000 avgt 5 16287.216 1725.331 ns/opc.j.MyStringPerformanceTest.testStringBuilderAdd 10000 avgt 5 196352.295 16611.499 ns/op
三、jmh 编写注意
已经入门了jmh 进行基准测试了, 剩下的只有提高我们的熟练度和书写规范。
3.1 循环优化问题(Loop Optimizations)
3.2 无用代码消除(Dead Code Elimination)
常量折叠是
- 如何避免
避免直接在Benchmark 方法中定义常量,应该使用State 对象
public class MyBenchmark {@State(Scope.Thread)public static class MyState {public int a = 1;public int b = 2;}@Benchmarkpublic int testMethod(MyState state) {int sum = state.a + state.b;return sum;}}
四、jmh IDEA插件使用
参考
- https://openjdk.java.net/projects/code-tools/jmh/
- http://tutorials.jenkov.com/java-performance/jmh.html#jmh-benchmark-modes
- JMH Visual Chart:http://deepoove.com/jmh-visual-chart/
- JMH Visualizer:https://jmh.morethan.io/
- https://www.baeldung.com/java-string-builder-string-buffer
- https://dunwu.github.io/javatech/test/jmh.html

若有收获,就点个赞吧
0 人点赞
