一、FileBeat基本概念
简单概述
最近在了解ELK做日志采集相关的内容,这篇文章主要讲解通过filebeat来实现日志的收集。日志采集的工具有很多种,如fluentd, flume, logstash,betas等等。首先要知道为什么要使用filebeat呢?因为logstash是jvm跑的,资源消耗比较大,启动一个logstash就需要消耗500M左右的内存,而filebeat只需要10来M内存资源。常用的ELK日志采集方案中,大部分的做法就是将所有节点的日志内容通过filebeat送到kafka消息队列,然后使用logstash集群读取消息队列内容,根据配置文件进行过滤。然后将过滤之后的文件输送到elasticsearch中,通过kibana去展示。
filebeat介绍
Filebeat由两个主要组成部分组成:prospector和 harvesters。这些组件一起工作来读取文件并将事件数据发送到您指定的output。
什么是harvesters?
harvesters负责读取单个文件的内容。harvesters逐行读取每个文件,并将内容发送到output中。每个文件都将启动一个harvesters。harvesters负责文件的打开和关闭,这意味着harvesters运行时,文件会保持打开状态。如果在收集过程中,即使删除了这个文件或者是对文件进行重命名,Filebeat依然会继续对这个文件进行读取,这时候将会一直占用着文件所对应的磁盘空间,直到Harvester关闭。默认情况下,Filebeat会一直保持文件的开启状态,直到超过配置的closeinactive参数,Filebeat才会把Harvester关闭。
关闭Harvesters会带来的影响:
file Handler将会被关闭,如果在Harvester关闭之前,读取的文件已经被删除或者重命名,这时候会释放之前被占用的磁盘资源。
当时间到达配置的scan_frequency参数,将会重新启动为文件内容的收集。
如果在Havester关闭以后,移动或者删除了文件,Havester再次启动时,将会无法收集文件数据。
当需要关闭Harvester的时候,可以通过close配置项来控制。
什么是Prospector?
Prospector负责管理Harvsters,并且找到所有需要进行读取的数据源。如果input type配置的是log类型,Prospector将会去配置度路径下查找所有能匹配上的文件,然后为每一个文件创建一个Harvster。每个Prospector都运行在自己的Go routine里。
Filebeat目前支持两种Prospector类型:log和stdin。每个Prospector类型可以在配置文件定义多个。log Prospector将会检查每一个文件是否需要启动Harvster,启动的Harvster是否还在运行,或者是该文件是否被忽略(可以通过配置 ignore_order,进行文件忽略)。如果是在Filebeat运行过程中新创建的文件,只要在Harvster关闭后,文件大小发生了变化,新文件才会被Prospector选择到。
*filebeat工作原理
Filebeat可以保持每个文件的状态,并且频繁地把文件状态从注册表里更新到磁盘。这里所说的文件状态是用来记录上一次Harvster读取文件时读取到的位置,以保证能把全部的日志数据都读取出来,然后发送给output。如果在某一时刻,作为output的ElasticSearch或者Logstash变成了不可用,Filebeat将会把最后的文件读取位置保存下来,直到output重新可用的时候,快速地恢复文件数据的读取。在Filebaet运行过程中,每个Prospector的状态信息都会保存在内存里。如果Filebeat出行了重启,完成重启之后,会从注册表文件里恢复重启之前的状态信息,让FIlebeat继续从之前已知的位置开始进行数据读取。
Prospector会为每一个找到的文件保持状态信息。因为文件可以进行重命名或者是更改路径,所以文件名和路径不足以用来识别文件。对于Filebeat来说,都是通过实现存储的唯一标识符来判断文件是否之前已经被采集过。
如果在你的使用场景中,每天会产生大量的新文件,你将会发现Filebeat的注册表文件会变得非常大。这个时候,你可以参考(the section called “Registry file is too large?edit),来解决这个问题。
二、下载FileBeat安装包
wget https://artifacts.elastic.co/downloads/beats/filebeat/filebeat-6.3.1-linux-x86_64.tar.gz
三、FileBeat发送日志到ES
1、解压文件
tar -zxvf filebeat-6.3.1-linux-x86_64.tar.gz
2、编辑filebeat.yml
vim filebeat.yml
按照要求修改输入和输出部分为(红色):
filebeat.inputs:# Each - is an input. Most options can be set at the input level, so# you can use different inputs for various configurations.# Below are the input specific configurations.- type: log# Change to true to enable this input configuration.enabled: true# Paths that should be crawled and fetched. Glob based paths.paths:/home/log/*.log#- c:\programdata\elasticsearch\logs\*。。。#============================= Filebeat modules ===============================filebeat.config.modules:# Glob pattern for configuration loadingpath: ${path.config}/modules.d/*.yml# Set to true to enable config reloadingreload.enabled: true。。。#============================= Filebeat modules ===============================filebeat.config.modules:# Glob pattern for configuration loadingpath: ${path.config}/modules.d/*.yml# Set to true to enable config reloadingreload.enabled: trueoutput.elasticsearch:# Array of hosts to connect to.hosts: ["localhost:9200"]
3、启动
./filebeat -e -c filebeat.yml -d "Publish"
4、验证
上传日志到文件到指定目录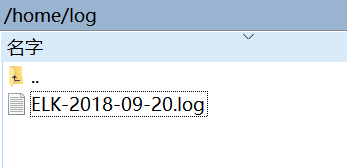
日志内容:
{"@timestamp":"2018-09-20T01:21:02.363+08:00","@version":1,"message":"测试日志修改索引看看","logger_name":"com.example.demo.DemoApplicationTests","thread_name":"main","level":"INFO","level_value":20000,"appName":"test-name","appname":"test-name"}{"@timestamp":"2018-09-20T01:21:02.364+08:00","@version":1,"message":"查询所有学生,pageNo1,pageSize1","logger_name":"com.example.service.StudentService","thread_name":"main","level":"INFO","level_value":20000,"appName":"test-name","appname":"test-name"}{"@timestamp":"2018-09-20T01:21:02.622+08:00","@version":1,"message":"Student(id=1, name=小明, classname=112, age=21, telphone=2147483647, nickName=null)","logger_name":"com.example.demo.DemoApplicationTests","thread_name":"main","level":"INFO","level_value":20000,"appName":"test-name","appname":"test-name"}
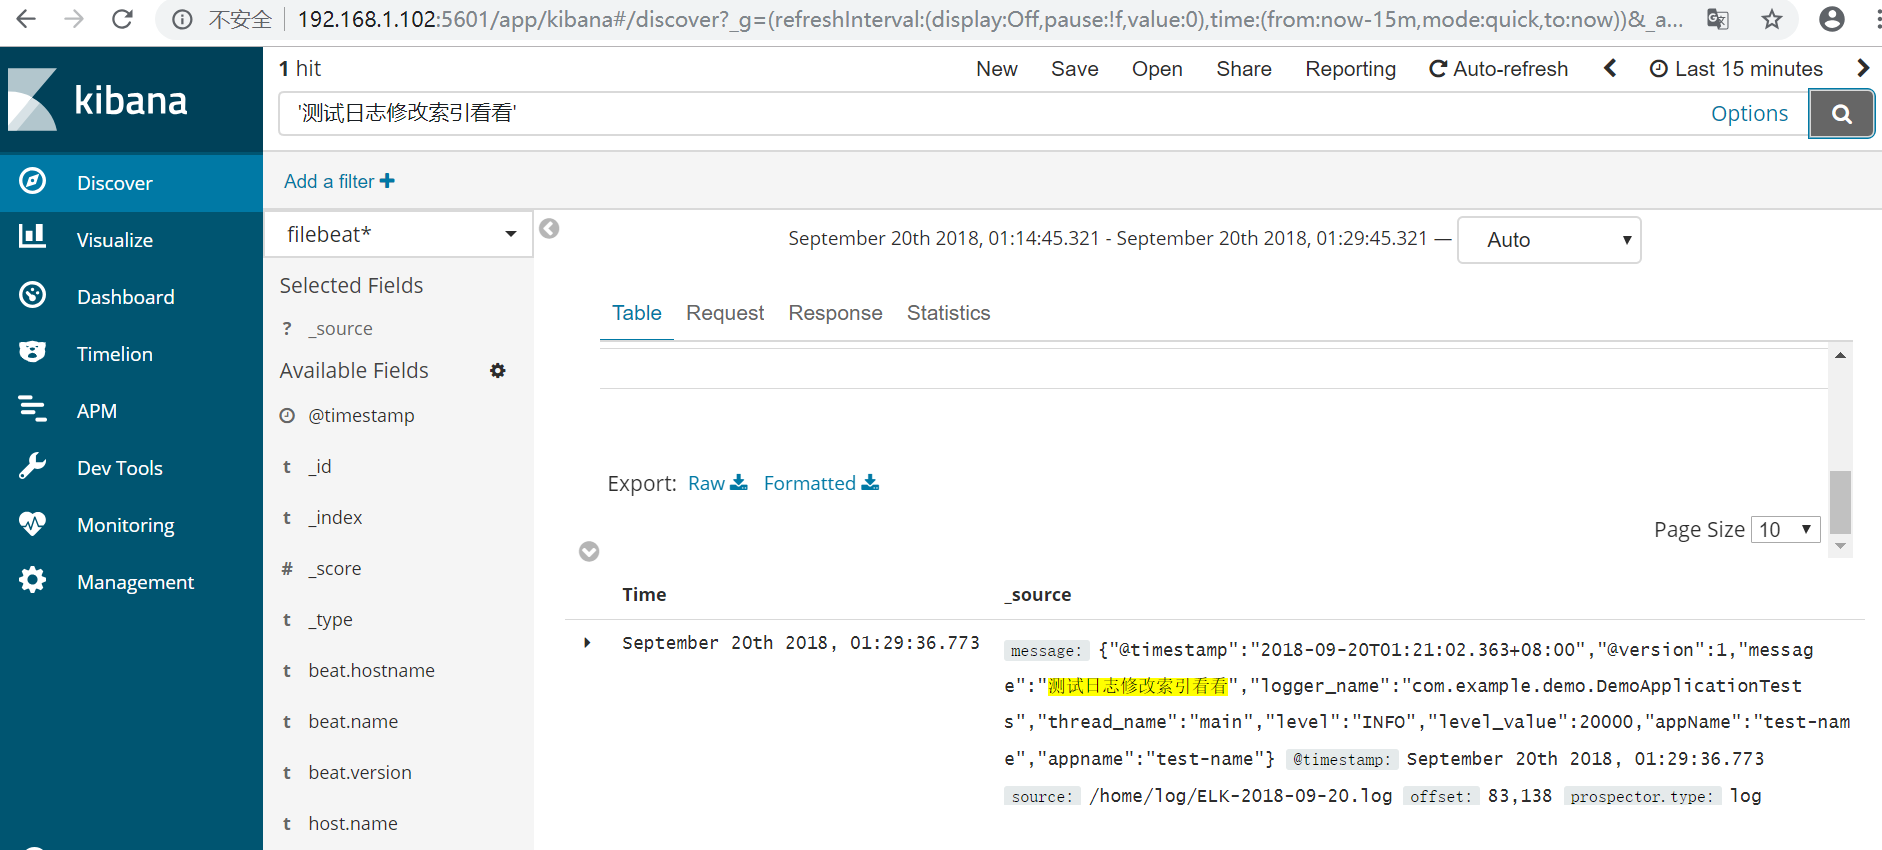
5、kibana查看
四、FileBeat发送日志到Logstash,由logstash发送到ES
1、fileBeat配置
vim /home/filebeat-6.3.1-linux-x86_64/filebeat.yml
(只改红色部分其他跟上面配置一致):
#output.elasticsearch: 关闭ES配置# Array of hosts to connect to.#hosts: ["localhost:9200"]output.logstash:# The Logstash hostshosts: ["localhost:5044"]
2、配置Logstash
vim /home/logstash-6.3.1/config/conf.d/logstash-es.conf
添加配置:
input {beats {port => 5044ssl => falsecodec => json #格式化成json,否则下面%{appname}取不到值}}output {elasticsearch {#action => "index"hosts => ["localhost:9200"]index => "%{appname}-%{+YYYY.MM.dd}" #根据项目名称动态创建索引template => "/home/elasticsearch-6.3.1/config/templates/logstash.json" 索引模板地址manage_template => false #关闭logstash默认索引模板template_name => "crawl" #映射模板的名字template_overwrite => true #如果设置为true,模板名字一样的时候,新的模板会覆盖旧的模板 }}
3、启动logstash和filebeat
/home/logstash-6.3.1/bin/logstash --path.settings /home/logstash-6.3.1/config/ -f /home/logstash-6.3.1/config/conf.d/logstash-es.conf &/home/filebeat-6.3.1-linux-x86_64/filebeat -e -c filebeat.yml -d "Publish" &
4、验证
拷贝日志文件ELK-2018-09-20.log到/home/log文件下
内容如下:
{"@timestamp":"2018-09-20T01:56:55.293+08:00","@version":1,"message":"今天是中秋节放假111,pageNo1,pageSize1","logger_name":"com.example.service.StudentService","thread_name":"main","level":"INFO","level_value":20000,"appName":"test-name","appname":"test-name", "host": "192.168.1.100"}
5、打开kibana

五、logstash多个output配置
1、修改配置文件、
input {tcp {port => 10514codec => "json"}}input {beats {port => 5044ssl => falsecodec => json}}output {elasticsearch {#action => "index"hosts => ["localhost:9200"]index => "%{appname}-%{+YYYY.MM.dd}"template => "/home/elasticsearch-6.3.1/config/templates/logstash.json"manage_template => false #关闭logstash自动管理模板功能template_name => "crawl" #映射模板的名字template_overwrite => true}if [level] == "ERROR" {elasticsearch {#action => "index"hosts => ["localhost:9200"]index => "%{appname}-error-%{+YYYY.MM.dd}"template => "/home/elasticsearch-6.3.1/config/templates/logstash.json"manage_template => false #关闭logstash自动管理模板功能template_name => "crawl" #映射模板的名字template_overwrite => true}}}output {stdout {codec => rubydebug}}
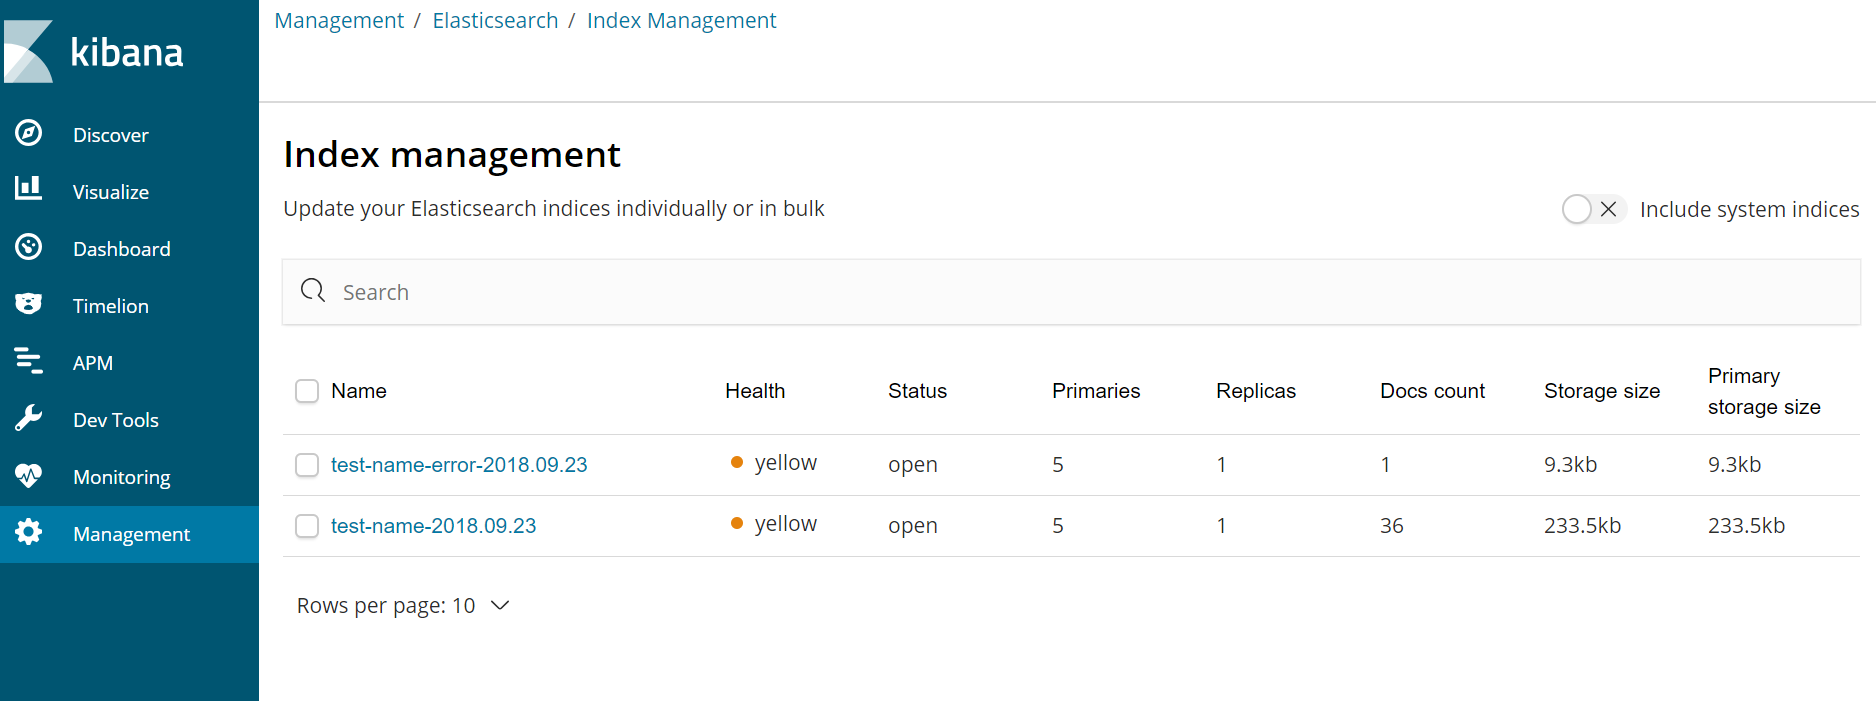
2、打开kibana另外一个索引中只有errorr日志
六、logback生成ELK日志中文乱码问题
自定义json过滤器
<!-- 输出到ELK文件 --><appender name="elkLog"class="ch.qos.logback.core.rolling.RollingFileAppender"><file>${LOGPATH}${file.separator}ELK-${TIMESTAMP}.log</file><append>true</append><encoder charset="UTF-8" class="net.logstash.logback.encoder.LogstashEncoder" ><jsonFactoryDecorator class="com.example.logback.MyJsonFactoryDecorator" /><customFields>{"appname":"${appName}"}</customFields></encoder><rollingPolicy class="ch.qos.logback.core.rolling.TimeBasedRollingPolicy"><fileNamePattern>${LOGPATH}${file.separator}all${file.separator}%d{yyyy-MM-dd}.log</fileNamePattern><maxHistory>30</maxHistory></rollingPolicy><triggeringPolicy class="ch.qos.logback.core.rolling.SizeBasedTriggeringPolicy"><MaxFileSize>10MB</MaxFileSize></triggeringPolicy></appender>
java类
package com.example.logback;import com.fasterxml.jackson.core.JsonGenerator;import com.fasterxml.jackson.databind.MappingJsonFactory;import net.logstash.logback.decorate.JsonFactoryDecorator;public class MyJsonFactoryDecorator implements JsonFactoryDecorator {@Overridepublic MappingJsonFactory decorate(MappingJsonFactory factory) {// 禁用对非ascii码进行escape编码的特性factory.disable(JsonGenerator.Feature.ESCAPE_NON_ASCII);return factory;}}
七、logstash+elasticsearch配置索引模板
在使用logstash收集日志的时候,我们一般会使用logstash自带的动态索引模板,虽然无须我们做任何定制操作,就能把我们的日志数据推送到elasticsearch索引集群中,但是在我们查询的时候,就会发现,默认的索引模板常常把我们不需要分词的字段,给分词了,这样以来,我们的比较重要的聚合统计就不准确了:
如果使用的是logstash的默认模板,它会按-切分机器名,这样以来想统计那台机器上的收集日志最多就有问题了,所以这时候,就需要我们自定义一些索引模板了:
在logstash与elasticsearch集成的时候,总共有如下几种使用模板的方式:
(1)使用默认自带的索引模板 ,大部分的字段都会分词,适合开发和时候快速验证使用
(2)在logstash收集端自定义配置模板,因为分散在收集机器上,维护比较麻烦
(3)在elasticsearc服务端自定义配置模板,由elasticsearch负责加载模板,可动态更改,全局生效,维护比较容易
以上几种方式:
使用第一种,最简单,无须任何配置
使用第二种,适合小规模集群的日志收集,需要在logstash的output插件中使用template指定本机器上的一个模板json路径, 例如 template => “/tmp/logstash.json”
使用第三种,适合大规模集群的日志收集,如何配置,主要配置logstash的output插件中两个参数:
manage_template => false//关闭logstash自动管理模板功能
template_name => “crawl”//映射模板的名字
如果使用了,第三种需要在elasticsearch的集群中的config/templates路径下配置模板json,在elasticsearch中索引模板可分为两种:
1、静态模板
适合索引字段数据固定的场景,一旦配置完成,不能向里面加入多余的字段,否则会报错
优点:scheam已知,业务场景明确,不容易出现因字段随便映射从而造成元数据撑爆es内存,从而导致es集群全部宕机
缺点:字段数多的情况下配置稍繁琐
一个静态索引模板配置例子如下:
{"crawl" : {"template": "crawl-*","settings": {"index.number_of_shards": 3,"number_of_replicas": 0},"mappings" : {"logs" : {"properties" : {"@timestamp" : {"type" : "date","format" : "dateOptionalTime","doc_values" : true},"@version" : {"type" : "string","index" : "not_analyzed","doc_values" : true},"cid" : {"type" : "string","index" : "not_analyzed"},"crow" : {"type" : "string","index" : "not_analyzed"},"erow" : {"type" : "string","index" : "not_analyzed"},"host" : {"type" : "string","index" : "not_analyzed"},"httpcode" : {"type" : "string","index" : "not_analyzed"},"message" : {"type" : "string"},"path" : {"type" : "string"},"pcode" : {"type" : "string","index" : "not_analyzed"},"pro" : {"type" : "string","index" : "not_analyzed"},"ptype" : {"type" : "string","index" : "not_analyzed"},"save" : {"type" : "string","index" : "not_analyzed"},"t1" : {"type" : "string","index" : "not_analyzed"},"t2" : {"type" : "string","index" : "not_analyzed"},"t3" : {"type" : "string","index" : "not_analyzed"},"url" : {"type" : "string"}}}}}}
2、动态模板
适合字段数不明确,大量字段的配置类型相同的场景,多加字段不会报错
优点:可动态添加任意字段,无须改动scheaml,
缺点:如果添加的字段非常多,有可能造成es集群宕机
如下的一个logstash的动态索引模板,只设置message字段分词,其他的字段默认不分词
{"template" : "crawl-*","settings" : {"index.number_of_shards": 5,"number_of_replicas": 0},"mappings" : {"_default_" : {"_all" : {"enabled" : true, "omit_norms" : true},"dynamic_templates" : [ {"message_field" : {"match" : "message","match_mapping_type" : "string","mapping" : {"type" : "string", "index" : "analyzed", "omit_norms" : true,"fielddata" : { "format" : "disabled" }}}}, {"string_fields" : {"match" : "*","match_mapping_type" : "string","mapping" : {"type" : "string", "index" : "not_analyzed", "doc_values" : true}}} ],"properties" : {"@timestamp": { "type": "date" },"@version": { "type": "string", "index": "not_analyzed" },"geoip" : {"dynamic": true,"properties" : {"ip": { "type": "ip" },"location" : { "type" : "geo_point" },"latitude" : { "type" : "float" },"longitude" : { "type" : "float" }}}}}}}

若有收获,就点个赞吧
0 人点赞
