官网
基本介绍
一个基于js的能够用纯Python快速构建的web可视化应用框架。
三个主要部分
- 网页布局 2. callback 3. 可视化图
应用案例
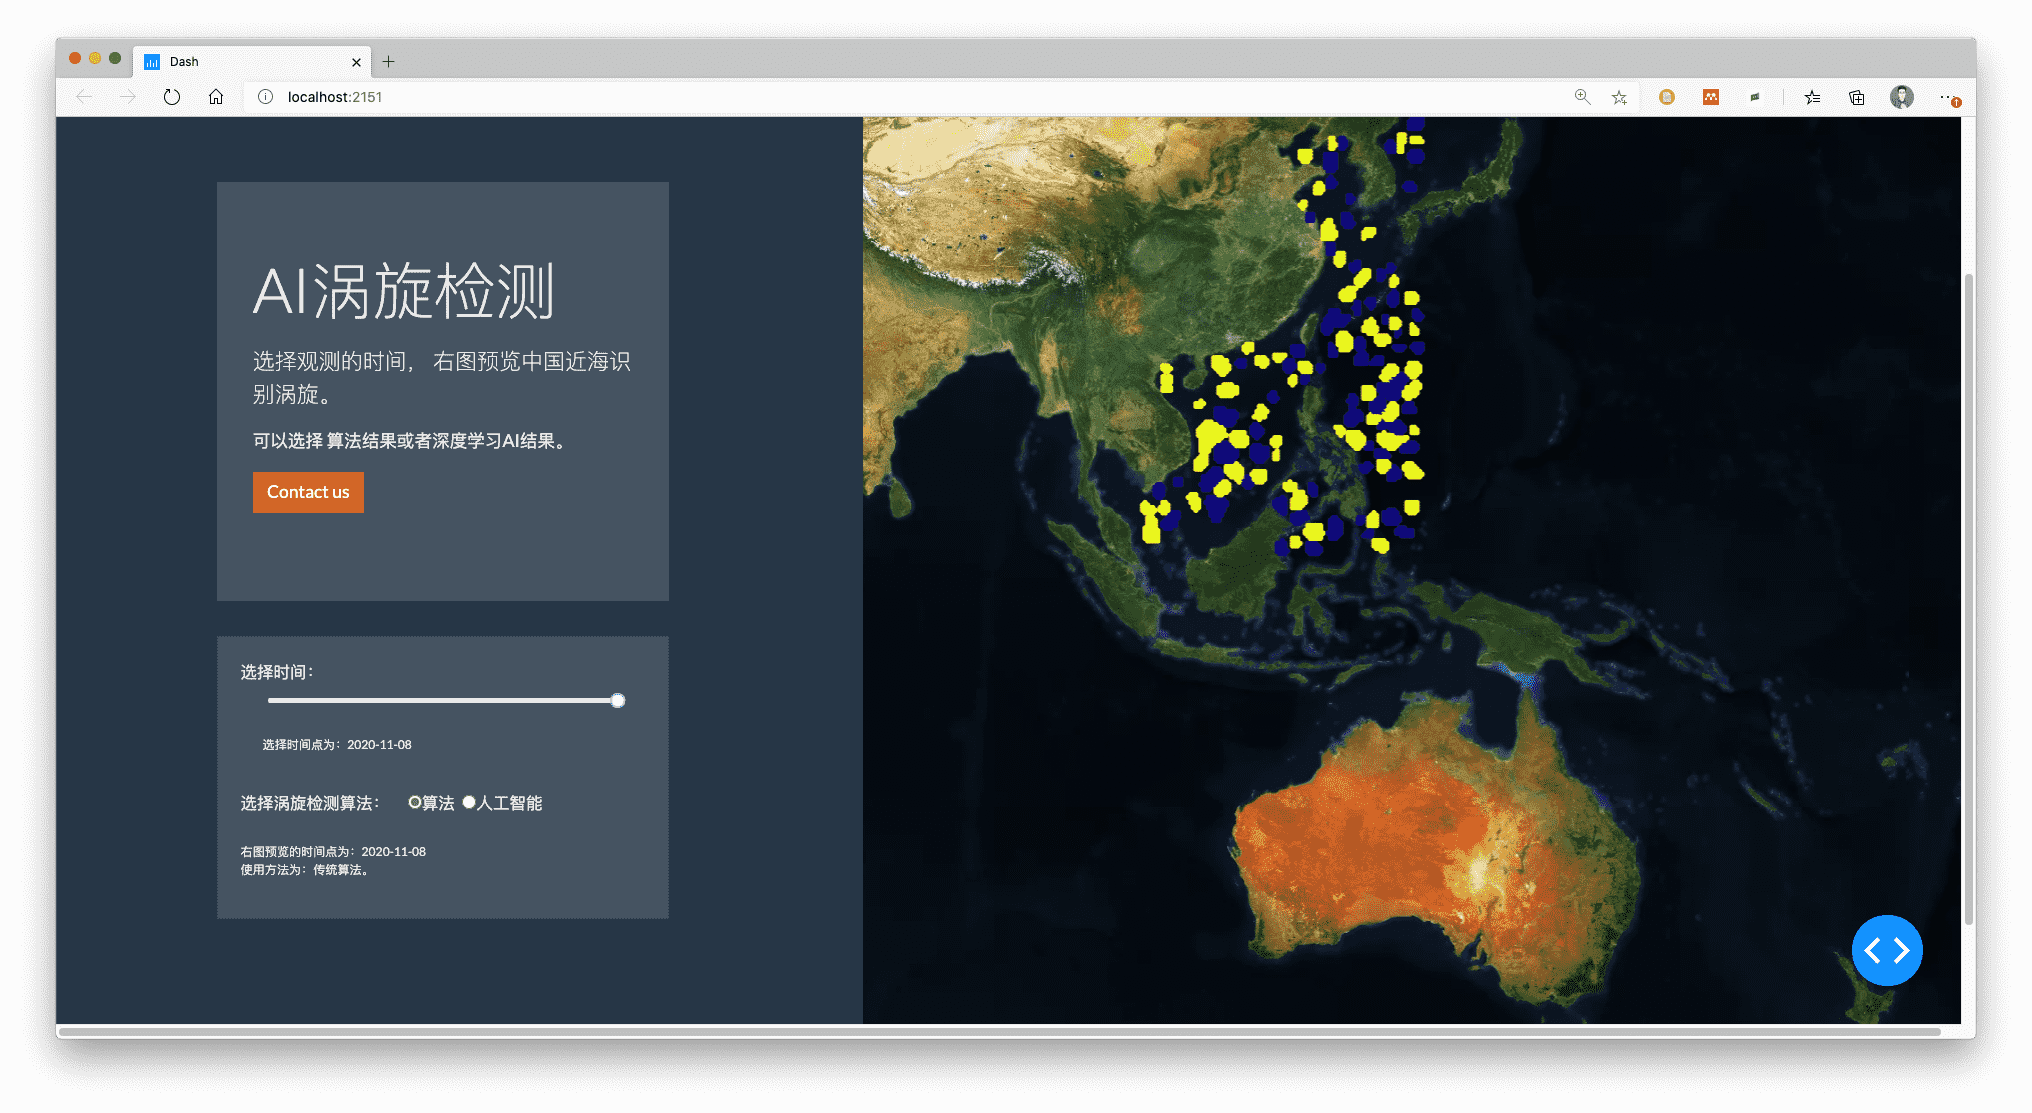
时间关系,不一一展开讲,主要是将我做的案例记录下来,方便以后查询。场景需求:将中国近海的涡旋检测案例发布为web应用,主要涉及到mapbox地图的叠加,以及plotly的简单应用,和dash基本布局。
基本代码结构
#主要依赖import plotly.express as px # (version 4.7.0)import plotly.graph_objects as goimport dash # (version 1.12.0) pip install dashimport dash_core_components as dccimport dash_html_components as htmlimport dash_bootstrap_components as dbcfrom dash.dependencies import Input, Output,Stateimport pandas as pdimport numpy as npimport xarray as xrfrom datetime import datefrom Predict import predict_appapp = dash.Dash(__name__) # 设定基本主题,可以去bootstrapwatch下载#导入基本数据# 最上方横条PLOTLY_LOGO = "http://msdc.qdio.ac.cn/static/img/homepage/nav-logo.png"navbar = dbc.Navbar([html.A(# Use row and col to control vertical alignment of logo / branddbc.Row([dbc.Col(html.Img(src=PLOTLY_LOGO, height="30px",),width=18),],align="center",no_gutters=True,),href="http://msdc.qdio.ac.cn",),],color="dark",dark=True,)# 文字说明部分jumbotron = dbc.Jumbotron([html.H6("AI涡旋检测", className="display-4"),html.Hr(className="my-2"),html.P("选择观测的时间, ""右图预览中国近海识别涡旋。",className="lead",),html.P("可以选择 ""算法结果或者深度学习AI结果。"),html.P(dbc.Button("Contact us", color="primary",href="http://msdc.qdio.ac.cn",), className="lead"),])# 基本布局控件controls = dbc.Card([dbc.FormGroup([dbc.Label("选择时间:",style={'font-size': 15}),dcc.Slider(id = "time_slider",min=0,max=list(t.keys())[-2],# t的最后一天value=list(t.keys())[-2],included=False,),html.Div(id='slider-output-container',style={'margin-left': 20,'font-size':11}),html.Hr(className="my-2"),]),dbc.FormGroup([dbc.Label("选择涡旋检测算法:",style={'font-size': 15}),dcc.RadioItems(id= 'select_type',options=[{'label': '算法', 'value': 'ss'},{'label': '人工智能', 'value': 'ai'},],value='ss',labelStyle={# 'display': 'inline-block','margin-right': '7px','font-size': 15},style={'display': 'inline-block','margin-left': '17px','font-size': 15}),html.Hr(className="my-2"),html.Div(id='summary-container1',style={'font-size': 11}),html.Div(id='summary-container2',style={'font-size': 11}),]),],body=True,)# 汇总到app.layoutapp.layout = html.Div([navbar,#dbc.Row([dbc.Col([jumbotron,html.Div(""),html.P(''),controls,],width={'size': 3,"offset": 1,"order":1},align='center'),dbc.Col([dcc.Graph(id='contourf', figure={},)],lg={'size': 7, "offset": 1, 'order': 2,},align="center"),]),])# 将图与控件联系起来# 更新时间选择@app.callback(Output('slider-output-container', 'children'),[Input("time_slider", 'value')])def update_output(value):return "选择时间点为:{}".format(t[value]['label'])# 更新综述@app.callback([Output('summary-container1', 'children'),Output('summary-container2', 'children')],[Input("time_slider", 'value'),Input(component_id='select_type', component_property='value')])def update_summary(value,type):if type == 'ai':method = '人工智能'else:method = "传统算法"return "右图预览的时间点为:{} ".format(t[value]['label']),"使用方法为:{}。".format(method)# 更新画图@app.callback(Output(component_id='contourf', component_property='figure'),[Input(component_id='select_type', component_property='value'),Input("time_slider", 'value')])def update_contour(option_slctd,value):print(option_slctd)print(value)if option_slctd == 'ai':#AI预测以及结果pre_input = model_input[value,:,:]predict_value = predict_app(pre_input) # 168*168res_ai = zhuanhuan(lat,lon,predict_value)fig = px.scatter_mapbox(data_frame=res_ai,lon='lon',lat='lat',color='point',opacity=0.95,zoom=2.7,center={'lat':2.625,'lon':131.125})else:# 算法结果s_value = ground_truth[value,:,:]res_suanfa = zhuanhuan(lat,lon,s_value)fig = px.scatter_mapbox(data_frame=res_suanfa,lon='lon',lat='lat',color='point',opacity=0.95,zoom=2.7,center={'lat':2.625,'lon':131.125})fig.update_layout(margin={"r":0,"t":0,"l":0,"b":0},hoverlabel=dict(font_size=12, # label font sizefont_family="Inter"), # label fontmapbox_style="satellite",#width =11000,coloraxis_showscale=False,height = 1100)return figif __name__ == '__main__':app.run_server(debug=True,host = '0.0.0.0',port='2151')
呈现效果
Dash主题文件cs下载网址
https://bootswatch.com/ ,下载完之后只要放到项目文件夹下的assets文件夹下即可。
注意事项
- 如果我们通过不同的 url去渲染不同的页面的话,会碰到一个问题,就是我们可能会率先定义了回调,而回掉中的组件暂时还没渲染到app.layout中,因此Dash会引发异常以警告我们可能做错了。在这种情况下,我们可以通过设置忽略该异常。即:
app.config.suppress_callback_exceptions = True Dash Callback 默认在用户改变输入时就会刷新callback,如果出现一种情景需要用户全部改变输入状态后再刷新,那么需要将输入转为State,这样就不会立即触发刷新。
帮助网址
- 官方文档 https://dash.plotly.com/
- 官方社区 https://community.plotly.com/
- Youtube 非常详细的博主教程:https://www.youtube.com/channel/UCqBFsuAz41sqWcFjZkqmJqQ
- dash bootstrap components帮助你创建更佳个性化漂亮的dash应用。http://dash-bootstrap-components.opensource.faculty.ai/
- 官方文档 https://dash.plotly.com/

若有收获,就点个赞吧
0 人点赞
