在我发现景点名称后缀可以作为分类依据后,我返回excel表,在excel上做数据清洗
因为数据量不多,可以用肉眼扫描几次,心中大致分类。
对景点名称开启筛选功能—>搜索公园—>将结果再用筛选功能,筛选区域,将公园分区
以下步骤与上述步骤大致相同,最后将景点分为:城市吃喝娱乐、特色村镇、公园动物园生态园区、山寺农庄、文体艺术…等
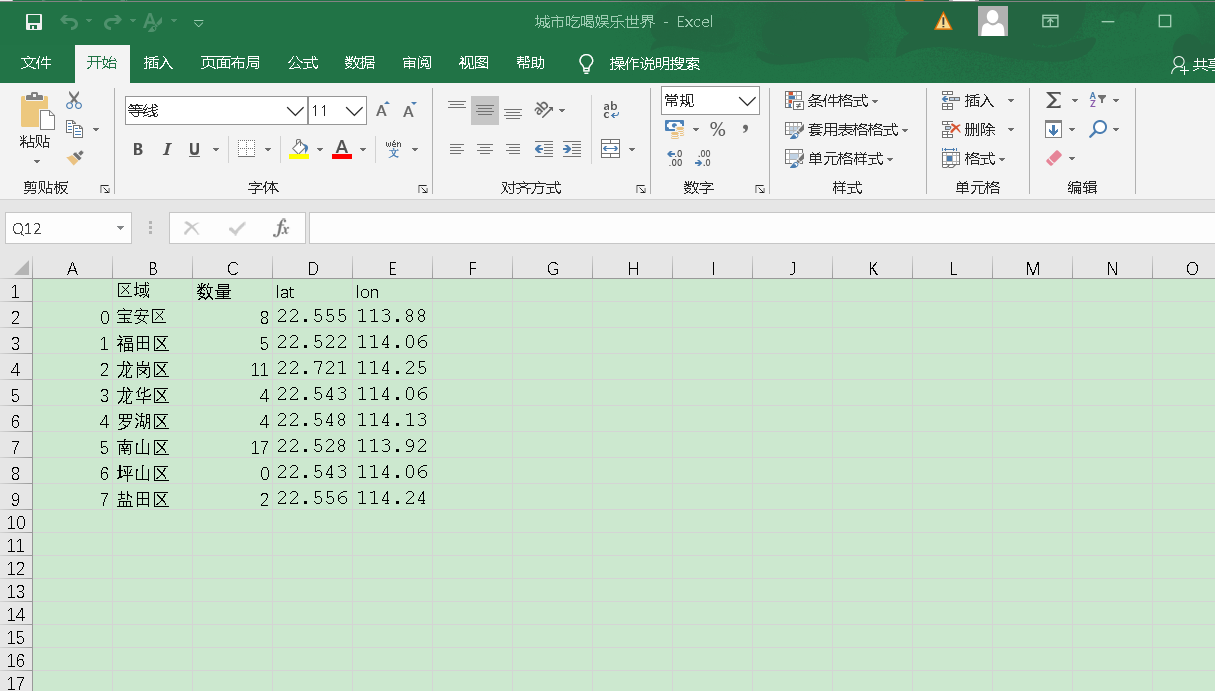
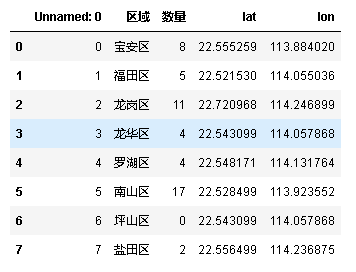
于是得到深圳各区域景点数量以及各区域各类景点数量,如图所示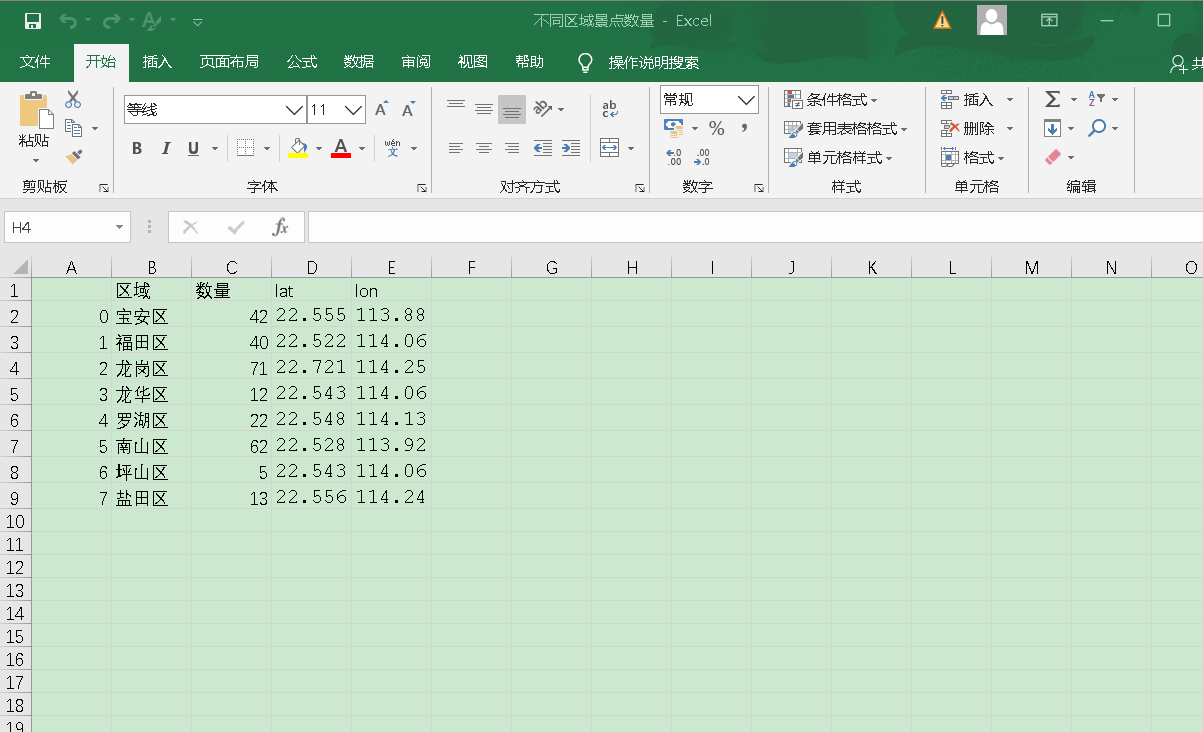
首先看各区景点数量分布情况可视化地图
import pandas as pd
df = pd.read_excel ("不同区域景点数量.xlsx", encoding = "utf8", sep="\t")df
import plotly.express as pxdf = pd.read_excel ("不同区域景点数量.xlsx", encoding = "utf8", sep="\t")fig = px.scatter_mapbox(df,lon = 'lon',lat = 'lat',size = '数量',color = '数量',hover_name = '区域',size_max = 40,color_continuous_scale=px.colors.carto.Temps)fig.update_layout(mapbox_style="open-street-map")fig.update_layout(mapbox = {'accesstoken':'pk.eyJ1IjoiYmxhY2tzaGVlcHdhbGwwMzA1IiwiYSI6ImNrMHo5ZnQxYjBjbG8zbm84b3hrb25vb24ifQ.k8toDjJDsPcjdYFTSVgTsv','center':{'lon':113.884020,'lat':22.555259},'zoom':9.5},margin={'l':0,"r":0,"t":0,'b':0})
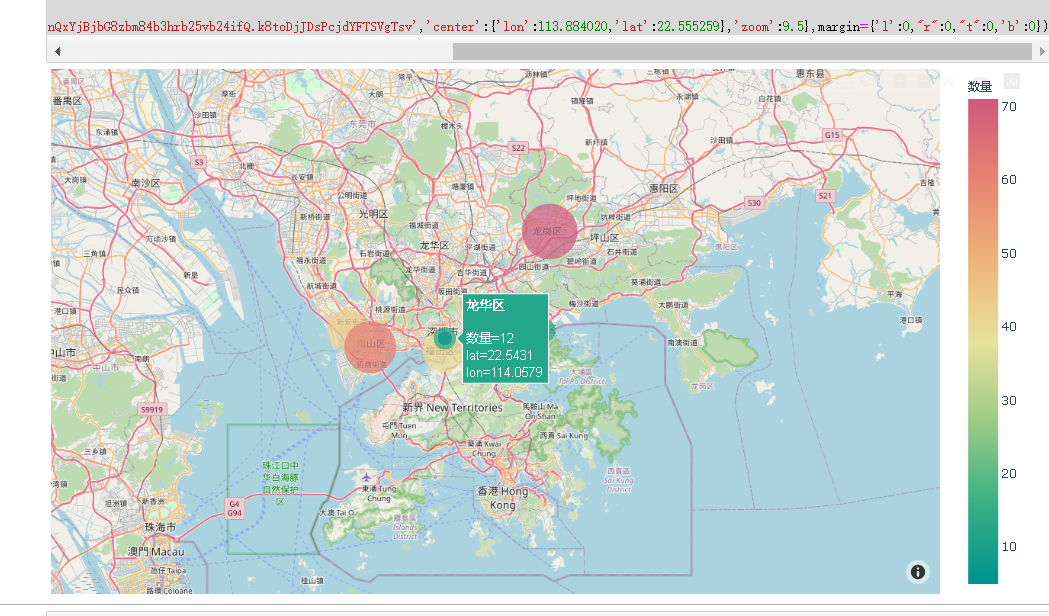
由于这个style干扰很大,我尝试了官方文档里所有的style,发现只有white-bg可用。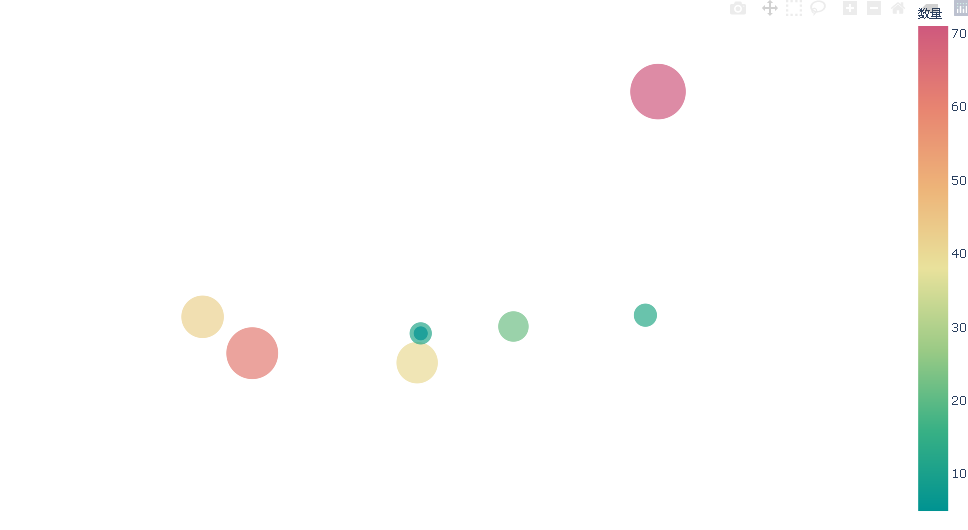
接下来可视化深圳市各区域各类型景点的情况
import pandas as pdimport plotly.graph_objs as goimport numpy as npimport json
沿海与口岸 = pd.read_excel ("沿海与口岸.xlsx", encoding = "utf8", sep="\t")文体艺术 = pd.read_excel ("文体艺术.xlsx", encoding = "utf8", sep="\t")特色村镇 = pd.read_excel ("特色村镇.xlsx", encoding = "utf8", sep="\t")华侨城与高尔夫 = pd.read_excel ("华侨城与高尔夫.xlsx", encoding = "utf8", sep="\t")公园与广场 = pd.read_excel ("公园与广场.xlsx", encoding = "utf8", sep="\t")动物生态园与山寺 = pd.read_excel ("动物生态园与山寺.xlsx", encoding = "utf8", sep="\t")城市吃喝娱乐世界 = pd.read_excel ("城市吃喝娱乐世界.xlsx", encoding = "utf8", sep="\t")
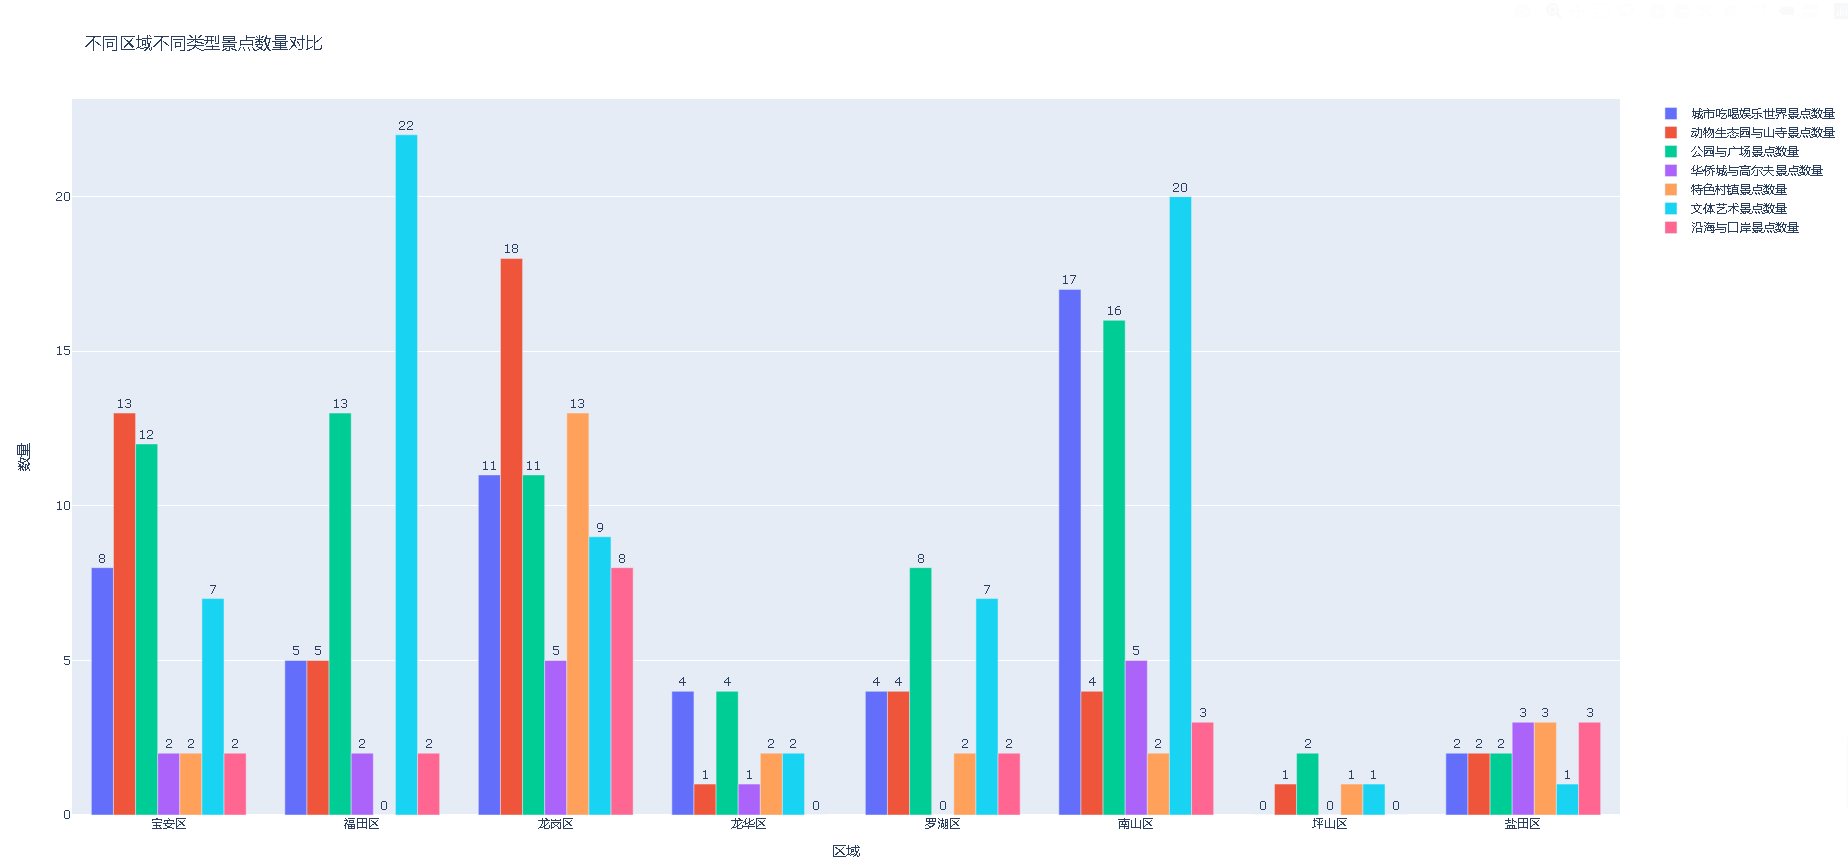
bar1 = go.Bar(x = 城市吃喝娱乐世界['区域'],y = 城市吃喝娱乐世界['数量'],text = 城市吃喝娱乐世界['数量'],textposition='outside',name='城市吃喝娱乐世界景点数量')bar2 = go.Bar(x = 动物生态园与山寺['区域'],y = 动物生态园与山寺['数量'],text = 动物生态园与山寺['数量'],textposition='outside',name='动物生态园与山寺景点数量')bar3 = go.Bar(x = 公园与广场['区域'],y = 公园与广场['数量'],text = 公园与广场['数量'],textposition='outside',name='公园与广场景点数量')bar4 = go.Bar(x = 华侨城与高尔夫['区域'],y = 华侨城与高尔夫['数量'],text = 华侨城与高尔夫['数量'],textposition='outside',name='华侨城与高尔夫景点数量')bar5 = go.Bar(x = 特色村镇['区域'],y = 特色村镇['数量'],text = 特色村镇['数量'],textposition='outside',name='特色村镇景点数量')bar6 = go.Bar(x = 文体艺术['区域'],y = 文体艺术['数量'],text = 文体艺术['数量'],textposition='outside',name='文体艺术景点数量')bar7 = go.Bar(x = 沿海与口岸['区域'],y = 沿海与口岸['数量'],text = 沿海与口岸['数量'],textposition='outside',name='沿海与口岸景点数量')fig = go.Figure([bar1,bar2,bar3,bar4,bar5,bar6,bar7])fig.update_layout(title = '不同区域不同类型景点数量对比',xaxis_title = "区域",yaxis_title = "数量")fig.show()

若有收获,就点个赞吧
0 人点赞


