单细胞基础分析


左边芯片数据,右边TCGA转录组 数据 下载方式
下载方式
找了多个 芯片GEO数据找到了多少个上下调基因。一般 文章 中用的padjust比较多
TCGA使用了 这个癌症数据
然后 差异基因取交集82个上下调基因
然后GO/KEGG/PPI
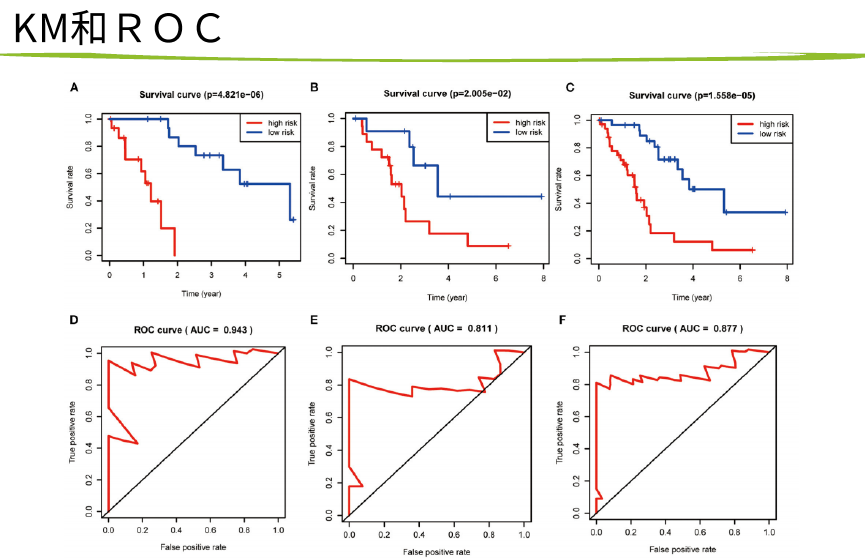
然后 hub基因的KM-PLOT和ROC曲线
最后单细胞验证hub基因,PCR和TIMER验证
六个数据的PCA图
放宽标准,6个 数据有2个数据是交集 即可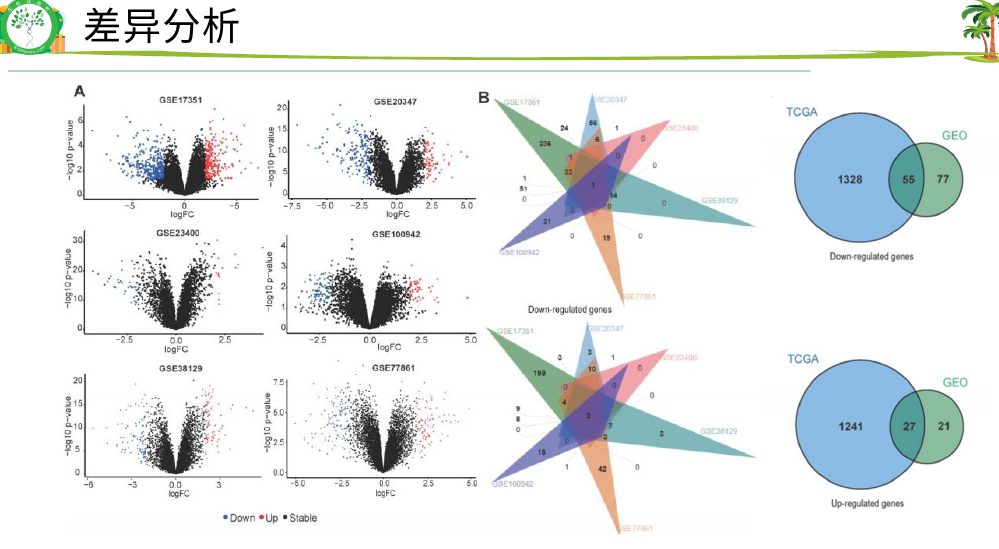
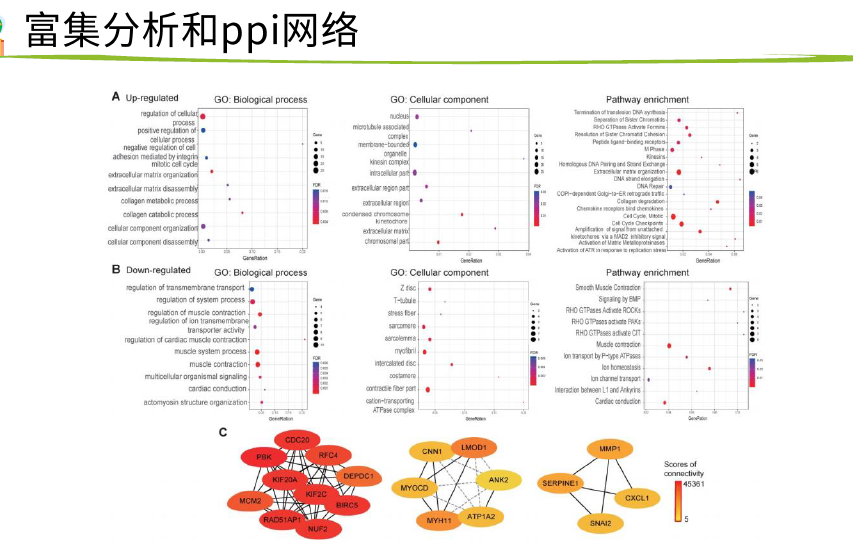
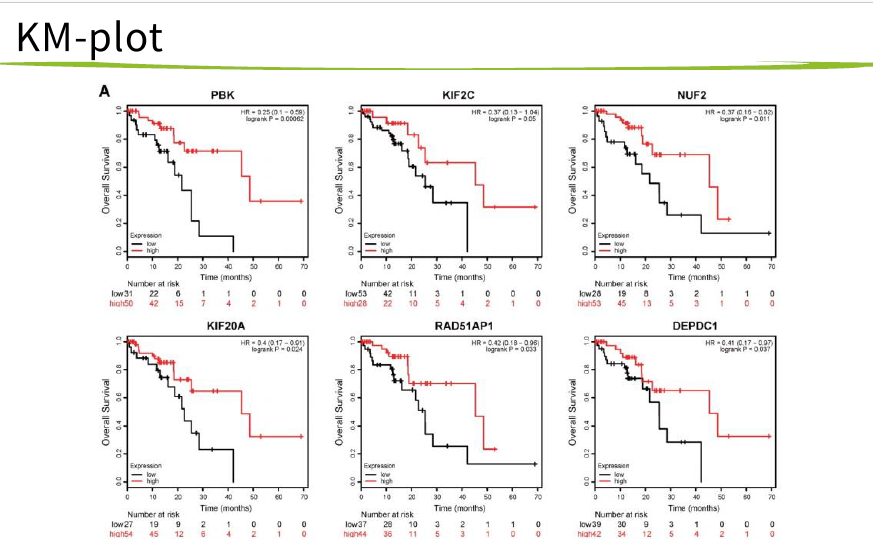
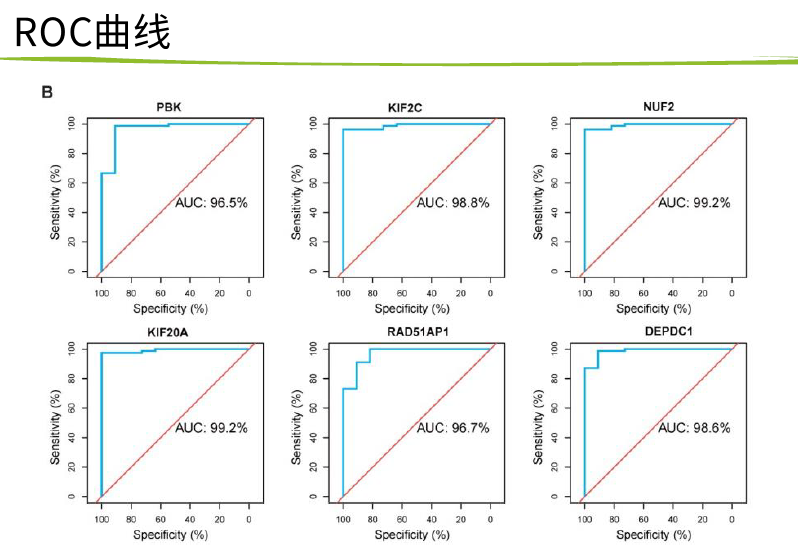
网页工具是专用数据库借鉴,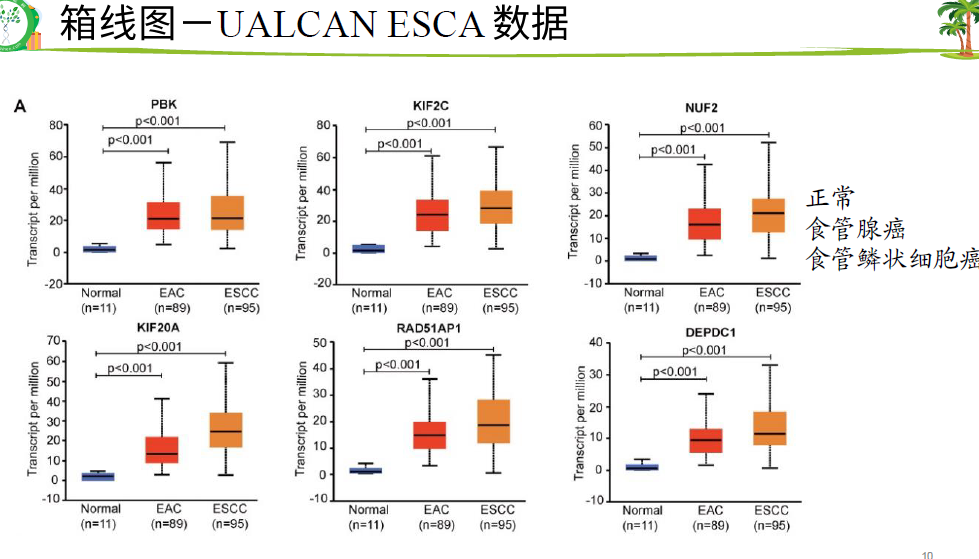
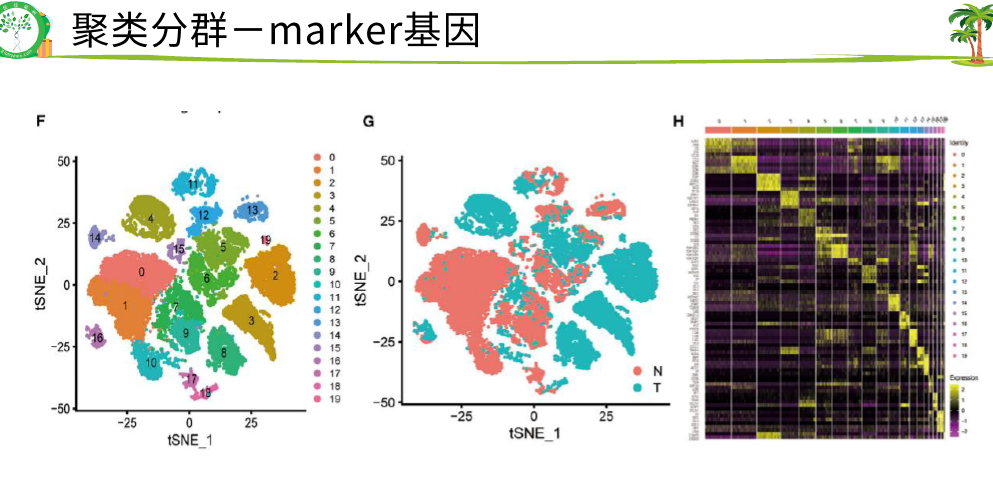
tsne1和tsne2比PCA更加复杂 的降维方式
每一个点是一个 细胞,上面是marker基因,发现这两个圈圈里的细胞是这些基因的 表达比较高一点
右边是一个热图,展示不同簇的marker基因是哪些,很明显有4个簇,0123,表达量高的基因是哪些
最下面是对0-4注释是哪些细胞类型
就知道了12对应癌细胞,03对应非癌细胞 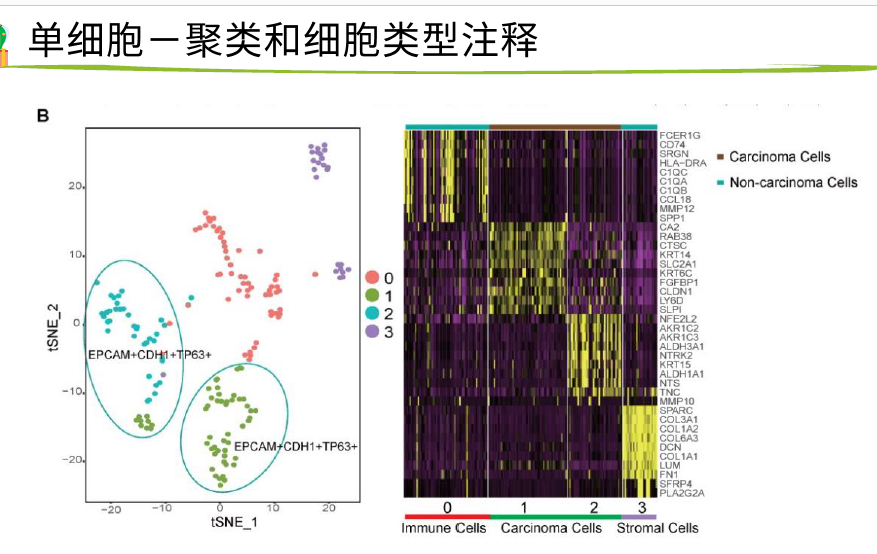
把B中 的 6个基因的表达量作为颜色 变量 投射到细胞点 上 ,都是 在tumor上 表达 高 ,在 非癌表达低

网页工具叫timer,免疫细胞丰度,展示是这些基因与6种免疫细胞的相关性程度,第一个是肿瘤纯度矫正
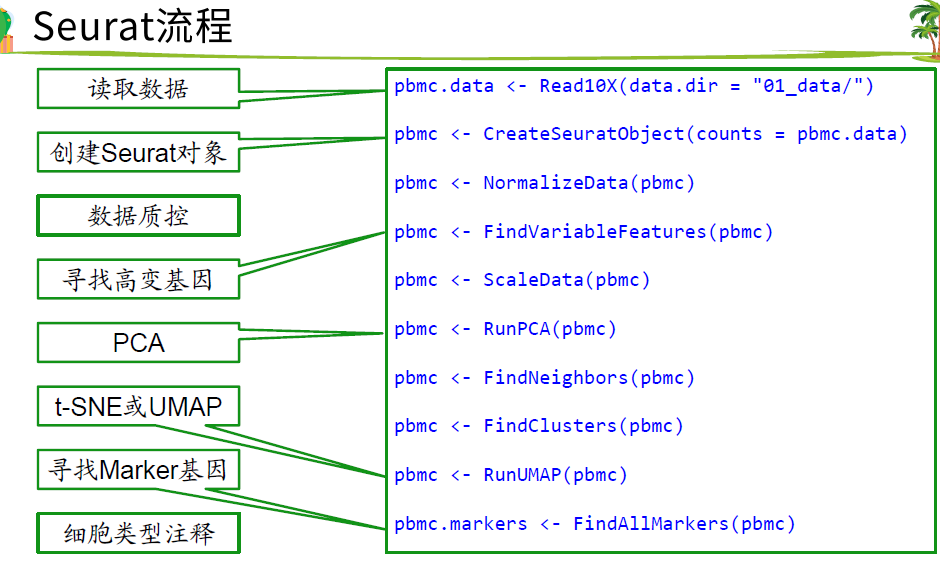
Seurat标准流程
括号前的英文单词是函数 ,
data/是文件夹 ,里面包含标准的输入数据
barcode相当于 样本ID
genes是ensbel和symbol的对应
第三个matrix是矩阵
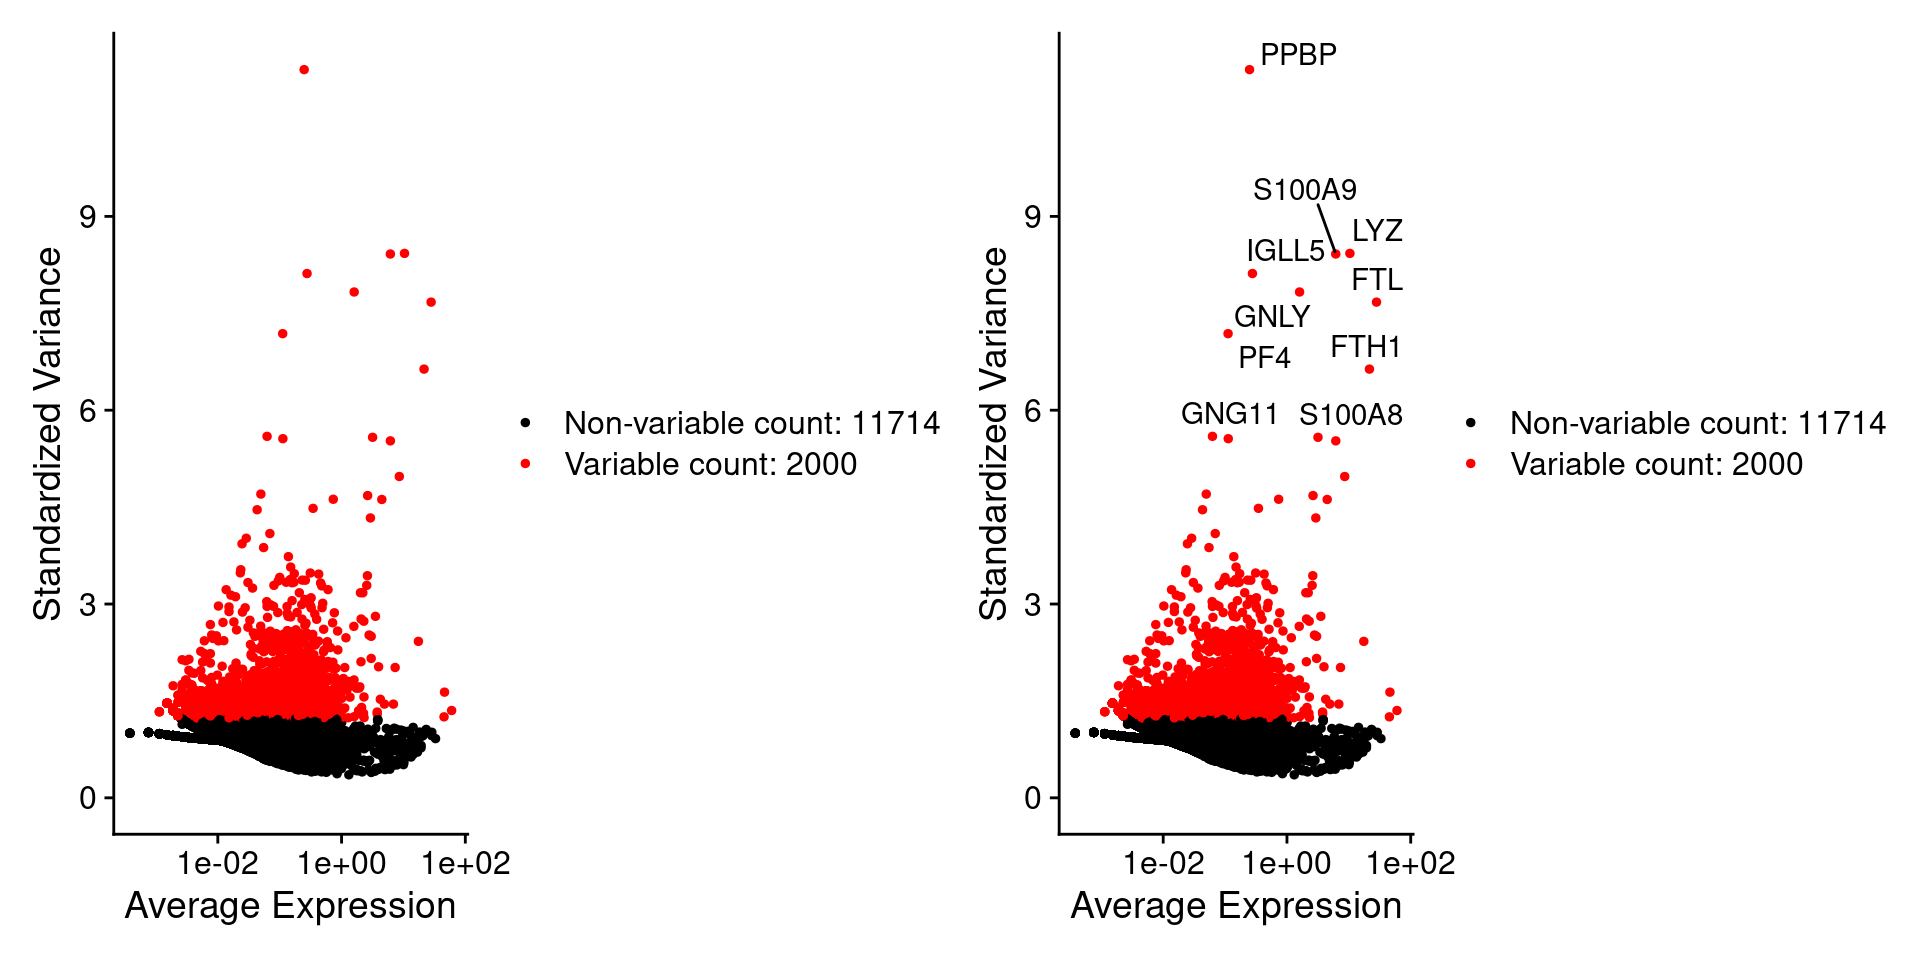
高变基因是指方差 大的那些基因
1.数据和R包准备
代码:https://satijalab.org/seurat/v3.0/pbmc3k_tutorial.html
数据:https://s3-us-west-2.amazonaws.com/10x.files/samples/cell/pbmc3k/pbmc3k_filtered_gene_bc_matrices.tar.gz
rm(list = ls())options(stringsAsFactors = F)library(dplyr)library(Seurat)library(patchwork)
2.读取数据
10X的输入数据是固定的三个文件,在工作目录下新建01_data/,把三个文件放进去。
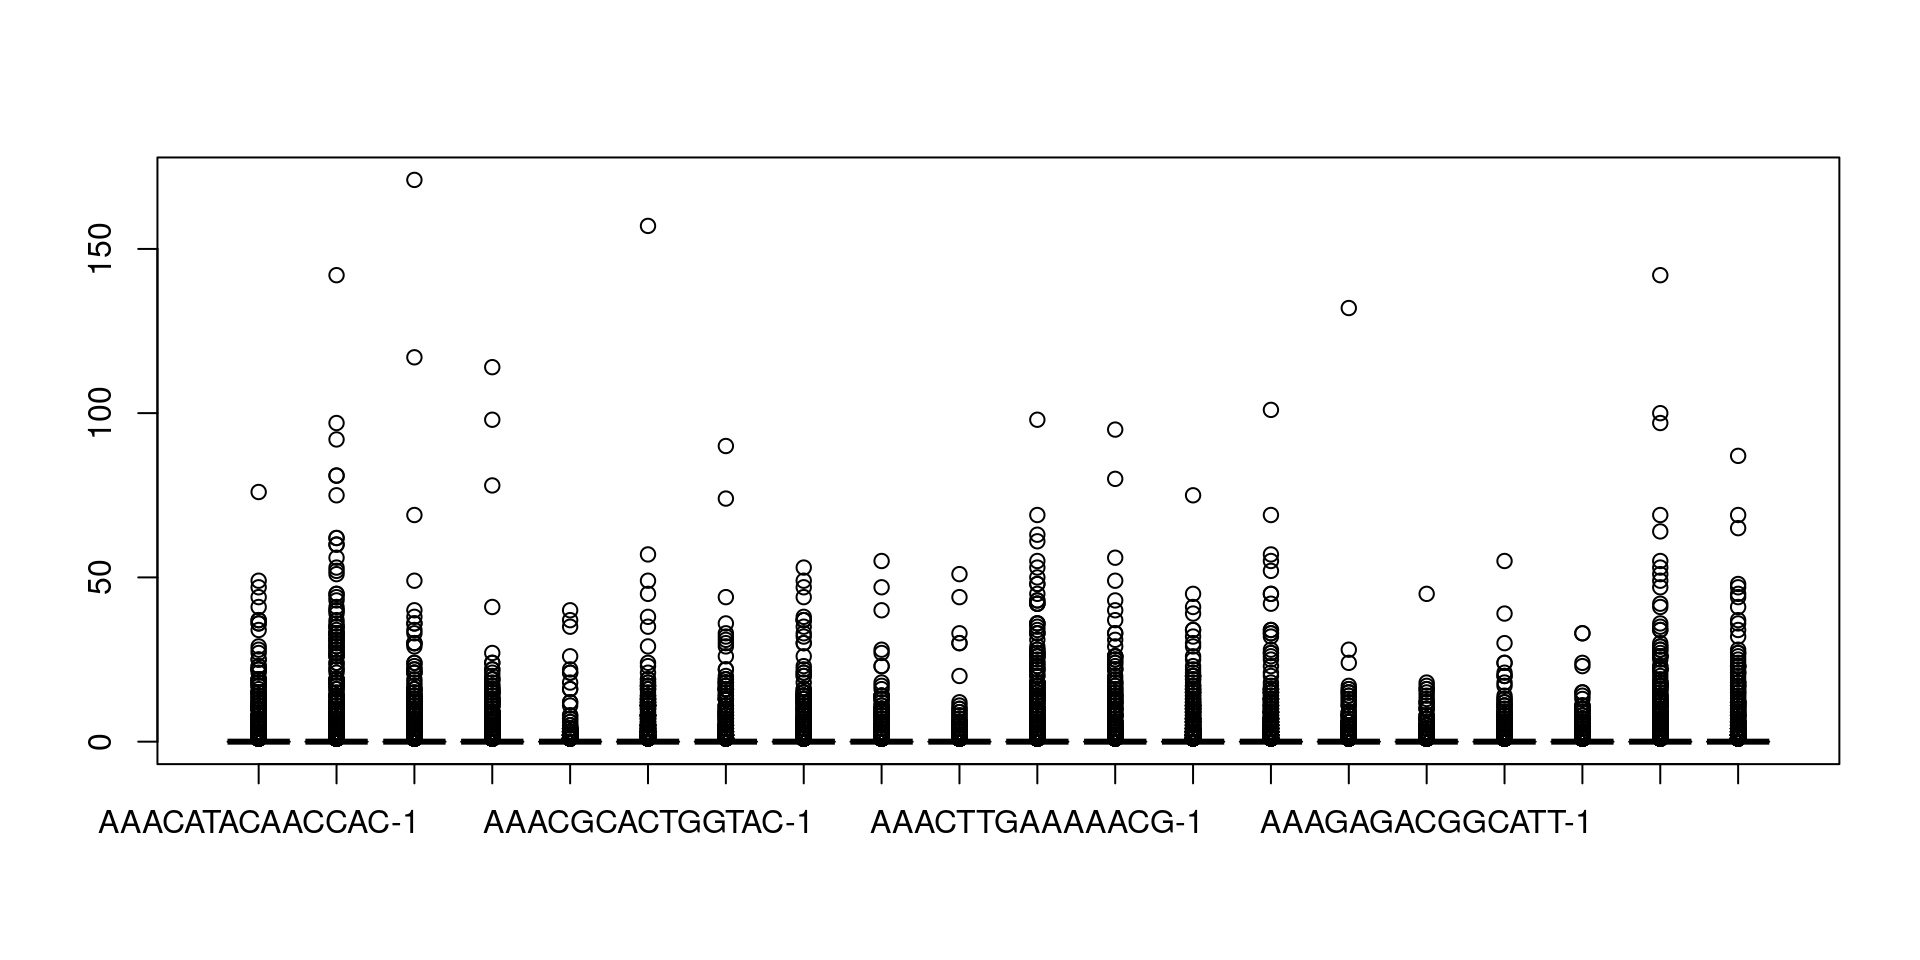
##Read10X函数读取数据pbmc.data <- Read10X(data.dir = "01_data/")dim(pbmc.data)## [1] 32738 27002700个细胞 32738个基因##CreateSeuratObject读进来的数据创建为serut对象并过滤,min.cells 至少在3个细胞里面表达的基因##和min.features是一个细胞要有200及以上的基因表达量才保留细胞,pbmc <- CreateSeuratObject(counts = pbmc.data,project = "pbmc3k",min.cells = 3,min.features = 200)pbmc## An object of class Seurat## 13714 features across 2700 samples within 1 assay## Active assay: RNA (13714 features, 0 variable features)# 查看表达矩阵##具体怎么提取要自己根据对象来探索更改exp = pbmc@assays$RNA@counts;dim(exp)## [1] 13714 2700exp[30:34,1:4]##列名当成细胞的编号## 5 x 4 sparse Matrix of class "dgCMatrix"## AAACATACAACCAC-1 AAACATTGAGCTAC-1 AAACATTGATCAGC-1 AAACCGTGCTTCCG-1## MRPL20 1 . 1 .## ATAD3C . . . .## ATAD3B . . . .## ATAD3A . . . .## SSU72 . 1 . 3boxplot(as.matrix(exp[,1:20]))##简单画一下前20个基因的表达量
3.质控
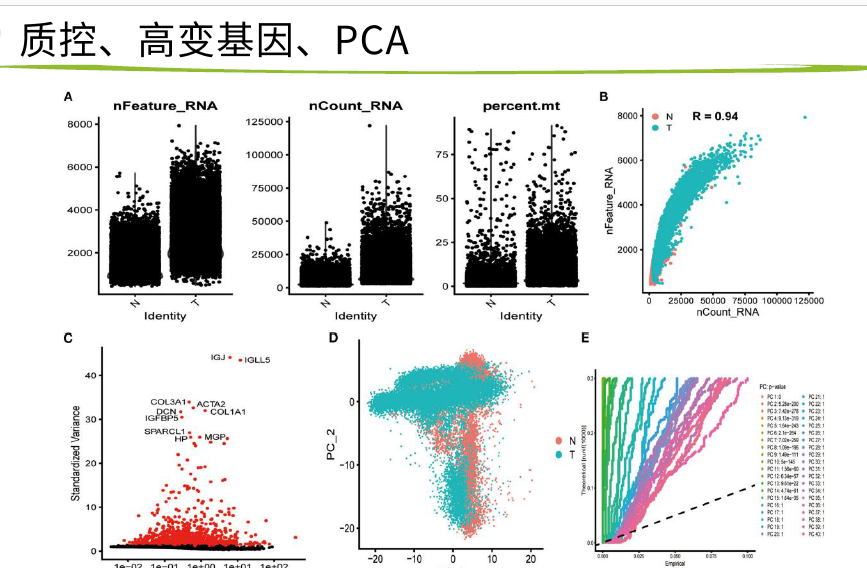
这里是对细胞进行的质控,指标是:
线粒体基因含量不能过高;
nFeature_RNA 不能过高或过低
为什么? nFeature_RNA是每个细胞中检测到的基因数量。nCount_RNA是细胞内检测到的分子总数。nFeature_RNA过低,表示该细胞可能已死/将死或是空液滴。太高的nCount_RNA和/或nFeature_RNA表明“细胞”实际上可以是两个或多个细胞。结合线粒体基因count数除去异常值,即可除去大多数双峰/死细胞/空液滴,因此它们过滤是常见的预处理步骤。 参考自:https://www.biostars.org/p/407036/
## PercentageFeatureSet专用来处理的函数 ,^以什么开头,以MT开头就是线粒体基因#percent.mt包含了每一个细胞里包含的线粒体比例pbmc[["percent.mt"]] <- PercentageFeatureSet(pbmc, pattern = "^MT-")head(pbmc@meta.data, 3)## orig.ident nCount_RNA nFeature_RNA percent.mt## AAACATACAACCAC-1 pbmc3k 2419 779 3.0177759## AAACATTGAGCTAC-1 pbmc3k 4903 1352 3.7935958## AAACATTGATCAGC-1 pbmc3k 3147 1129 0.8897363##然后画一个图看看VlnPlotVlnPlot(pbmc,features = c("nFeature_RNA","nCount_RNA","percent.mt"),ncol = 3)
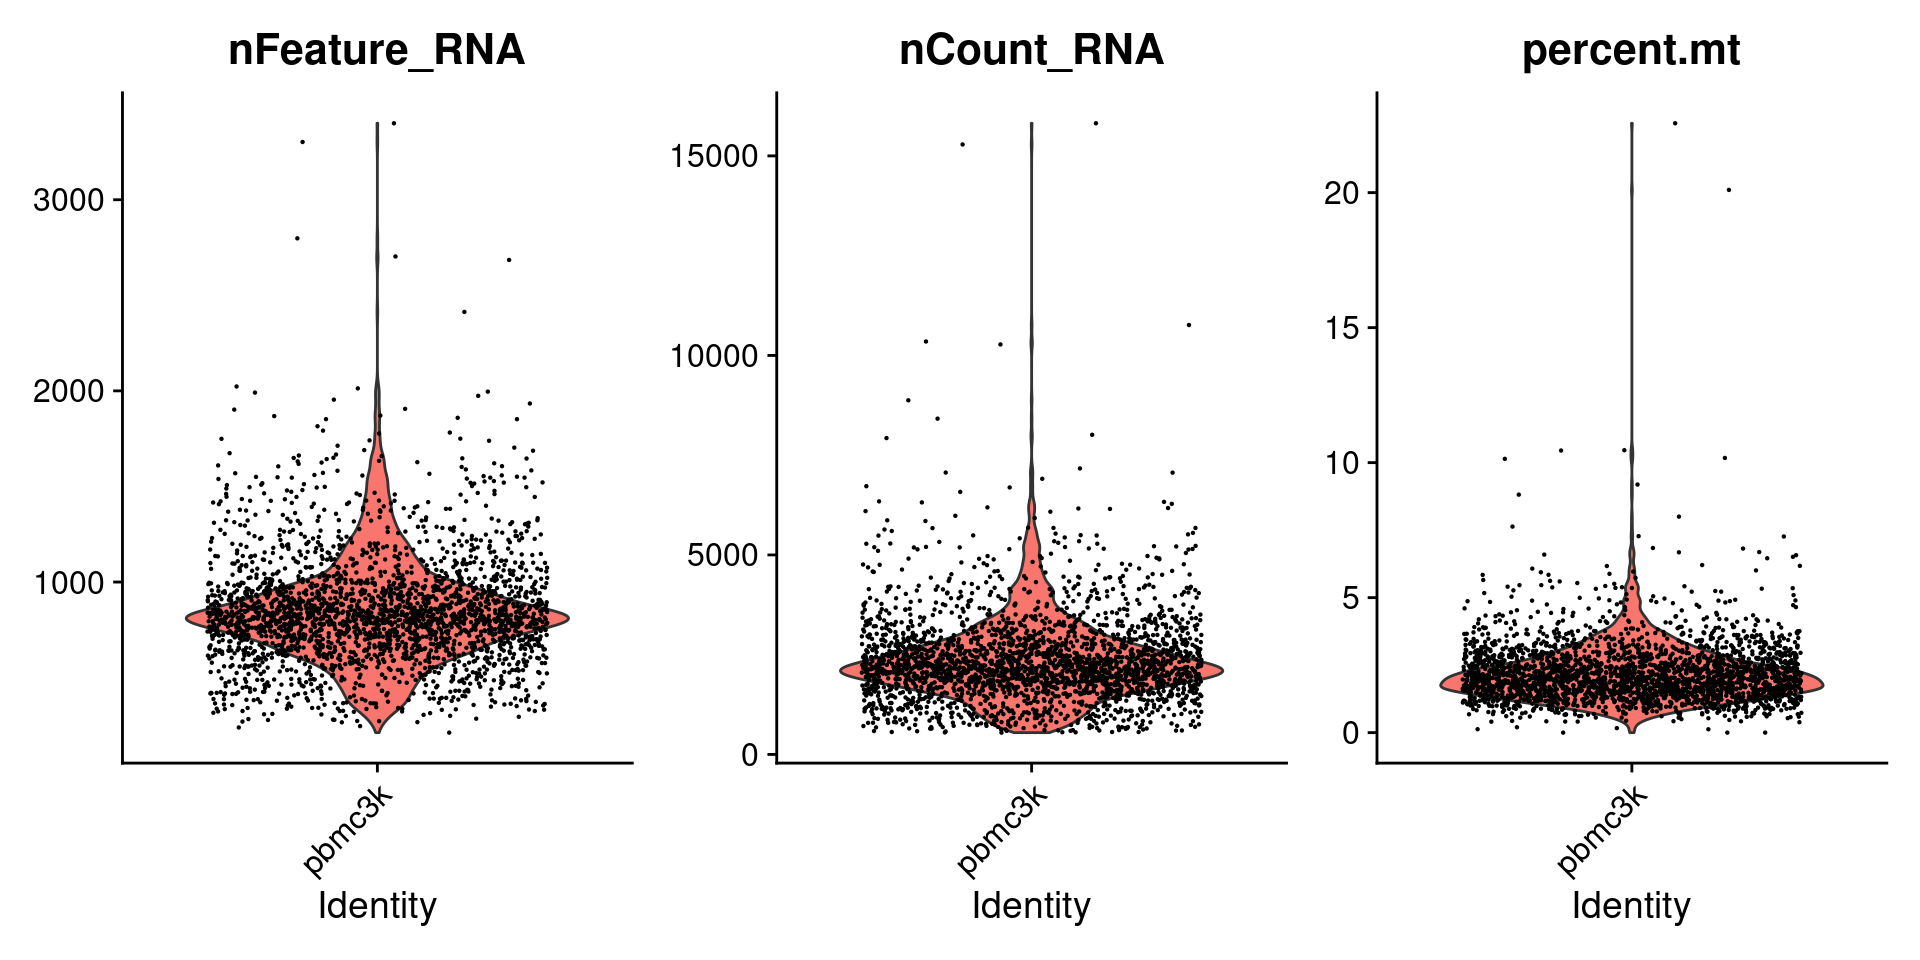
根据这个三个图,确定了这个数据的过滤标准:
nFeature_RNA在200~2500之间;线粒体基因占比在5%以下。
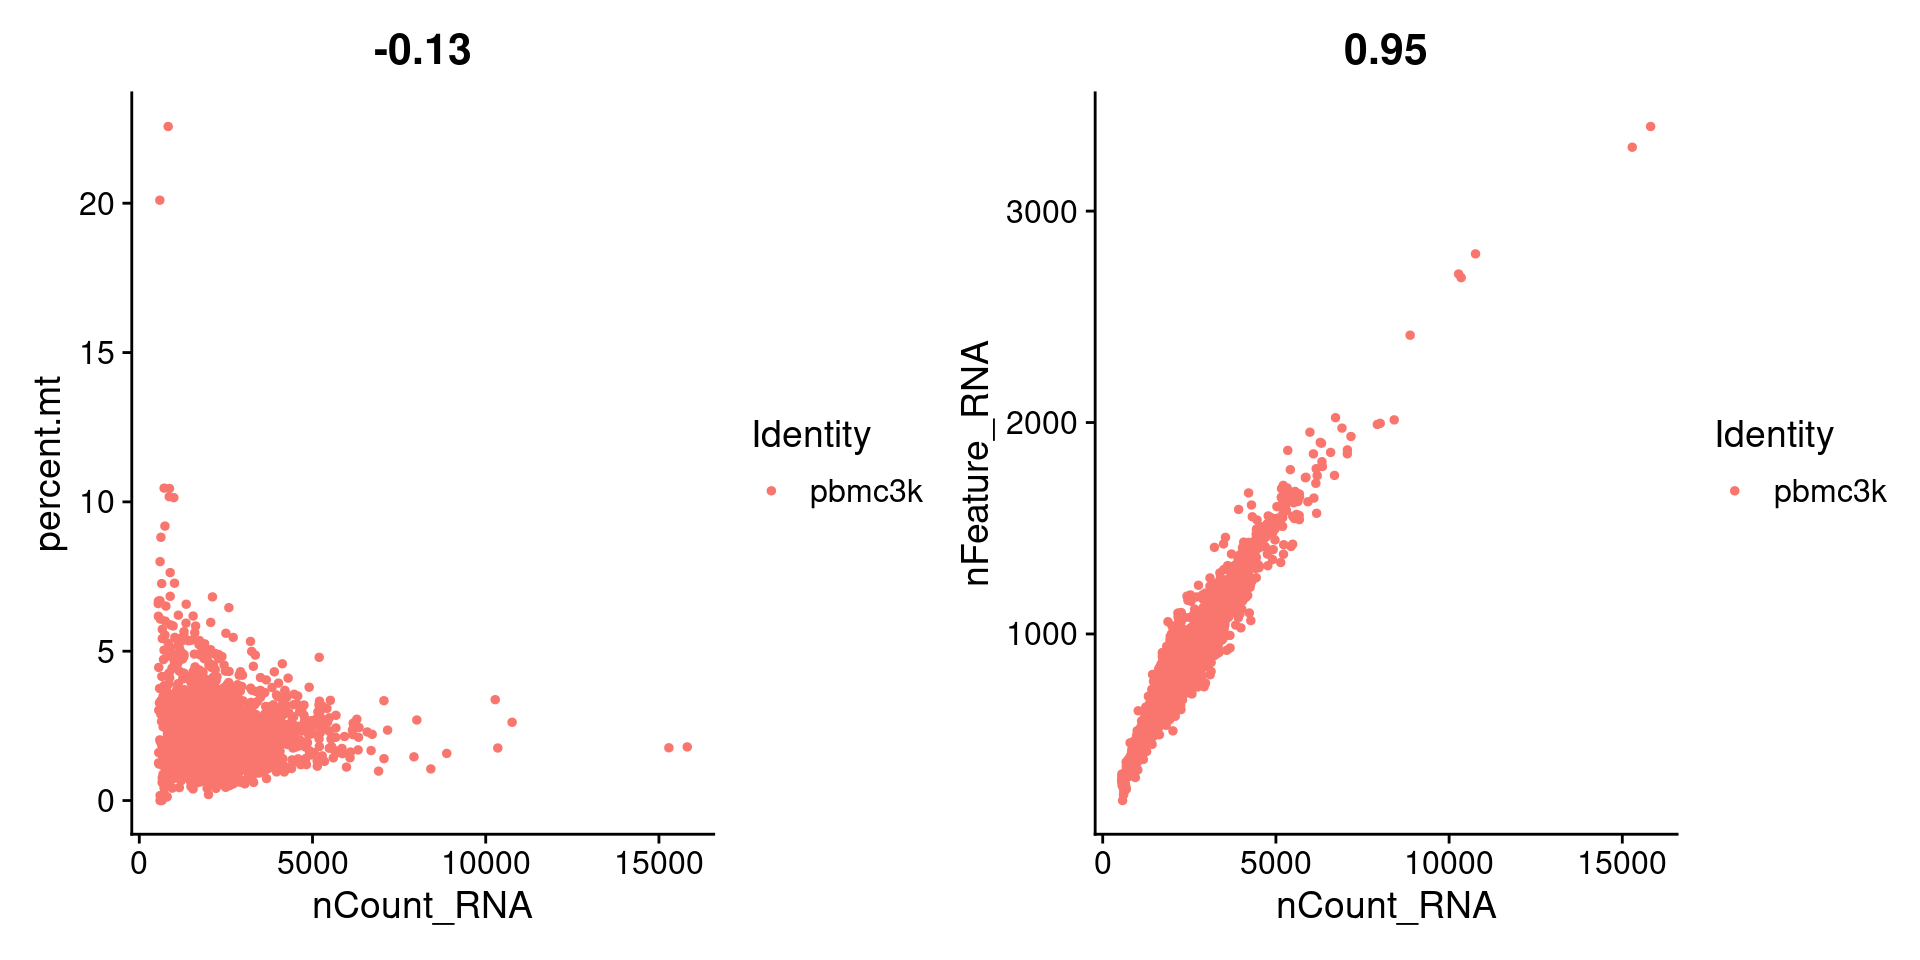
3.2 三个指标之间的相关性
plot1 <- FeatureScatter(pbmc,feature1 = "nCount_RNA",feature2 = "percent.mt")plot2 <- FeatureScatter(pbmc,feature1 = "nCount_RNA",feature2 = "nFeature_RNA")plot1 + plot2
3.4 过滤
##subset函数进行过滤,标准就是前面筛选的pbmc <- subset(pbmc,subset = nFeature_RNA > 200 &nFeature_RNA < 2500 &percent.mt < 5)dim(pbmc)## [1] 13714 2638
4.找高变基因(HVG)
##默认参数是找2000个pbmc <- NormalizeData(pbmc)pbmc <- FindVariableFeatures(pbmc)top10 <- head(VariableFeatures(pbmc), 10);top10## [1] "PPBP" "LYZ" "S100A9" "IGLL5" "GNLY" "FTL" "PF4" "FTH1"## [9] "GNG11" "S100A8"这里选了2000个,把前十个在图上标记出来。plot1 <- VariableFeaturePlot(pbmc)plot2 <- LabelPoints(plot = plot1,points = top10,repel = TRUE)plot1 + plot2
5. 标准化和降维
all.genes <- rownames(pbmc)pbmc <- ScaleData(pbmc, features = all.genes)pbmc[["RNA"]]@scale.data[30:34,1:3]##简单看下## AAACATACAACCAC-1 AAACATTGAGCTAC-1 AAACATTGATCAGC-1## MRPL20 1.50566156 -0.56259931 1.24504892## ATAD3C -0.04970561 -0.04970561 -0.04970561## ATAD3B -0.10150202 -0.10150202 -0.10150202## ATAD3A -0.13088200 -0.13088200 -0.13088200## SSU72 -0.68454728 0.58087748 -0.68454728
5.1 线性降维PCA
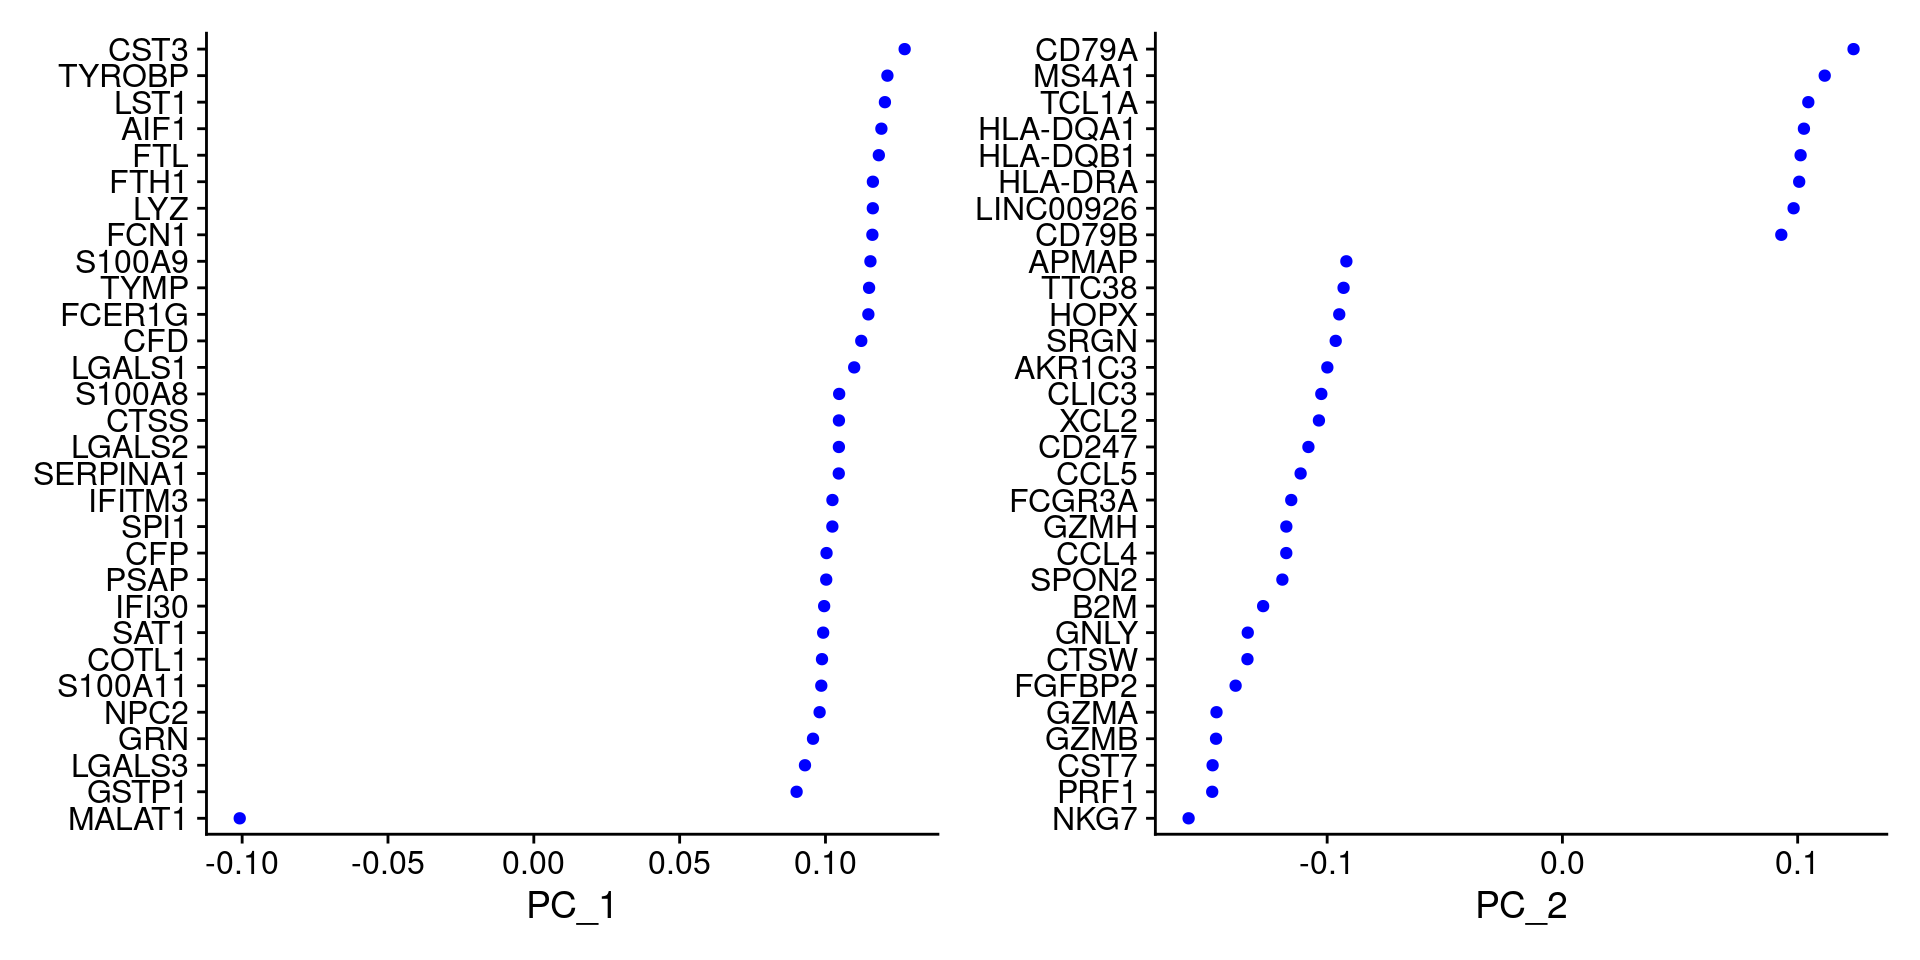
pbmc <- RunPCA(pbmc, features = VariableFeatures(pbmc))# 查看前5个主成分由哪些feature组成##只展示前 5个print(pbmc[["pca"]], dims = 1:5, nfeatures = 5)## PC_ 1## Positive: CST3, TYROBP, LST1, AIF1, FTL## Negative: MALAT1, LTB, IL32, IL7R, CD2## PC_ 2## Positive: CD79A, MS4A1, TCL1A, HLA-DQA1, HLA-DQB1## Negative: NKG7, PRF1, CST7, GZMB, GZMA## PC_ 3## Positive: HLA-DQA1, CD79A, CD79B, HLA-DQB1, HLA-DPB1## Negative: PPBP, PF4, SDPR, SPARC, GNG11## PC_ 4## Positive: HLA-DQA1, CD79B, CD79A, MS4A1, HLA-DQB1## Negative: VIM, IL7R, S100A6, IL32, S100A8## PC_ 5## Positive: GZMB, NKG7, S100A8, FGFBP2, GNLY## Negative: LTB, IL7R, CKB, VIM, MS4A7##展示自己的基因使用VizDimLoadingsVizDimLoadings(pbmc, dims = 1:2, reduction = "pca")
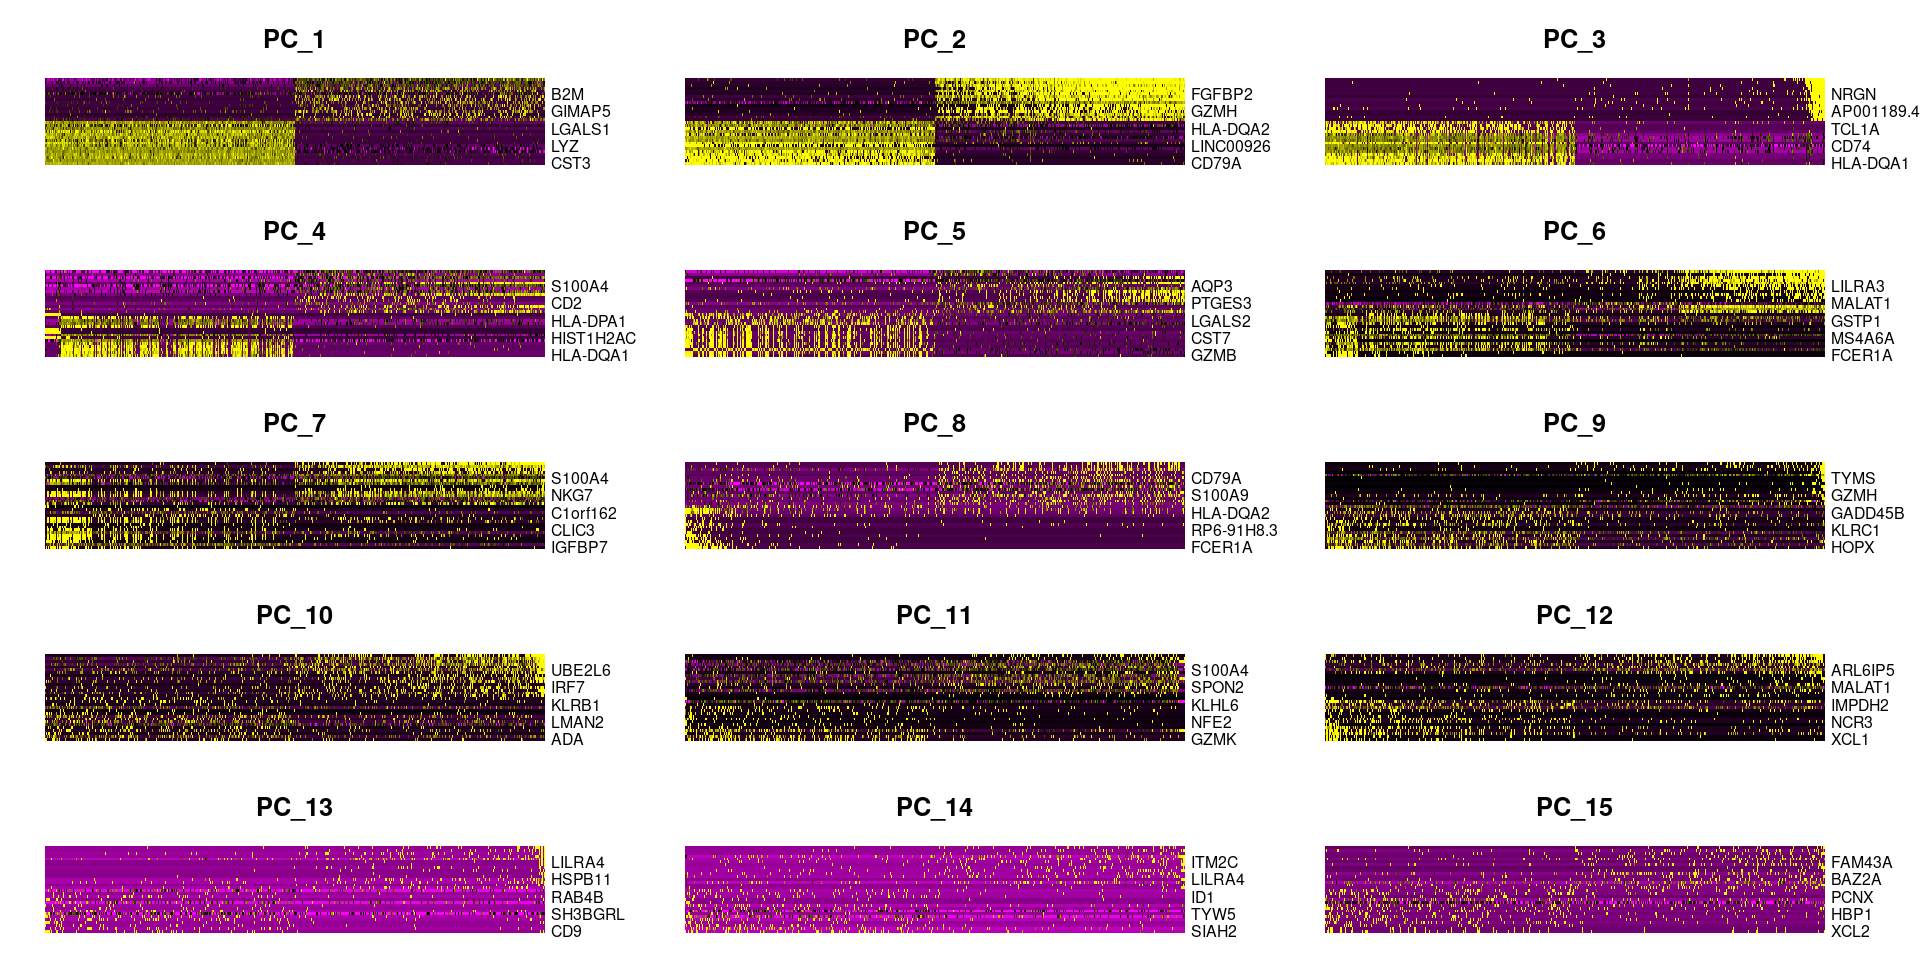
#每个主成分对应基因的热图DimHeatmap(pbmc, dims = 1:15, cells = 500)
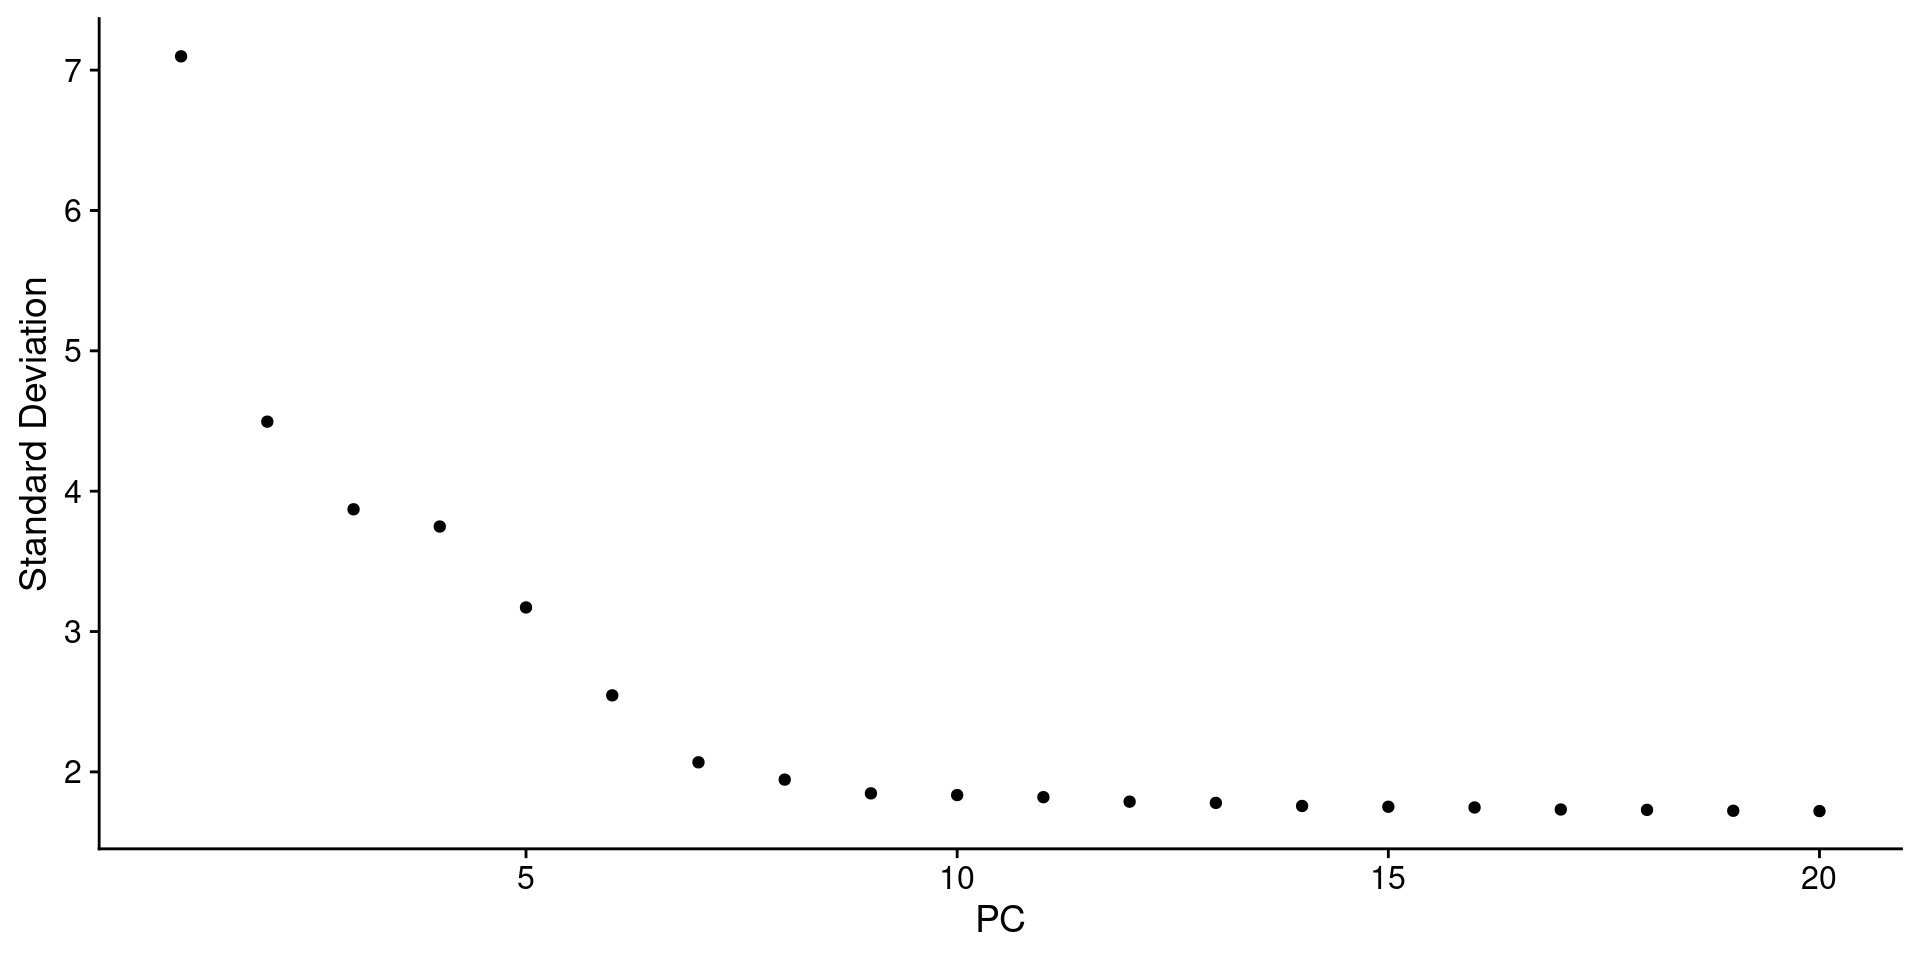
# 应该选多少个主成分进行后续分析:方法一ElbowPlot(pbmc)
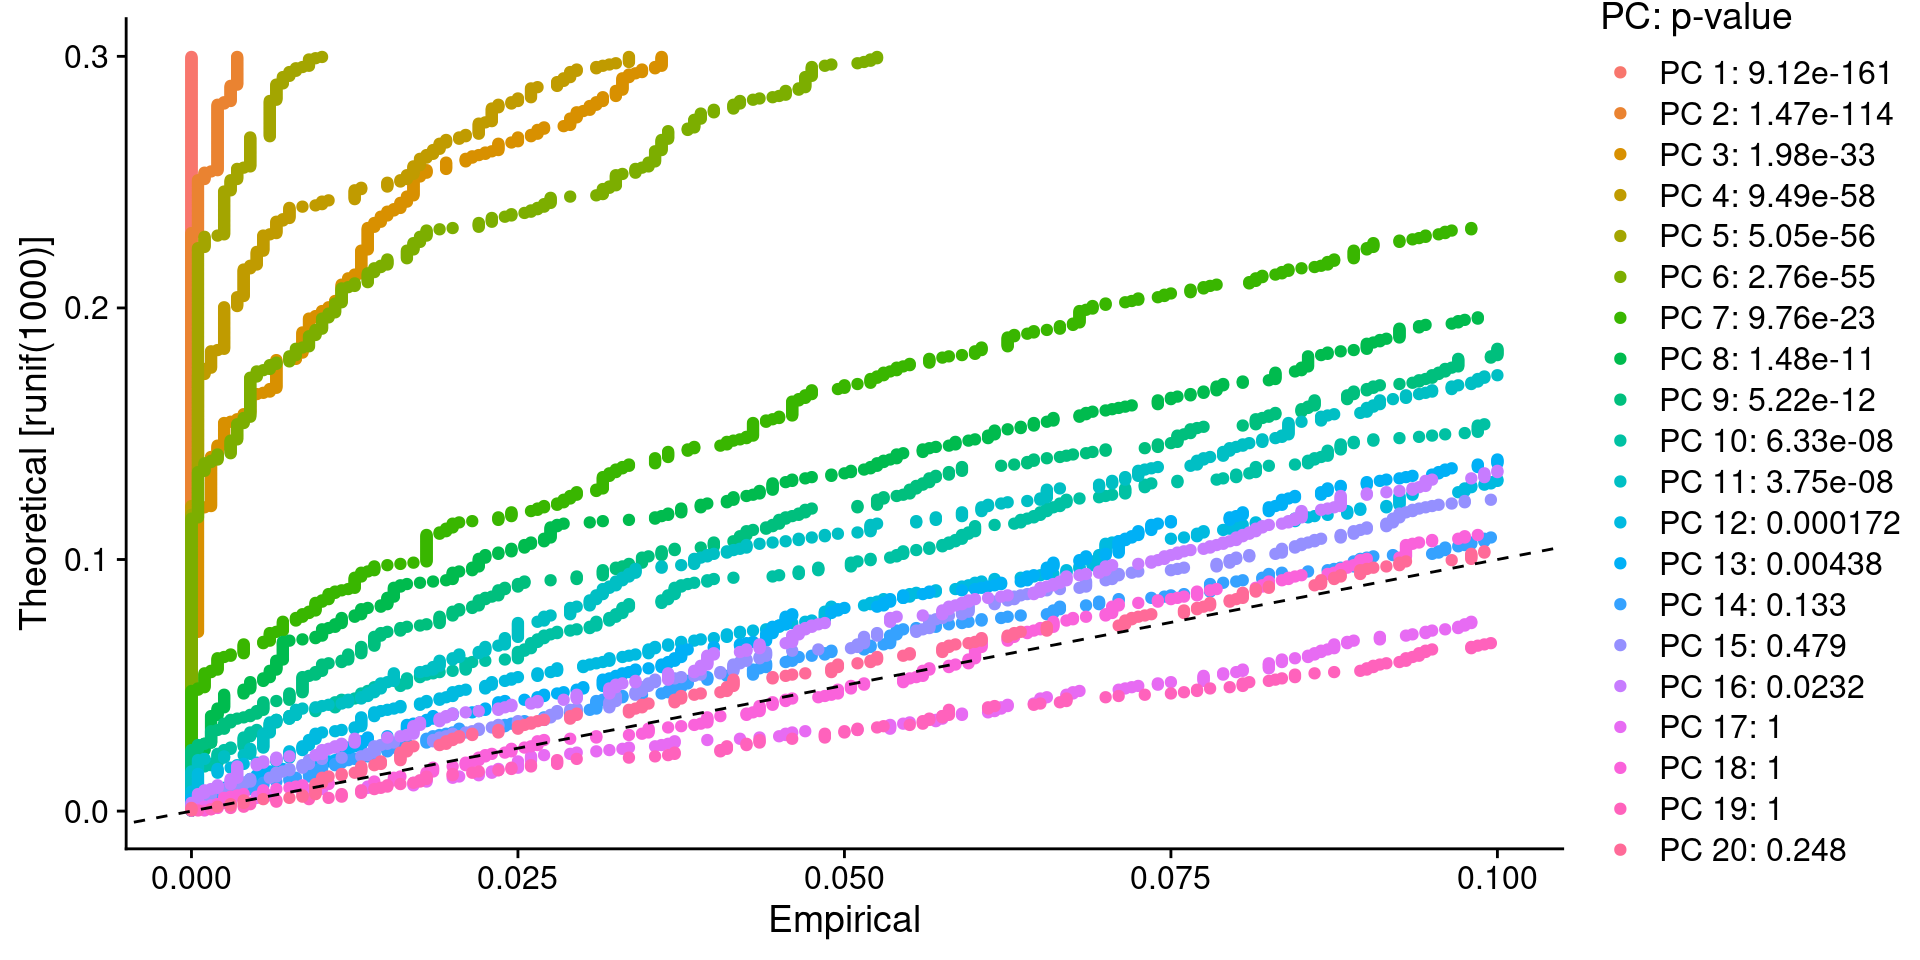
:方法二:选P<0.05的pbmc <- JackStraw(pbmc, num.replicate = 100)pbmc <- ScoreJackStraw(pbmc, dims = 1:20)JackStrawPlot(pbmc, dims = 1:20)
#PC1和2画一下PCA图DimPlot(pbmc, reduction = "pca")+ NoLegend()

# 结合JackStrawPlot和ElbowPlot,挑选10个PC,所以这里dims定义为1:10一般 选多一点比较好 ,resolution = 0.5是分辨率,数值大小会关系着分群的数的多少,0.1-1pbmc <- FindNeighbors(pbmc, dims = 1:10)pbmc <- FindClusters(pbmc, resolution = 0.5) #分辨率## Modularity Optimizer version 1.3.0 by Ludo Waltman and Nees Jan van Eck#### Number of nodes: 2638## Number of edges: 95927#### Running Louvain algorithm...## Maximum modularity in 10 random starts: 0.8728## Number of communities: 9## Elapsed time: 0 seconds# 结果聚成几类,用Idents查看length(levels(Idents(pbmc)))## [1] 9
5.2 UMAP 和t-sne
PCA是线性降维,这两个是非线性降维
pbmc <- RunUMAP(pbmc, dims = 1:10)DimPlot(pbmc, reduction = "umap")
6.找marker基因
啥叫marker基因呢。和差异基因里面的上调基因有点类似,某个基因在某一簇细胞里表达量都很高,在其他簇表达量很低,那么这个基因就是这簇细胞的象征。
找全部cluster的maker基因
pbmc.markers <- FindAllMarkers(pbmc,only.pos = TRUE, # 只返回positive基因min.pct = 0.25) #只计算至少在(两簇细胞总数的)25%的细胞中有表达的基因pbmc.markers %>% group_by(cluster) %>% top_n(n = 2, wt = avg_log2FC)## # A tibble: 18 x 7## # Groups: cluster [9]## p_val avg_log2FC pct.1 pct.2 p_val_adj cluster gene## <dbl> <dbl> <dbl> <dbl> <dbl> <fct> <chr>## 1 3.75e-112 1.09 0.912 0.592 5.14e-108 0 LDHB## 2 9.57e- 88 1.36 0.447 0.108 1.31e- 83 0 CCR7## 3 0 5.57 0.996 0.215 0 1 S100A9## 4 0 5.48 0.975 0.121 0 1 S100A8## 5 1.06e- 86 1.27 0.981 0.643 1.45e- 82 2 LTB## 6 2.97e- 58 1.23 0.42 0.111 4.07e- 54 2 AQP3## 7 0 4.31 0.936 0.041 0 3 CD79A## 8 9.48e-271 3.59 0.622 0.022 1.30e-266 3 TCL1A## 9 5.61e-202 3.10 0.983 0.234 7.70e-198 4 CCL5## 10 7.25e-165 3.00 0.577 0.055 9.95e-161 4 GZMK## 11 3.51e-184 3.31 0.975 0.134 4.82e-180 5 FCGR3A## 12 2.03e-125 3.09 1 0.315 2.78e-121 5 LST1## 13 7.95e-269 4.83 0.961 0.068 1.09e-264 6 GZMB## 14 3.13e-191 5.32 0.961 0.131 4.30e-187 6 GNLY## 15 1.48e-220 3.87 0.812 0.011 2.03e-216 7 FCER1A## 16 1.67e- 21 2.87 1 0.513 2.28e- 17 7 HLA-DPB1## 17 9.25e-186 7.29 1 0.011 1.27e-181 8 PF4## 18 1.92e-102 8.59 1 0.024 2.63e- 98 8 PPBP
6.1 比较某个基因在几个cluster之间的表达量
小提琴图
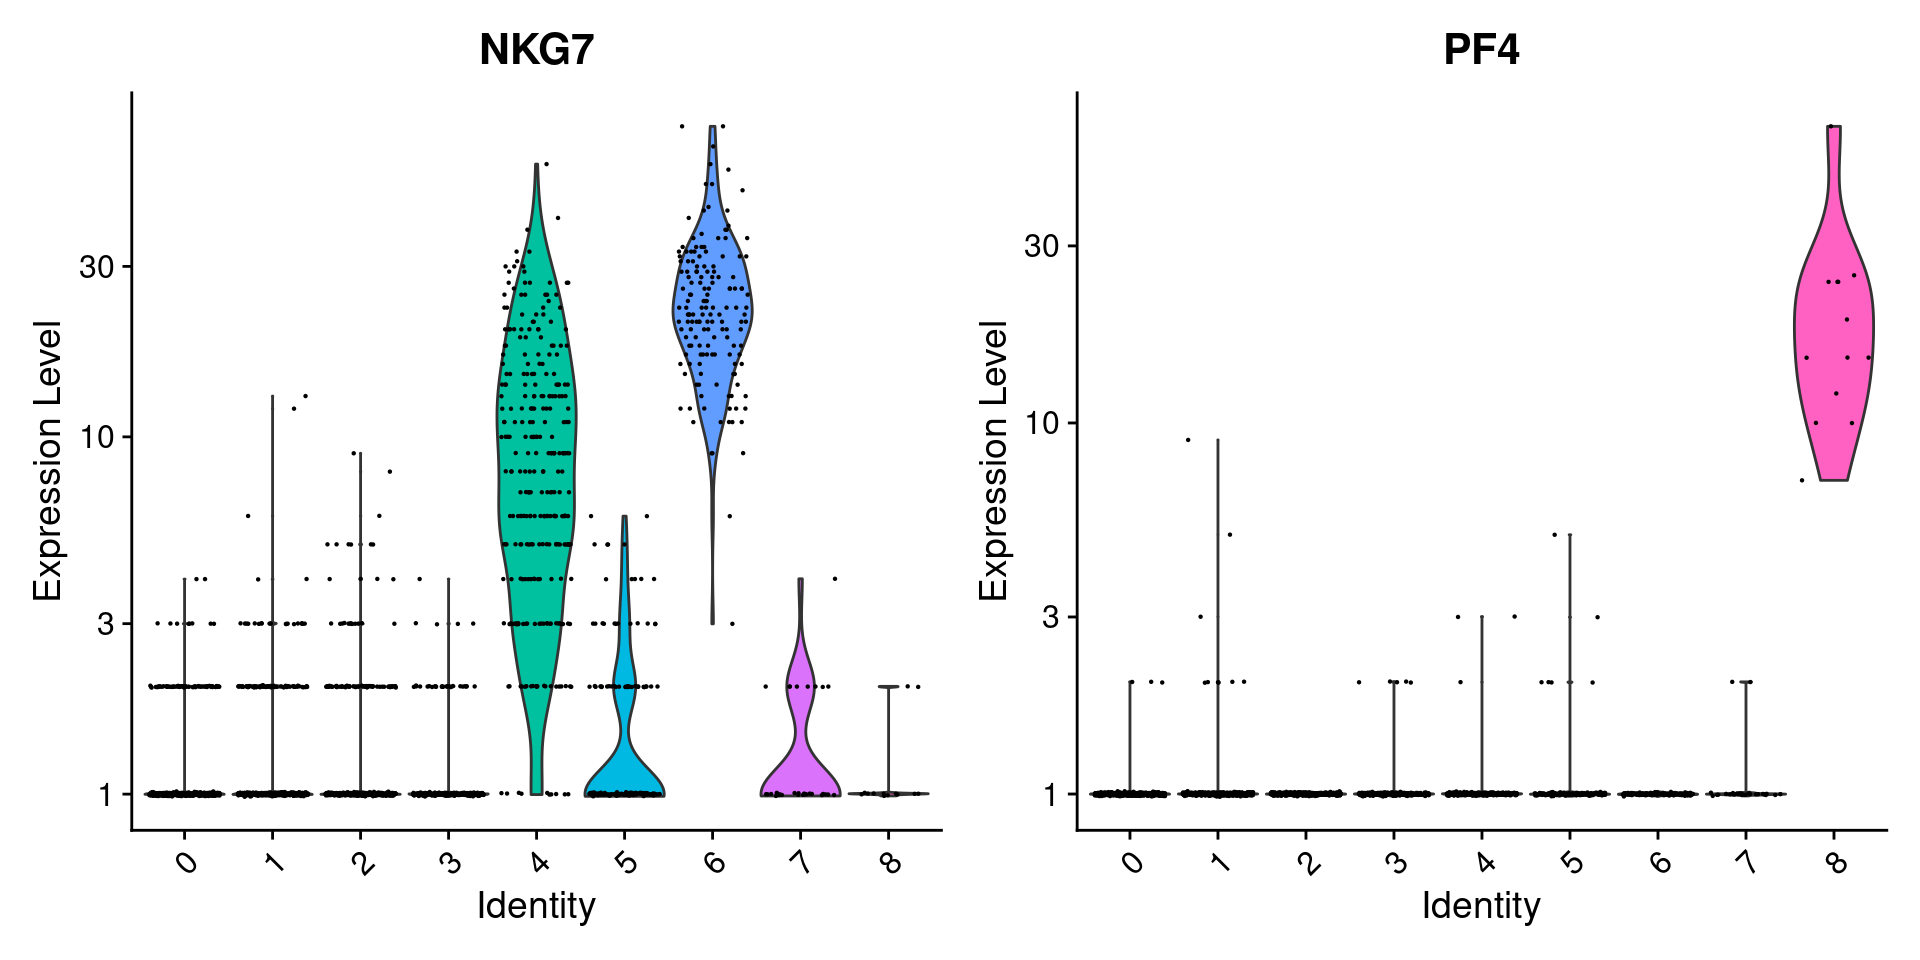
VlnPlot(pbmc, features = c("MS4A1", "CD79A"))

#可以拿count数据画VlnPlot(pbmc, features = c("NKG7", "PF4"), slot = "counts", log = TRUE)
在umap图上标记FeaturePlot(pbmc, features = c("MS4A1", "GNLY", "CD3E", "CD14", "FCER1A", "FCGR3A", "LYZ", "PPBP", "CD8A"))
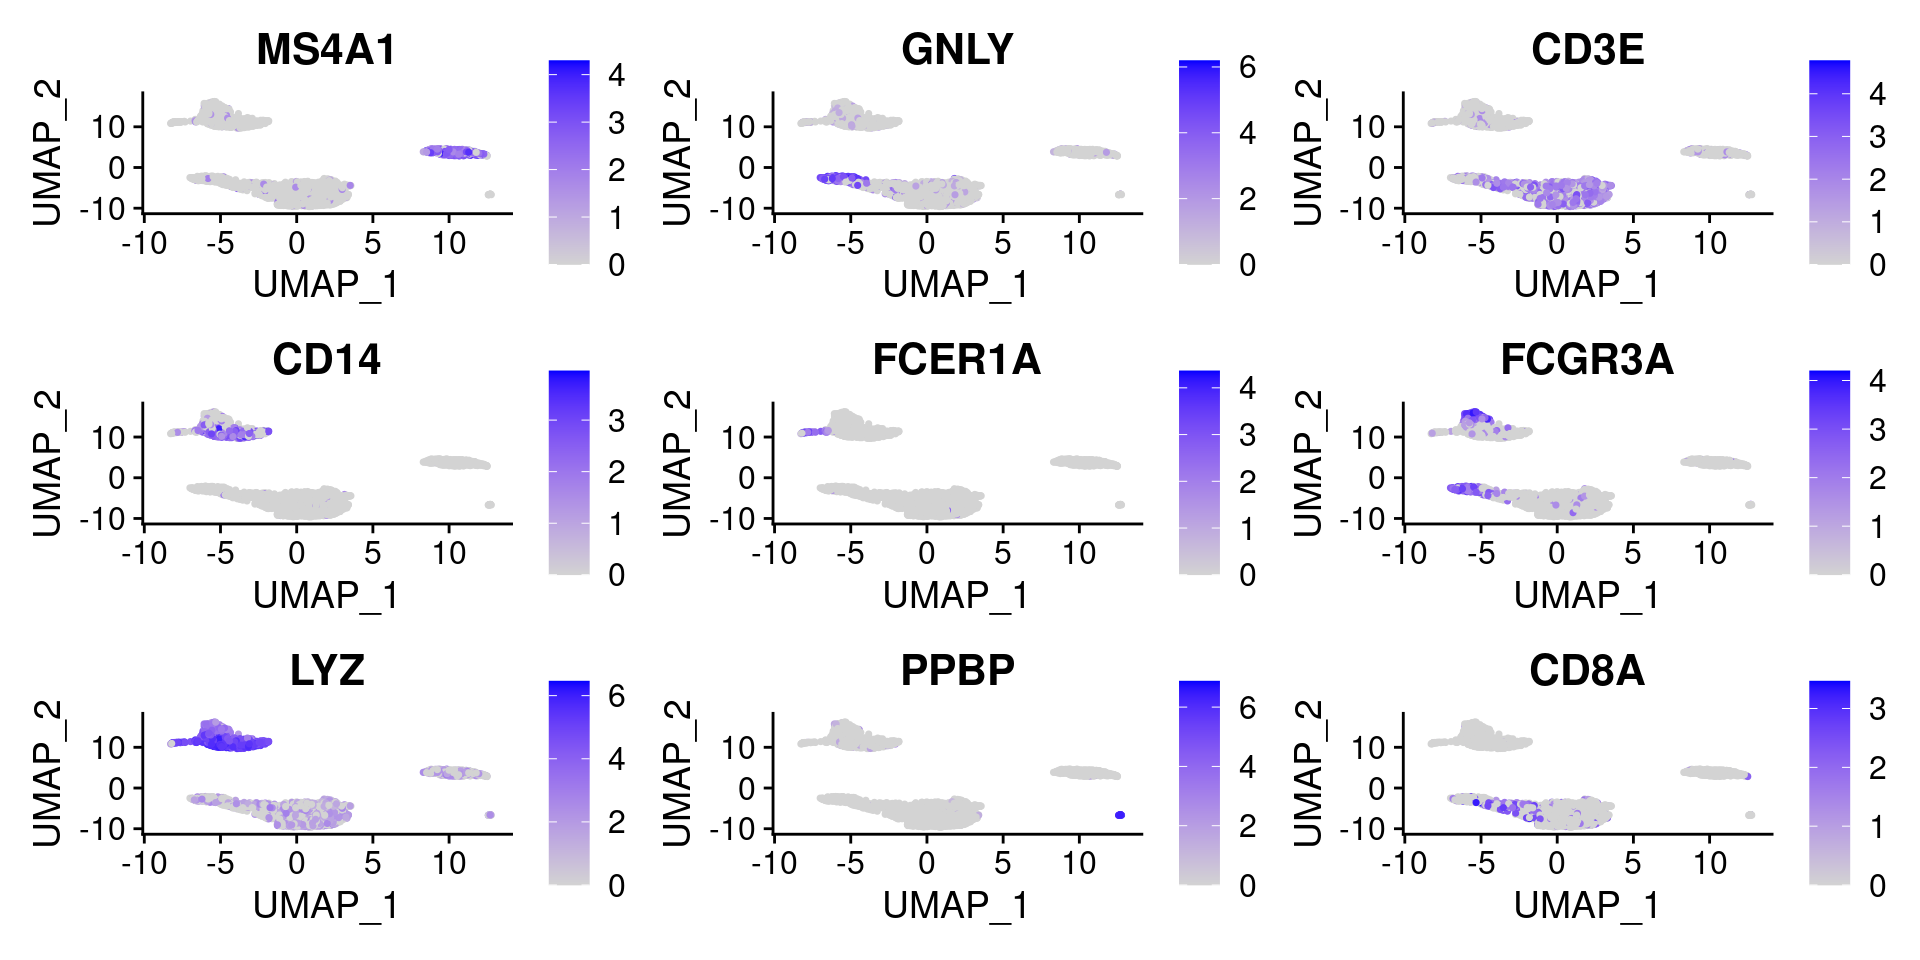
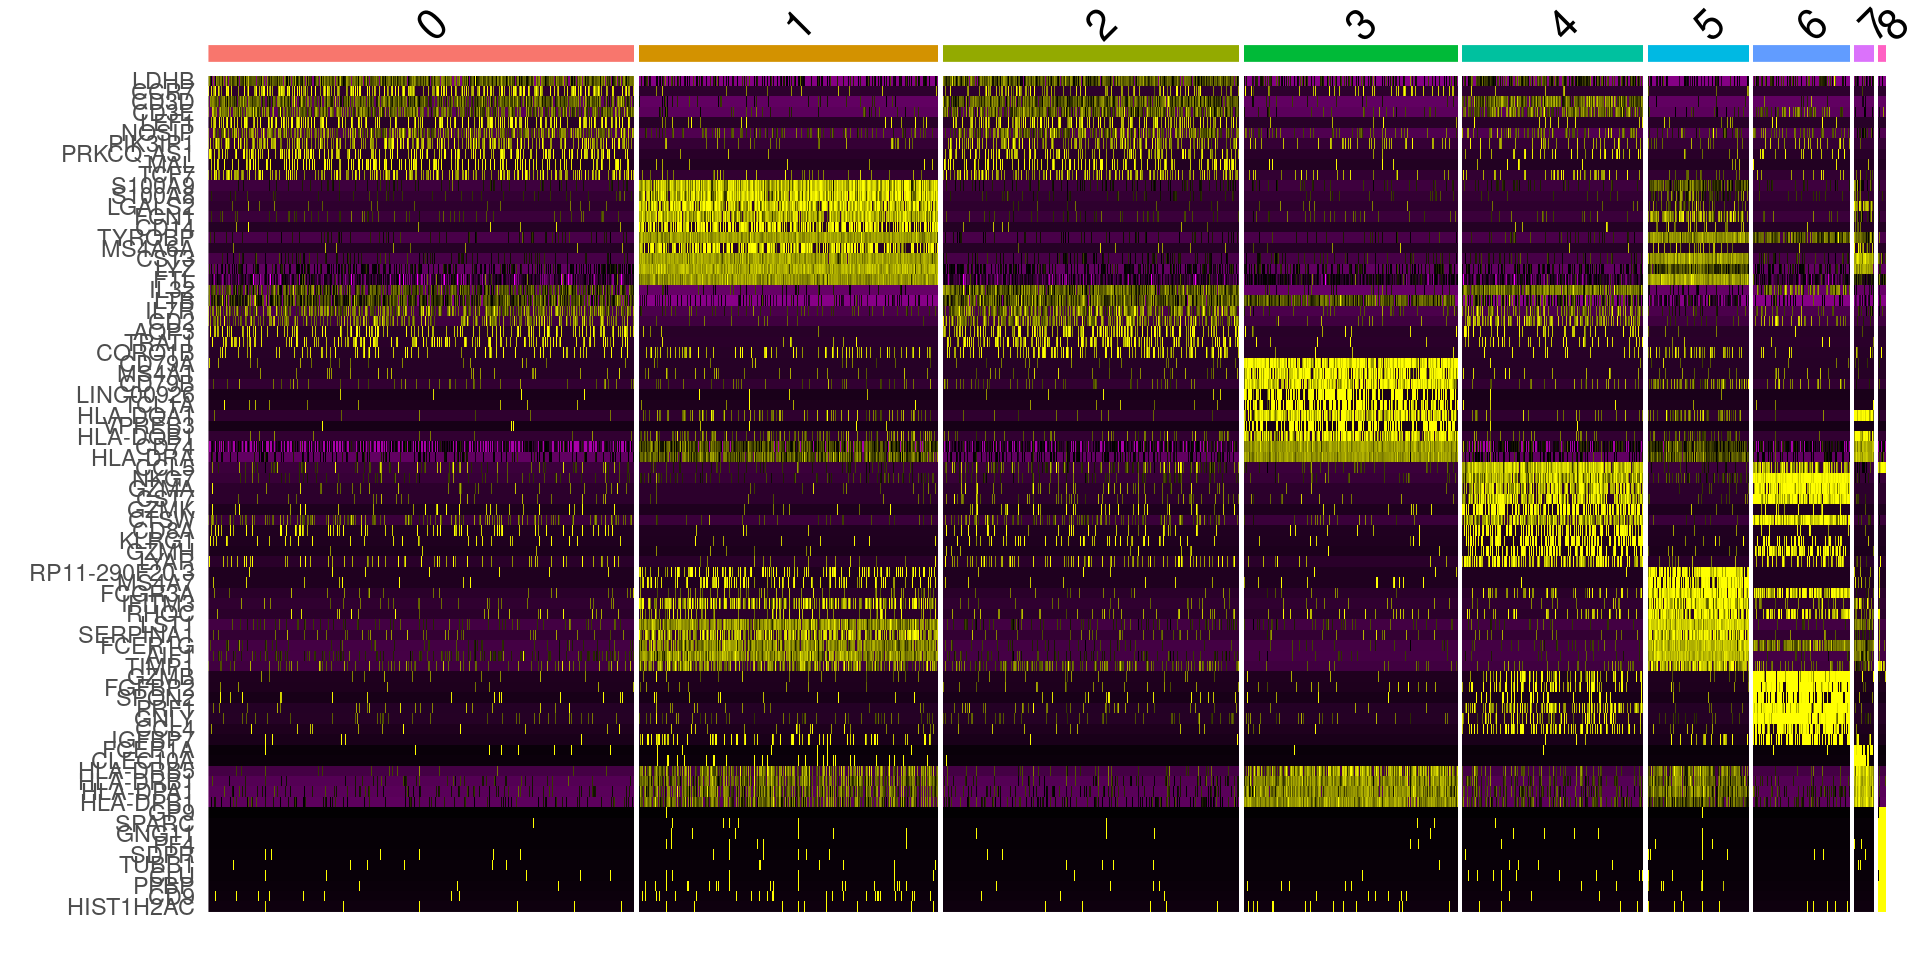
##把每簇里面logfc排名前10的基因挑出来top10 <- pbmc.markers %>% group_by(cluster) %>% top_n(n = 10, wt = avg_log2FC)
6.2 marker基因的热图
DoHeatmap(pbmc, features = top10$gene) + NoLegend()
7. 根据marker基因确定细胞
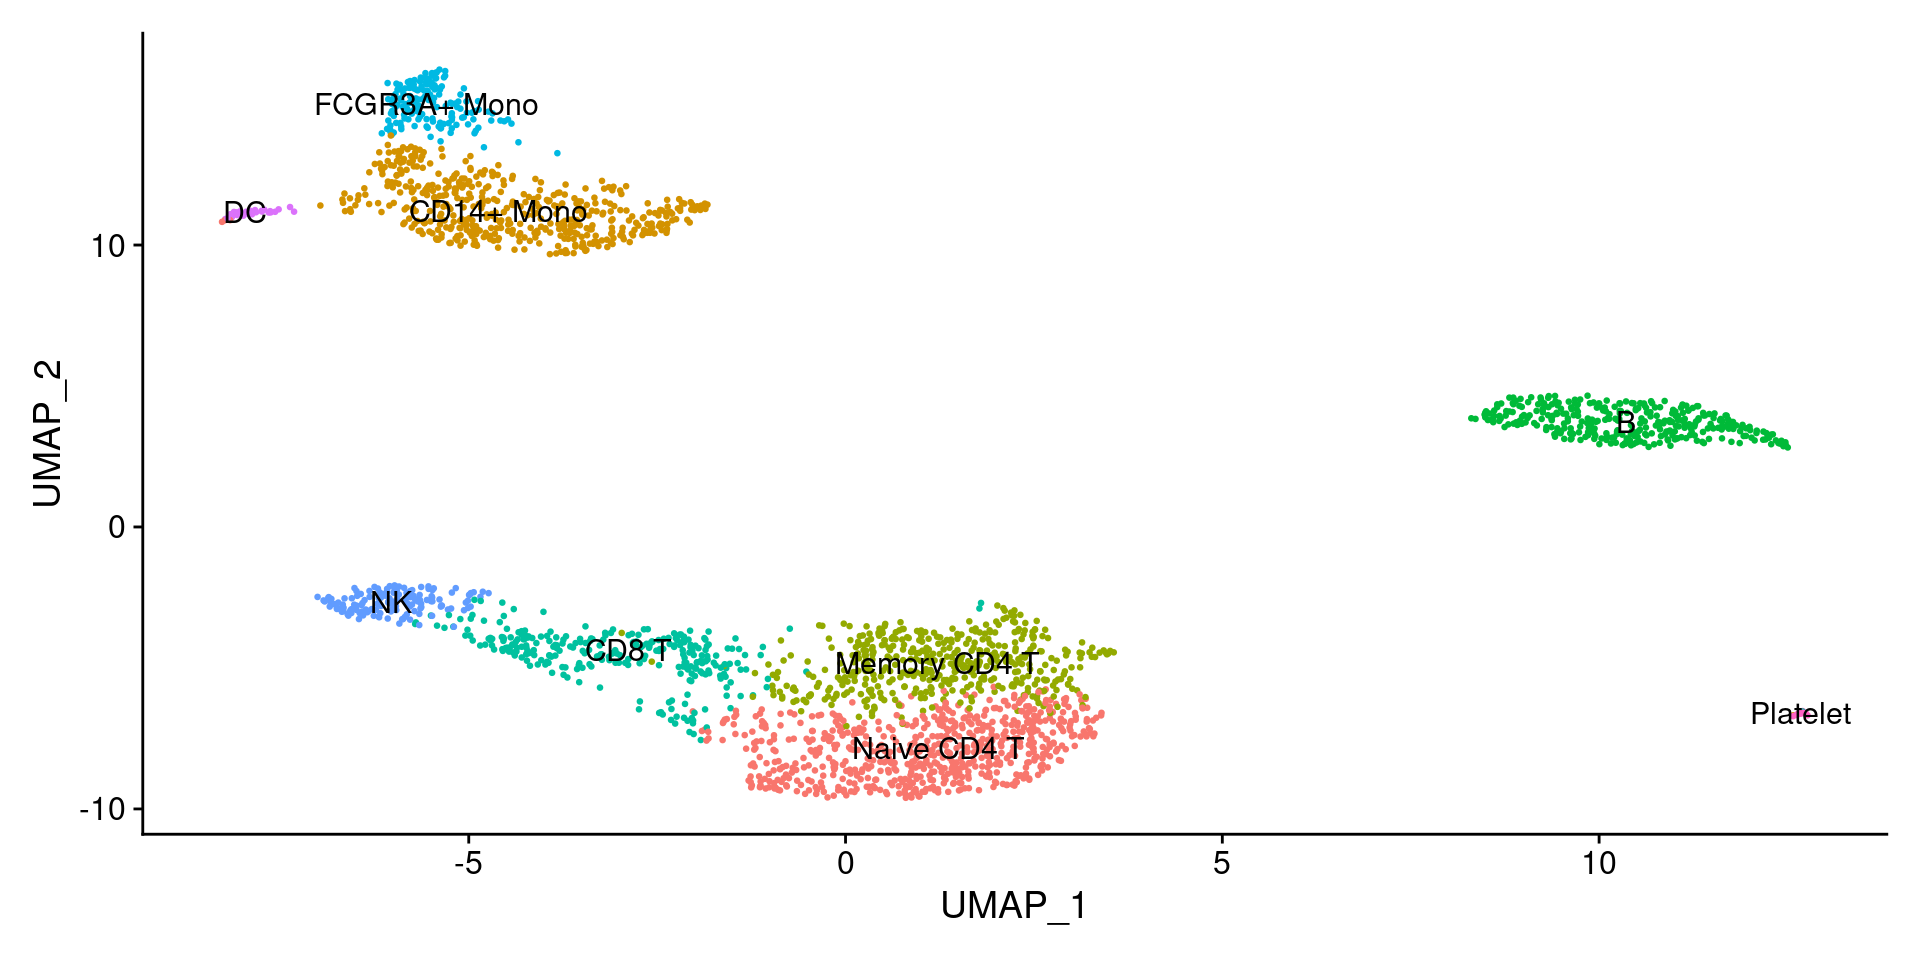
###每一种细胞都是有几个基因高表达是什么细胞,直接手动写new.cluster.ids <- c("Naive CD4 T","CD14+ Mono","Memory CD4 T","B","CD8 T","FCGR3A+ Mono","NK","DC","Platelet")names(new.cluster.ids) <- levels(pbmc)pbmc <- RenameIdents(pbmc, new.cluster.ids)DimPlot(pbmc,reduction = "umap",label = TRUE,pt.size = 0.5) + NoLegend()
GSE67980
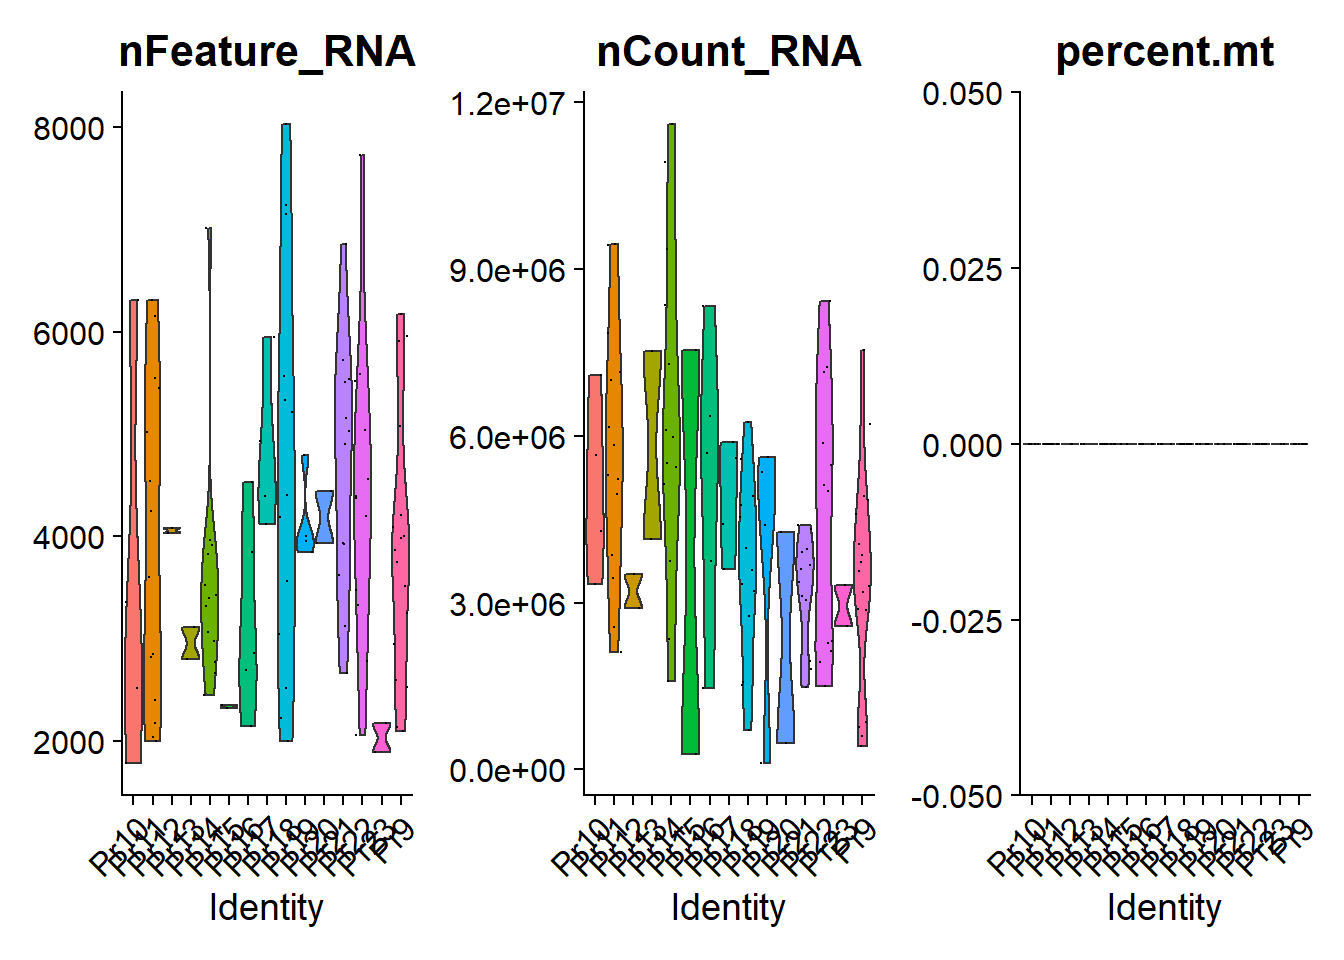
a = read.delim("GSE67980_readCounts.txt.gz")只有pr开头的是细胞colnames(a)## [1] "ID" "Entrez.GeneID" "uniGene" "symbol"## [5] "name" "Pr10.1.2" "Pr10.1.3" "Pr10.2.1"## [9] "Pr11.1.2" "Pr11.2.1" "Pr11.2.3" "Pr12.1.1"## [13] "Pr12.1.2" "Pr13.1.1" "Pr13.1.2" "Pr14.3.2"## [17] "Pr14.3.3" "Pr15.1.2" "Pr16.1.1" "Pr16.1.2"## [21] "Pr16.1.3" "Pr16.1.4" "Pr16.1.6" "Pr18.1.2"## [25] "Pr18.1.3" "Pr18.1.9" "Pr18.2.4" "Pr20.1.2"## [29] "Pr22.1.1" "Pr22.1.3" "Pr9.1.5" "Pr9.1.7"## [33] "Pr9.2.1" "Pr9.2.2" "Pr9.3.2" "Pr9.3.3"## [37] "Pr9.3.4" "Pr9.3.5" "Pr1.1.1" "Pr2.1.1"## [41] "Pr2.1.2" "Pr3.1.2" "Pr4.1.1" "Pr4.1.2"## [45] "Pr5.1.1" "Pr5.1.2" "Pr5.1.3" "Pr6.1.3"## [49] "Pr6.1.4" "Pr8.1.2" "Pr10.2.2" "Pr11.1.1"## [53] "Pr11.2.2" "Pr11.3.1" "Pr11.3.2" "Pr11.3.3"## [57] "Pr11.4.1" "Pr11.4.2" "Pr11.4.3" "Pr11.4.4"## [61] "Pr11.4.5" "Pr11.4.6" "Pr14.1.1" "Pr14.2.1"## [65] "Pr14.2.2" "Pr14.2.3" "Pr14.2.4" "Pr14.2.5"## [69] "Pr14.2.6" "Pr14.3.1" "Pr14.3.4" "Pr14.3.5"## [73] "Pr14.3.6" "Pr15.1.1" "Pr17.1.1" "Pr17.1.2"## [77] "Pr17.2.1" "Pr17.2.2" "Pr9.1.1" "Pr9.1.2"## [81] "Pr9.1.3" "Pr9.1.4" "Pr9.1.6" "Pr9.3.1"## [85] "Pr9.3.6" "Pr9.3.7" "Pr9.3.8" "Pr18.1.1"## [89] "Pr18.1.4" "Pr18.1.5" "Pr18.1.6" "Pr18.1.7"## [93] "Pr18.1.8" "Pr18.2.1" "Pr18.2.2" "Pr18.2.3"## [97] "Pr19.1.2" "Pr19.1.3" "Pr19.1.4" "Pr19.1.5"## [101] "Pr20.1.1" "Pr21.1.1" "Pr21.1.10" "Pr21.1.11"## [105] "Pr21.1.12" "Pr21.1.2" "Pr21.1.3" "Pr21.1.4"## [109] "Pr21.1.5" "Pr21.1.6" "Pr21.1.7" "Pr21.1.8"## [113] "Pr21.1.9" "Pr22.1.10" "Pr22.1.11" "Pr22.1.12"## [117] "Pr22.1.2" "Pr22.1.4" "Pr22.1.5" "Pr22.1.6"## [121] "Pr22.1.7" "Pr22.1.8" "Pr22.1.9" "Pr3.1.1"## [125] "Pr6.1.1" "Pr6.1.2" "Pr6.1.5" "PriTum1"## [129] "PriTum2" "PriTum3" "PriTum4" "PriTum10"## [133] "PriTum11" "PriTum12" "PriTum5" "PriTum6"## [137] "PriTum7" "PriTum8" "PriTum9" "DU145.1"## [141] "DU145.2" "DU145.3" "DU145.4" "DU145.5"## [145] "LNCaP.1" "LNCaP.2" "LNCaP.3" "LNCaP.4"## [149] "LNCaP.5" "LNCaP.D.1" "LNCaP.D.2" "LNCaP.D.3"## [153] "LNCaP.D.4" "LNCaP.D.5" "LNCaP.R.1" "LNCaP.R.2"## [157] "LNCaP.R.3" "LNCaP.R.4" "LNCaP.R.5" "PC3.1"## [161] "PC3.2" "PC3.3" "PC3.4" "PC3.5"## [165] "VCaP.1" "VCaP.2" "VCaP.3" "VCaP.4"## [169] "VCaP.5" "Pr23.1.w1" "Pr23.1.w2" "HD1.1.w1"## [173] "HD1.1.w2" "HD1.1.w3"b = rio::import("GSE67980_sampleProperties.txt.gz")b = b[b$characteristics..donor.type=="CRPC",]table(b$characteristics..donor)#### Pr10 Pr11 Pr12 Pr13 Pr14 Pr15 Pr16 Pr17 Pr18 Pr19 Pr20 Pr21 Pr22 Pr23 Pr9## 4 14 2 2 13 2 5 4 13 4 2 12 12 2 17a = a[a$symbol!="",]a = a[!duplicated(a$symbol),]a2 = a[,b$title]rownames(a2) = a$symbolrownames(b) = b$titlelibrary(Seurat)a2就是整理好的表达矩阵了,要加上临床信息bpbmc <- CreateSeuratObject(counts = a2,meta.data = b,project = "a",min.cells = 3,min.features = 50)exp = pbmc[["RNA"]]@counts;dim(exp)## [1] 14798 108exp[1:4,1:4]## 4 x 4 sparse Matrix of class "dgCMatrix"## Pr10.1.2 Pr10.1.3 Pr10.2.1 Pr11.1.2## A1BG . . . .## ADA . . . .## CDH2 . . . .## AKT3 1 . . .pbmc[["percent.mt"]] <- PercentageFeatureSet(pbmc, pattern = "^MT-")head(pbmc@meta.data, 3)## orig.ident nCount_RNA nFeature_RNA title source.name## Pr10.1.2 a 3338244 2517 Pr10.1.2 candidate PCa CTC## Pr10.1.3 a 4291749 1776 Pr10.1.3 candidate PCa CTC## Pr10.2.1 a 7100153 3353 Pr10.2.1 candidate PCa CTC## organism characteristics..donor characteristics..donor.type## Pr10.1.2 Homo sapiens Pr10 CRPC## Pr10.1.3 Homo sapiens Pr10 CRPC## Pr10.2.1 Homo sapiens Pr10 CRPC## characteristics..enzalutamide molecule percent.mt## Pr10.1.2 single cell in lysis buffer 0## Pr10.1.3 single cell in lysis buffer 0## Pr10.2.1 single cell in lysis buffer 0VlnPlot(pbmc, group.by= "characteristics..donor",features = c("nFeature_RNA","nCount_RNA","percent.mt"),ncol = 3)
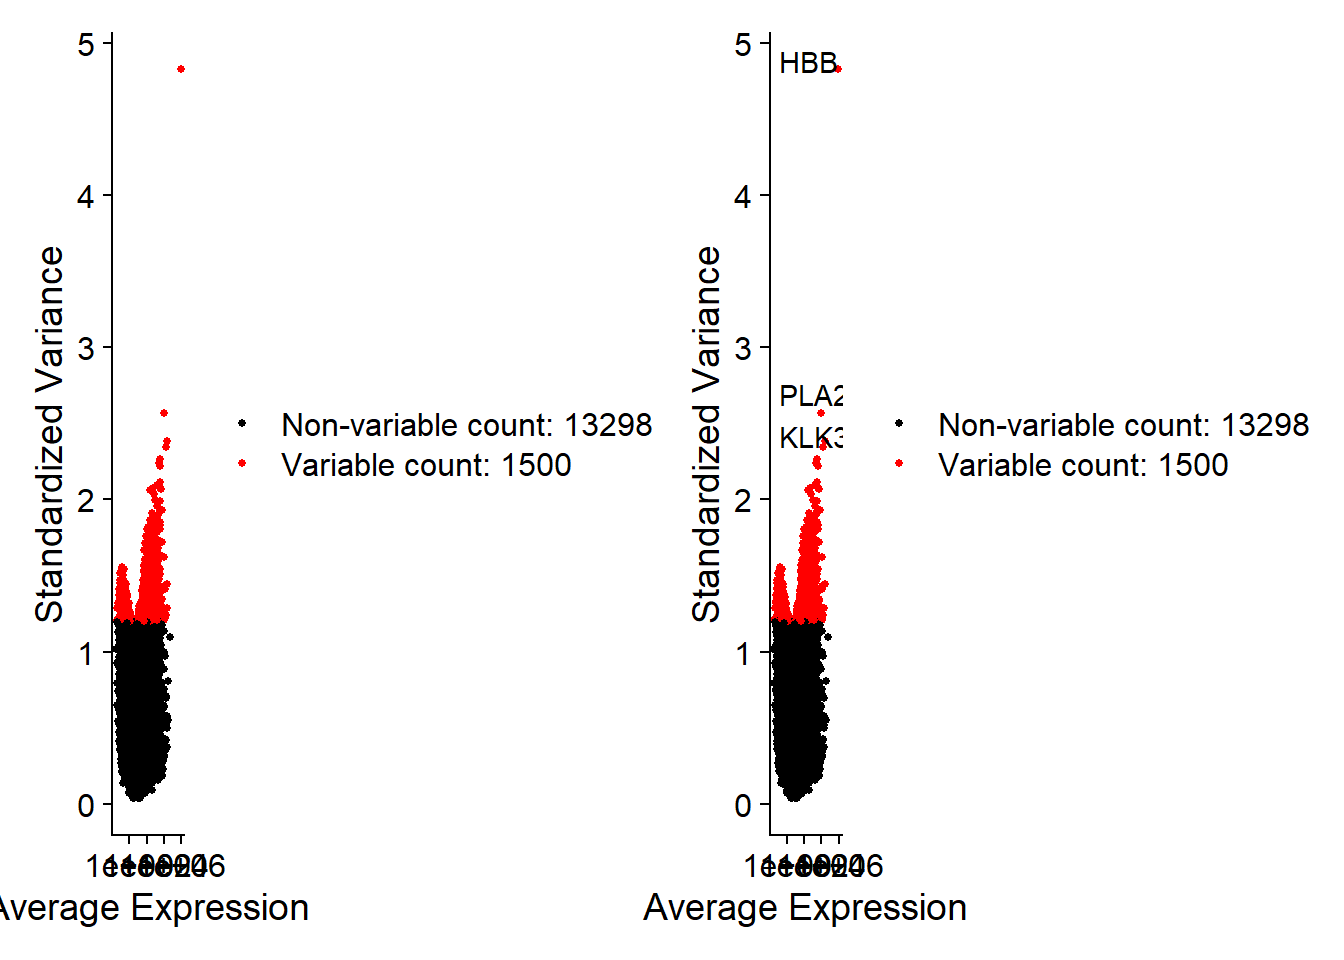
pbmc <- NormalizeData(pbmc)pbmc@assays$RNA[30:34,1:3]## 5 x 3 sparse Matrix of class "dgCMatrix"## Pr10.1.2 Pr10.1.3 Pr10.2.1## HOTAIR . . .## ZGLP1 . . .## FAM86JP . . .## GHRLOS . . .## LOC100128164 . . .# 有三种算法:vst、mean.var.plot、dispersion;默认选择2000个HVGpbmc <- FindVariableFeatures(pbmc,nfeatures = 1500)top10 <- head(VariableFeatures(pbmc), 10);top10## [1] "HBB" "PLA2G2A" "KLK3" "PPBP" "ANXA11" "LUZP6" "PDLIM1"## [8] "RAB11A" "TSC22D1" "TOX4"plot1 <- VariableFeaturePlot(pbmc)plot2 <- LabelPoints(plot = plot1,points = top10,repel = TRUE)plot1 + plot2
### 标准化和降维all.genes <- rownames(pbmc)pbmc <- ScaleData(pbmc, features = all.genes)pbmc <- RunPCA(pbmc, features = VariableFeatures(object = pbmc))print(pbmc[["pca"]], dims = 1:2, nfeatures = 5)## PC_ 1## Positive: HBB, PF4, NRGN, ALAS2, PPBP## Negative: KLK3, AR, DENND4B, CCDC14, RCE1## PC_ 2## Positive: CX3CR1, RAB7L1, TFAP4, GZMB, PTGER2## Negative: FTH1, NLRP9, SLCO1B3, ZNF70, TSR1VizDimLoadings(pbmc, dims = 1:2, reduction = "pca")
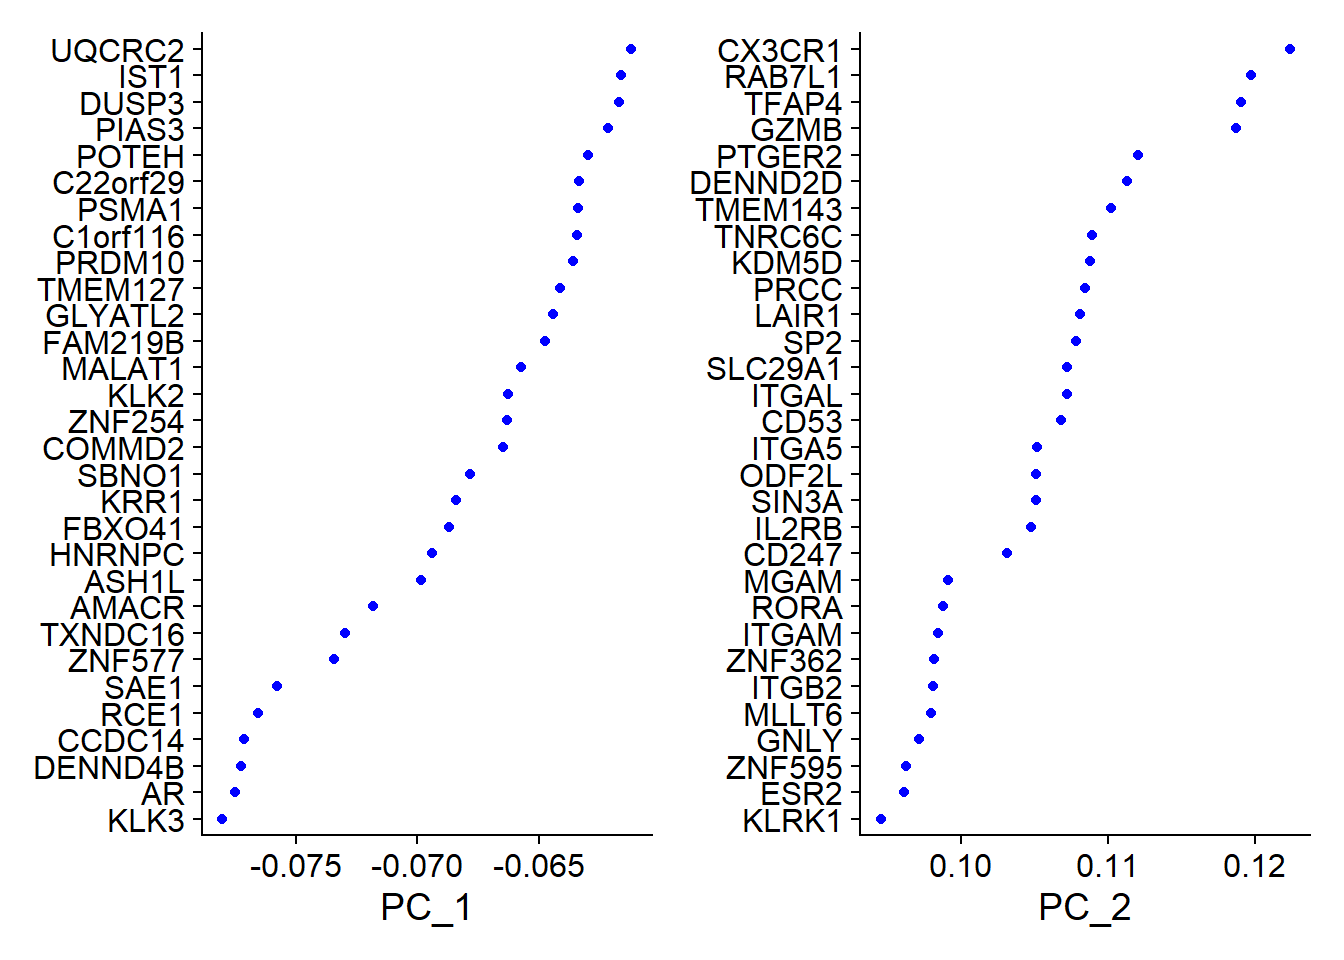
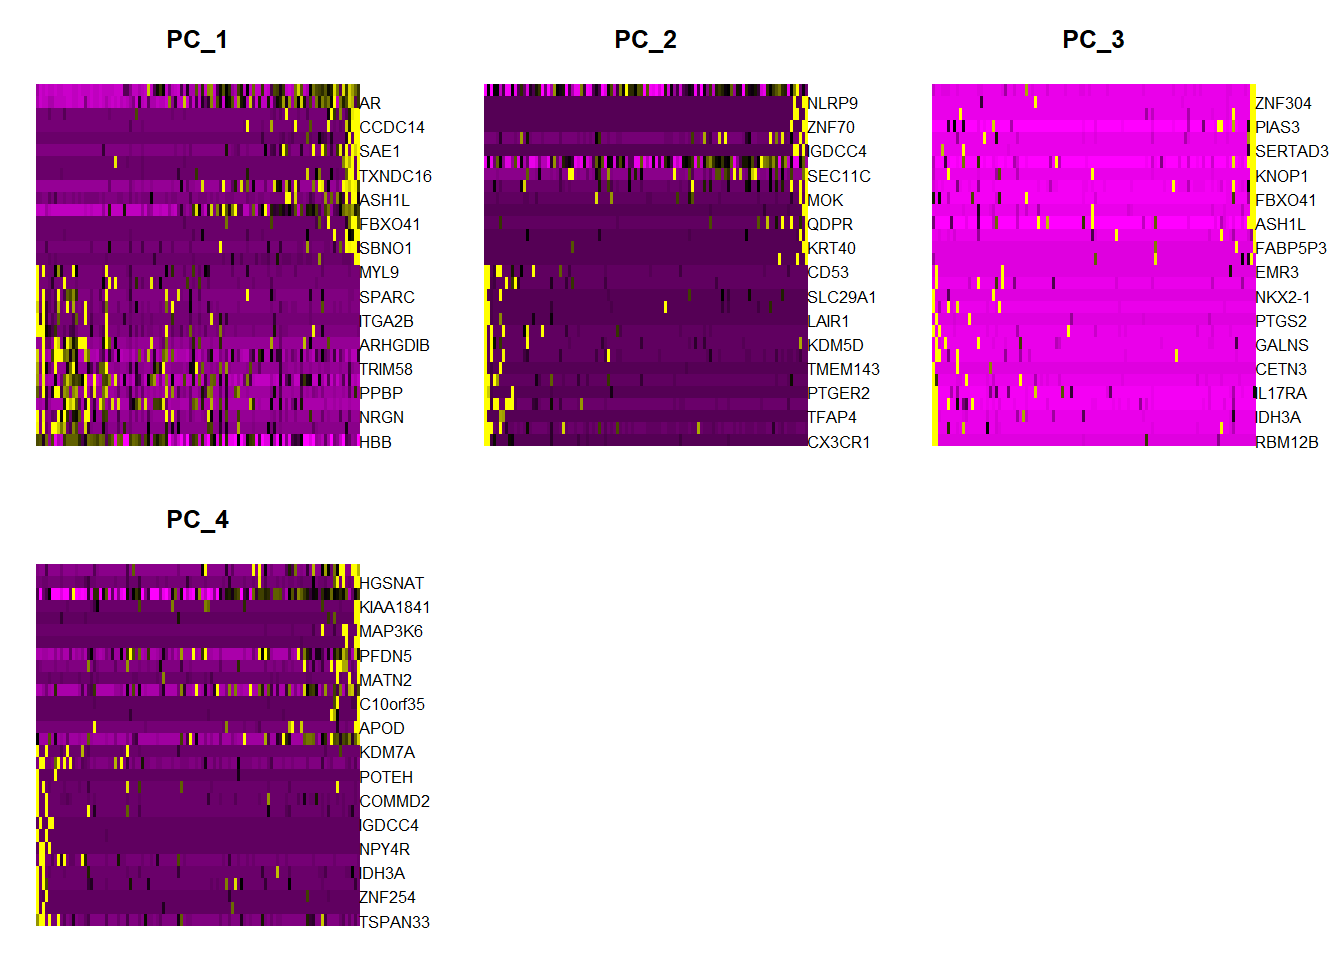
#每个主成分对应基因的热图DimHeatmap(pbmc, dims = 1:4, balanced = TRUE)
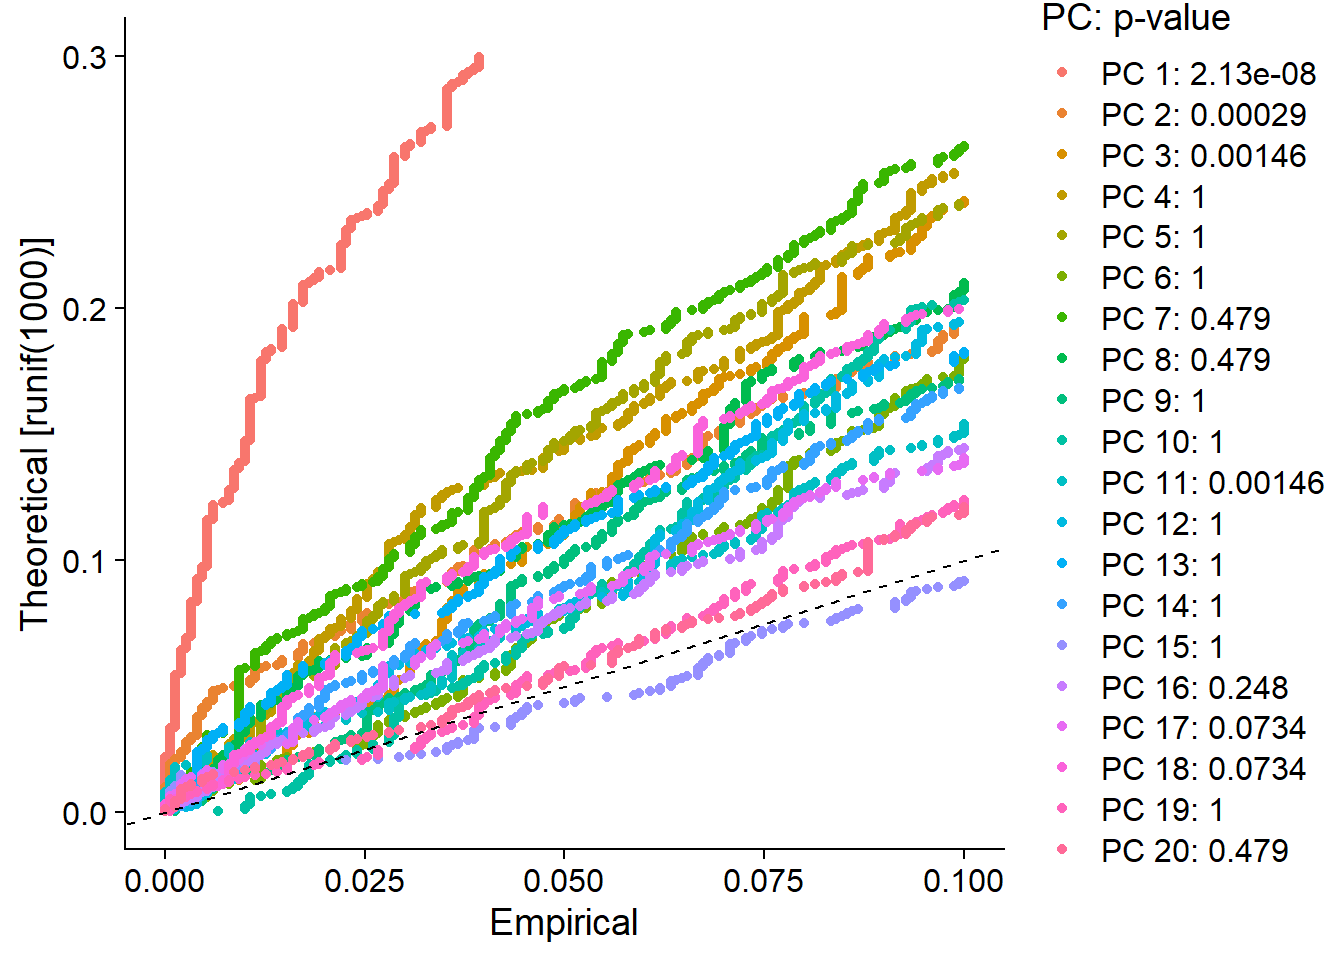
# 应该选多少个主成分进行后续分析pbmc <- JackStraw(pbmc, num.replicate = 100)pbmc <- ScoreJackStraw(pbmc, dims = 1:20)JackStrawPlot(pbmc, dims = 1:20)
ElbowPlot(pbmc)
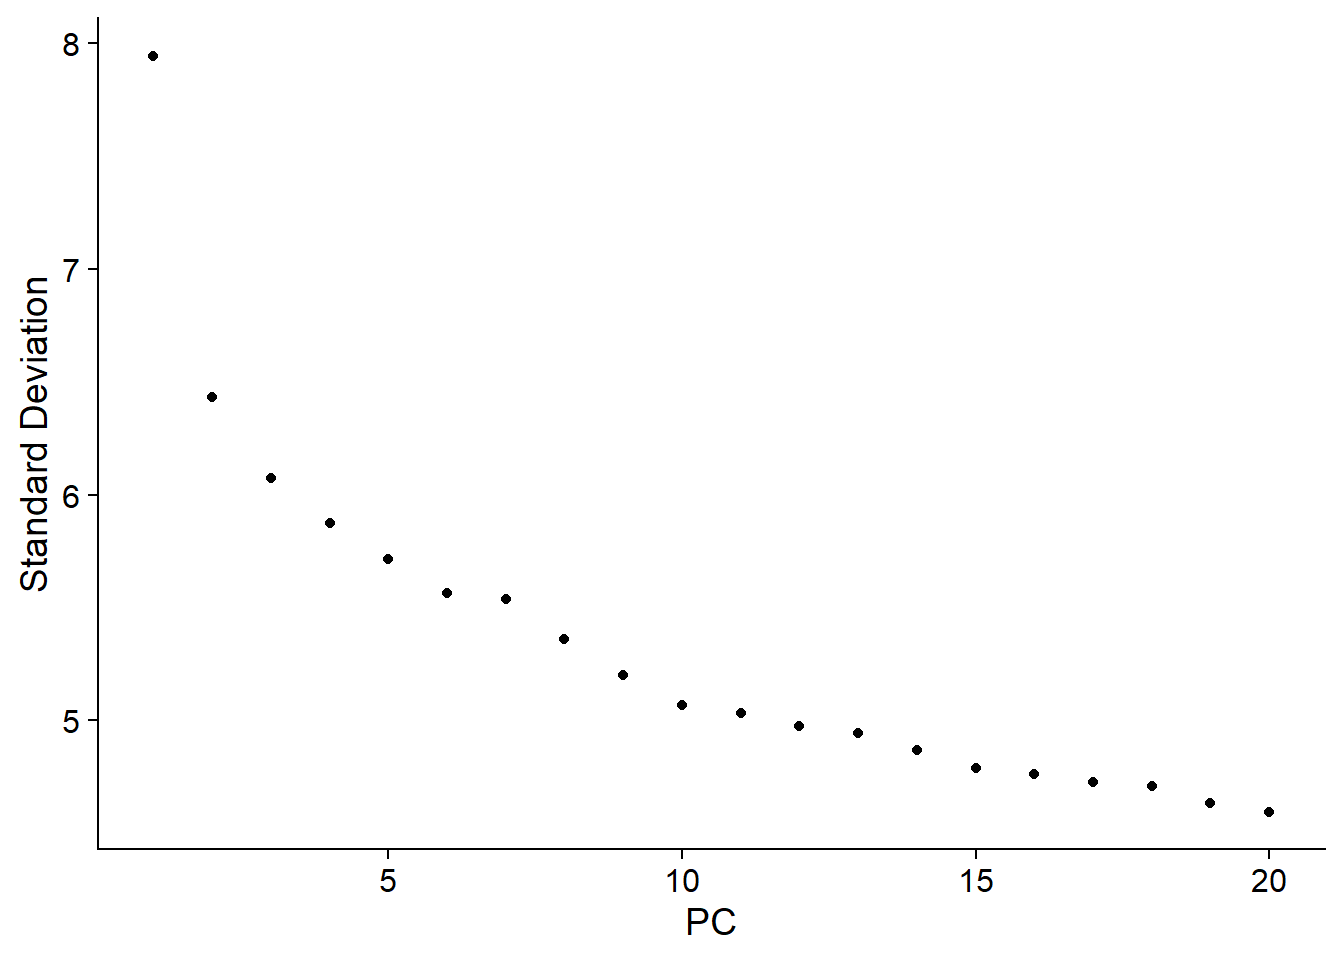
pbmc <- FindNeighbors(pbmc, dims = c(1:3,11))pbmc <- FindClusters(pbmc, resolution = 0.5) #分辨率## Modularity Optimizer version 1.3.0 by Ludo Waltman and Nees Jan van Eck#### Number of nodes: 108## Number of edges: 2817#### Running Louvain algorithm...## Maximum modularity in 10 random starts: 0.6789## Number of communities: 2## Elapsed time: 0 seconds# 结果聚成几类,用Idents查看length(levels(Idents(pbmc)))## [1] 2pbmc <- RunTSNE(pbmc, dims = c(1:3,11))DimPlot(pbmc,reduction = "tsne")
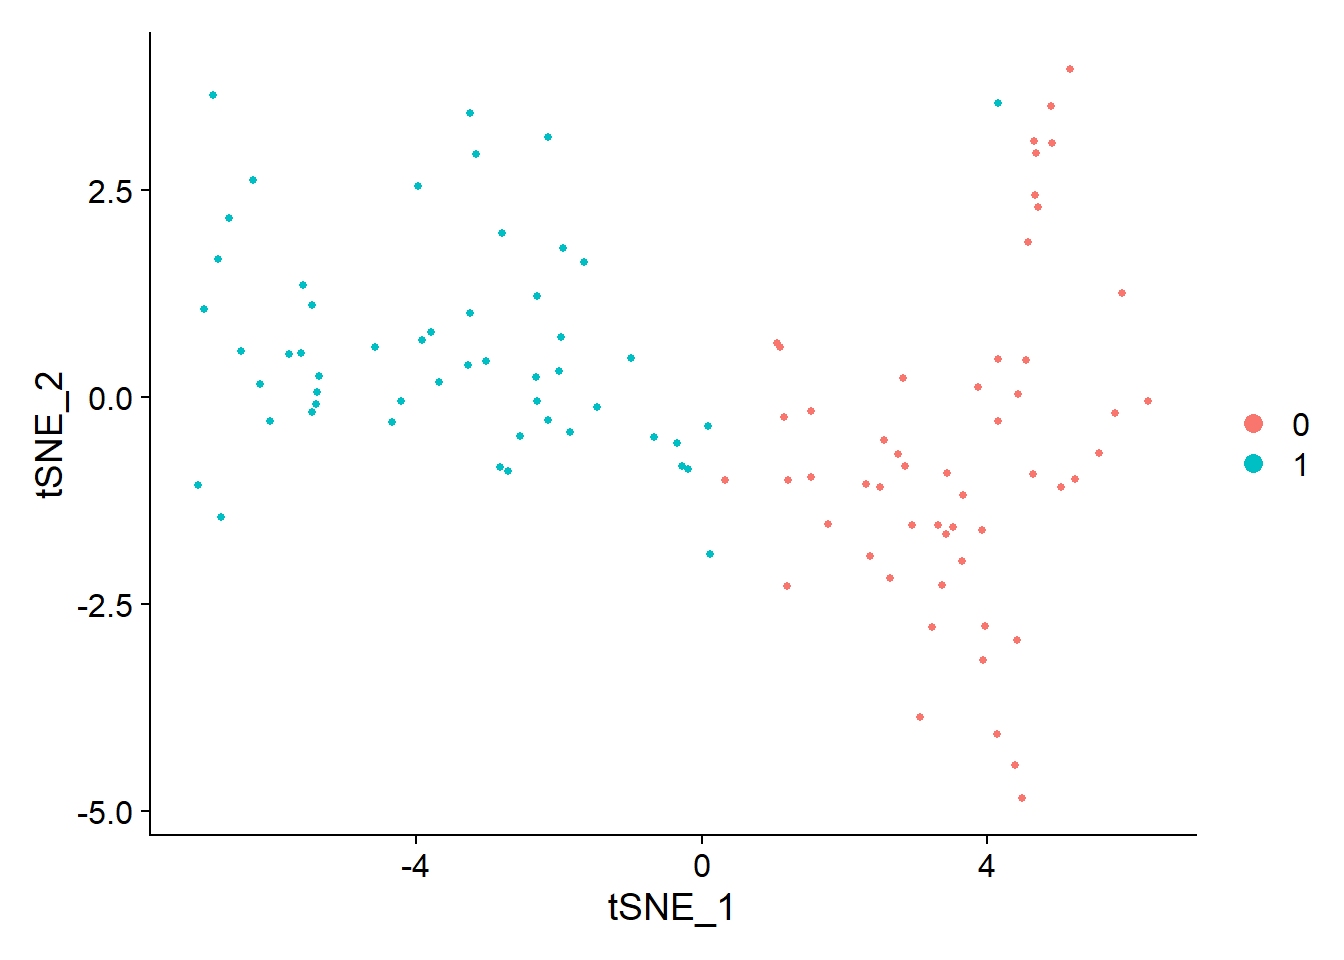
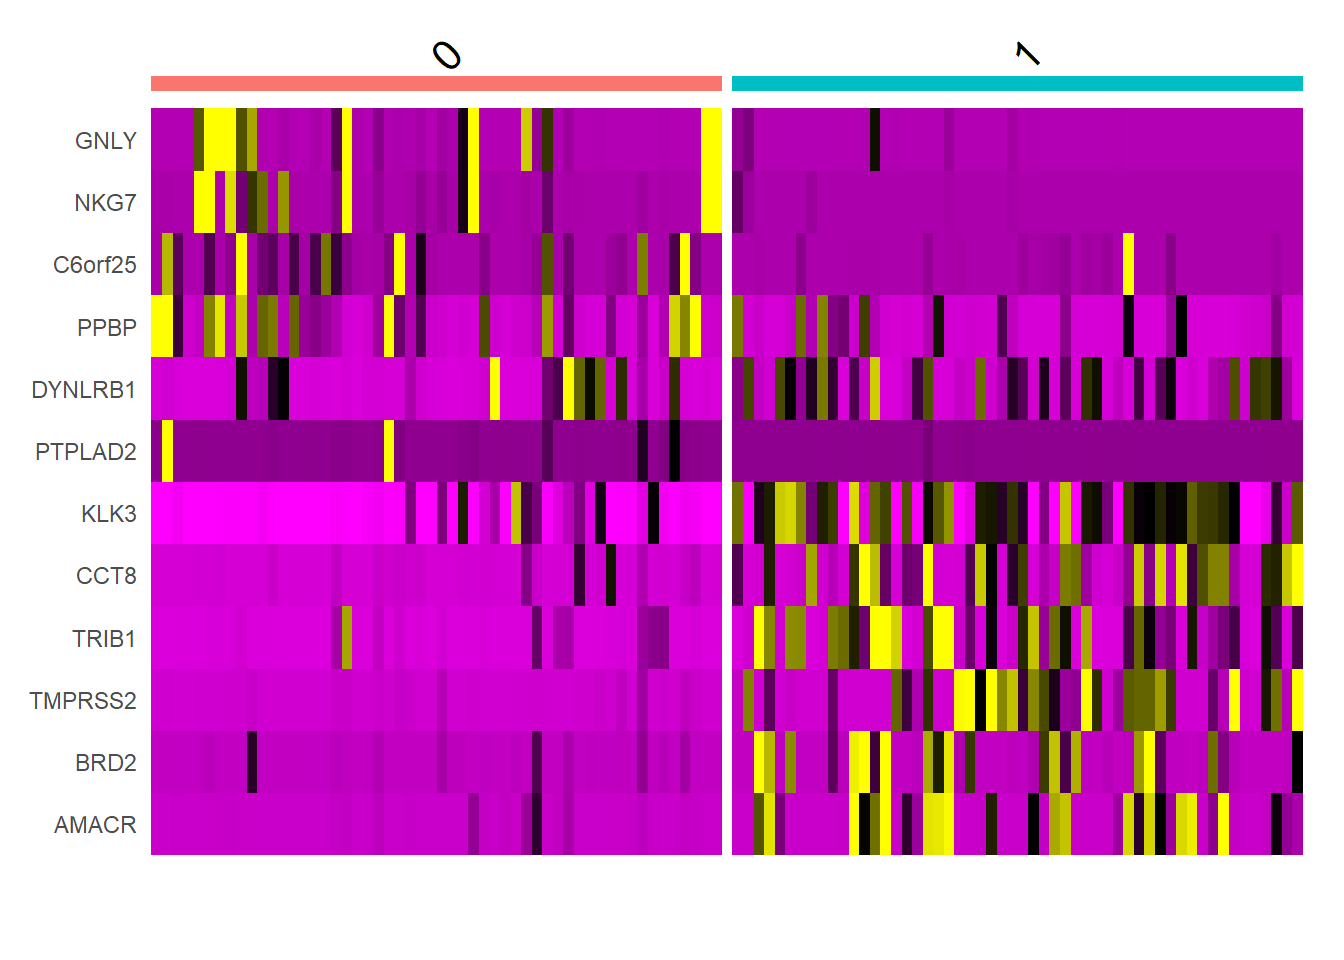
library(tidyverse)pbmc.markers <- FindAllMarkers(pbmc, only.pos = TRUE, min.pct = 0.25, logfc.threshold = 0.25)pbmc.markers %>% group_by(cluster) %>% top_n(n = 2, wt = avg_log2FC)## # A tibble: 4 x 7## # Groups: cluster [2]## p_val avg_log2FC pct.1 pct.2 p_val_adj cluster gene## <dbl> <dbl> <dbl> <dbl> <dbl> <fct> <chr>## 1 0.00000110 4.26 0.889 0.537 0.0163 0 GNLY## 2 0.00206 4.40 0.944 0.963 1 0 DYNLRB1## 3 0.0000000162 3.04 0.963 0.796 0.000239 1 TRIB1## 4 0.000142 3.35 0.741 0.611 1 1 AMACRtop6 <- pbmc.markers %>% group_by(cluster) %>% top_n(n = 6, wt = avg_log2FC)DoHeatmap(pbmc, features = top6$gene) + NoLegend()
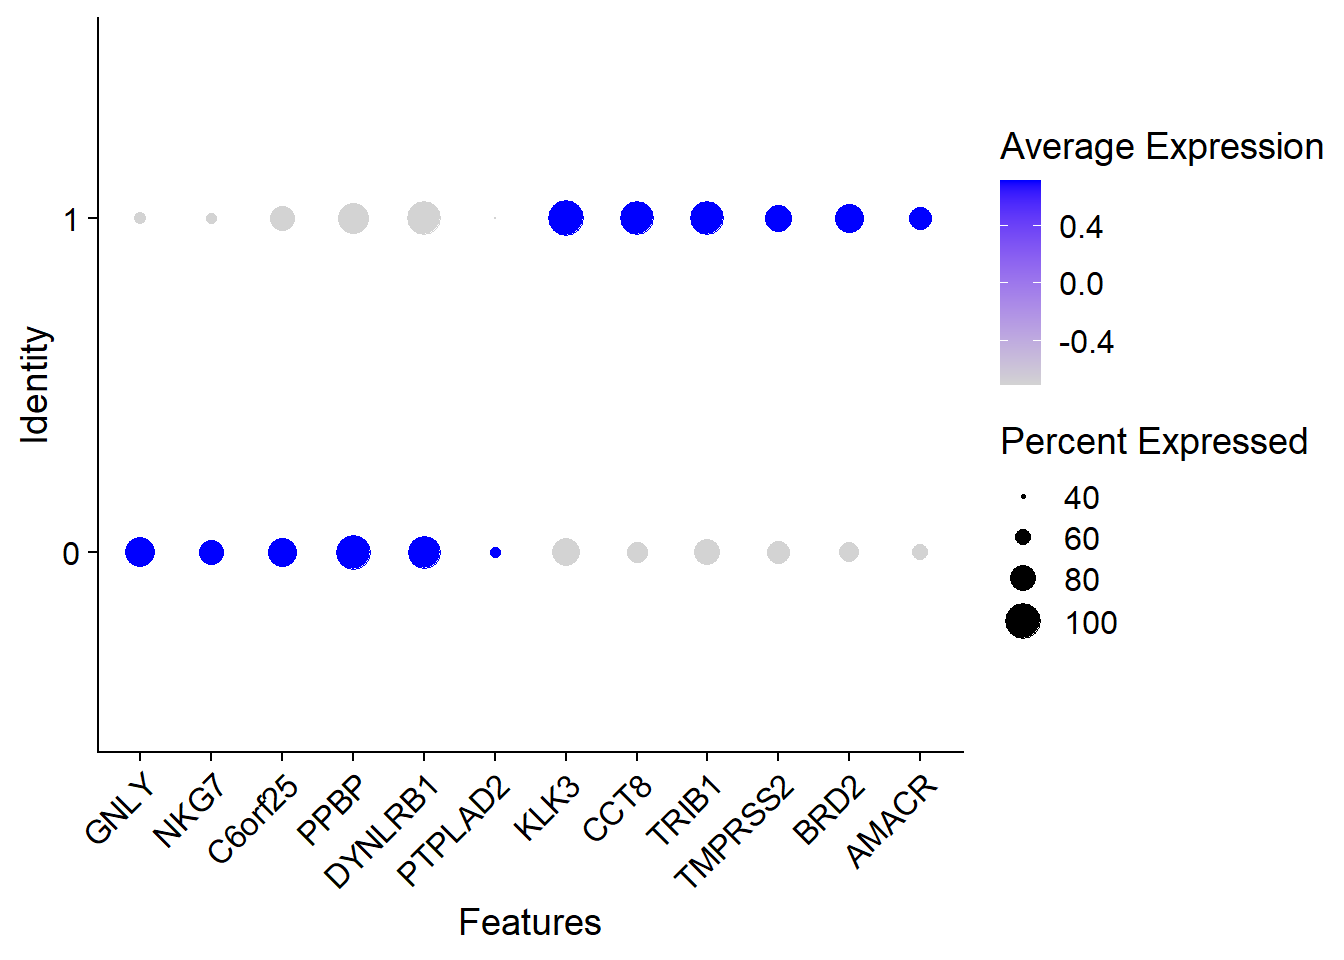
DotPlot(pbmc, features = top6$gene) + RotatedAxis()
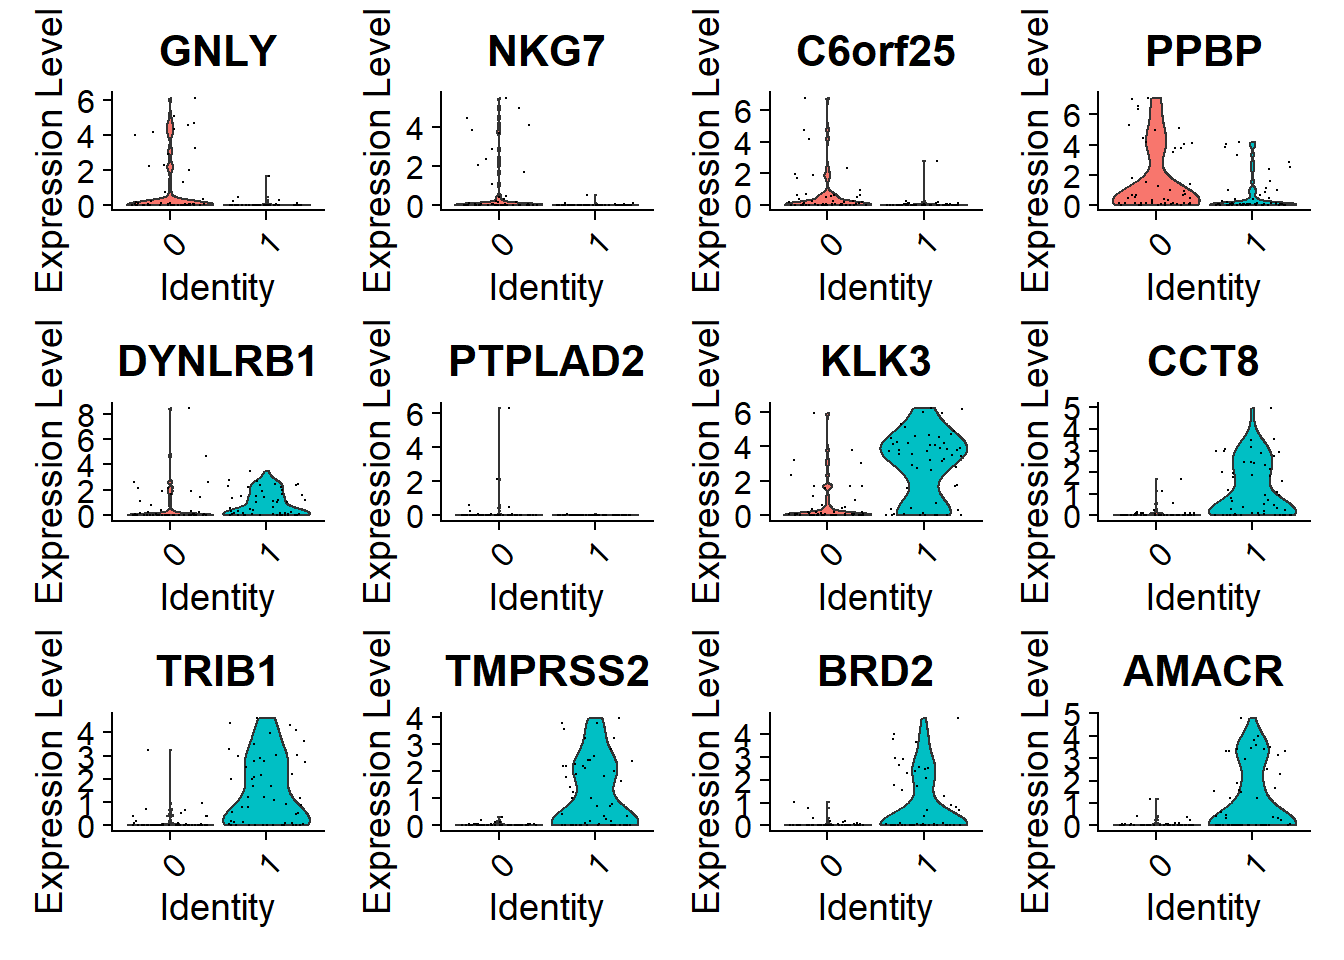
VlnPlot(pbmc, features = top6$gene)
FeaturePlot(pbmc, features = top6$gene,cols = c("green","red"))
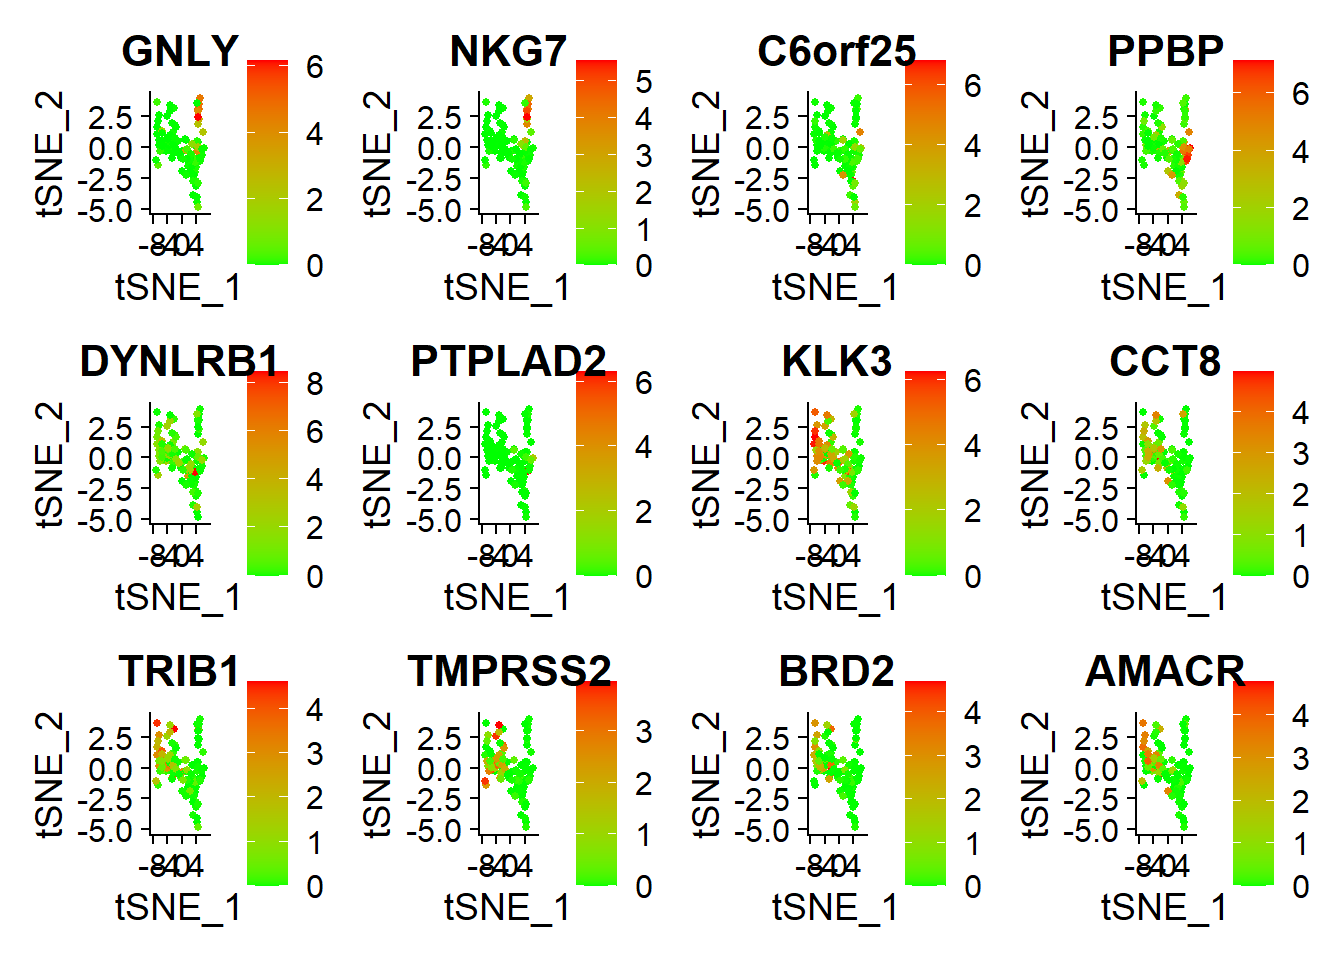 ```
```
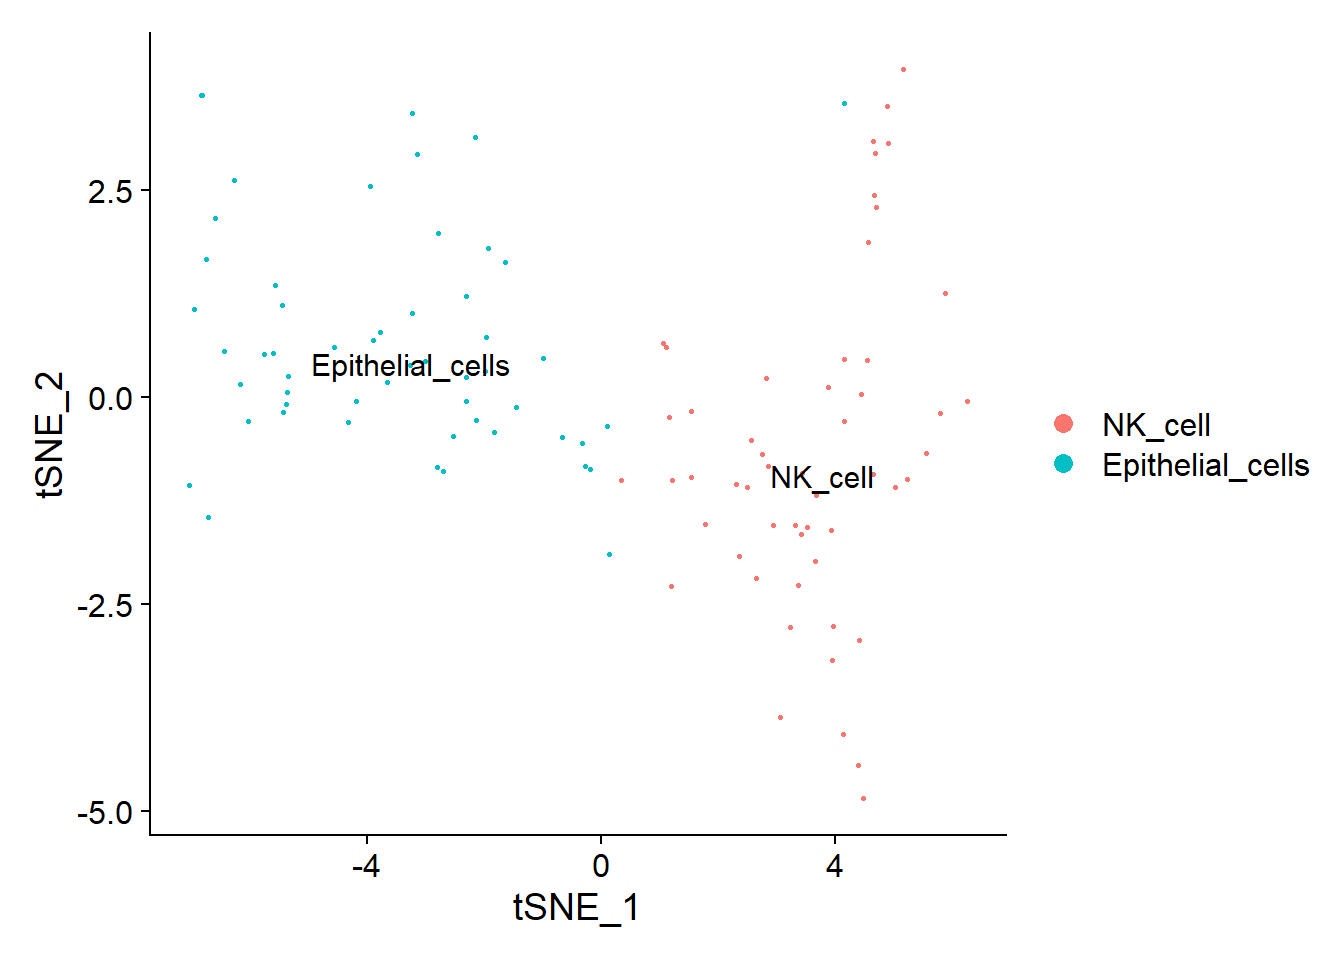
# 注释SingleR可以帮你自己注释免疫细胞,BlueprintEncodeData就是,人和小鼠应该可以做library(celldex)library(SingleR)ref <- BlueprintEncodeData()ref## class: SummarizedExperiment## dim: 19859 259## metadata(0):## assays(1): logcounts## rownames(19859): TSPAN6 TNMD ... LINC00550 GIMAP1-GIMAP5## rowData names(0):## colnames(259): mature.neutrophil## CD14.positive..CD16.negative.classical.monocyte ...## epithelial.cell.of.umbilical.artery.1## dermis.lymphatic.vessel.endothelial.cell.1## colData names(3): label.main label.fine label.ontref <- celldex::HumanPrimaryCellAtlasData()library(BiocParallel)scRNA = pbmcscRNA@assays$RNA@data表达矩阵数据,ref 是参考数据pred.scRNA <- SingleR(test = scRNA@assays$RNA@data,ref = ref,labels = ref$label.main,clusters = scRNA@active.ident)pred.scRNA$pruned.labels## [1] "NK_cell" "Epithelial_cells"#查看注释准确性plotScoreHeatmap(pred.scRNA, clusters=pred.scRNA@rownames, fontsize.row = 9,show_colnames = T)
颜色代表注释准确性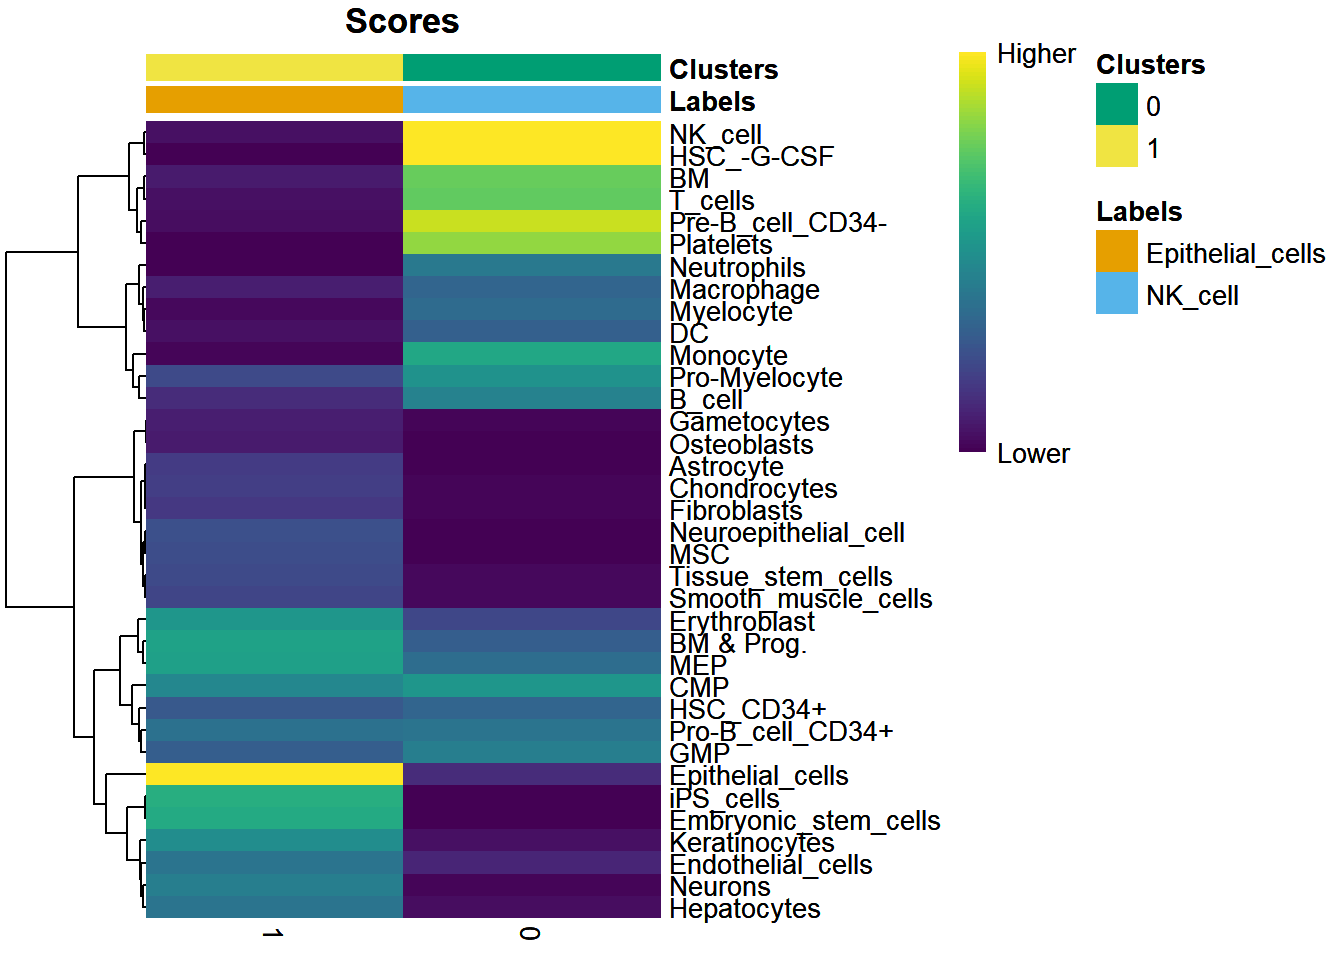
new.cluster.ids <- pred.scRNA$pruned.labelsnames(new.cluster.ids) <- levels(scRNA)levels(scRNA)## [1] "0" "1"scRNA <- RenameIdents(scRNA,new.cluster.ids)levels(scRNA)## [1] "NK_cell" "Epithelial_cells"TSNEPlot(object = scRNA, pt.size = 0.5, label = TRUE)
03复现

33991个细胞,然后有几个群的细胞继续向下注释,然后继续找出来marker基因,当做差异表达基因
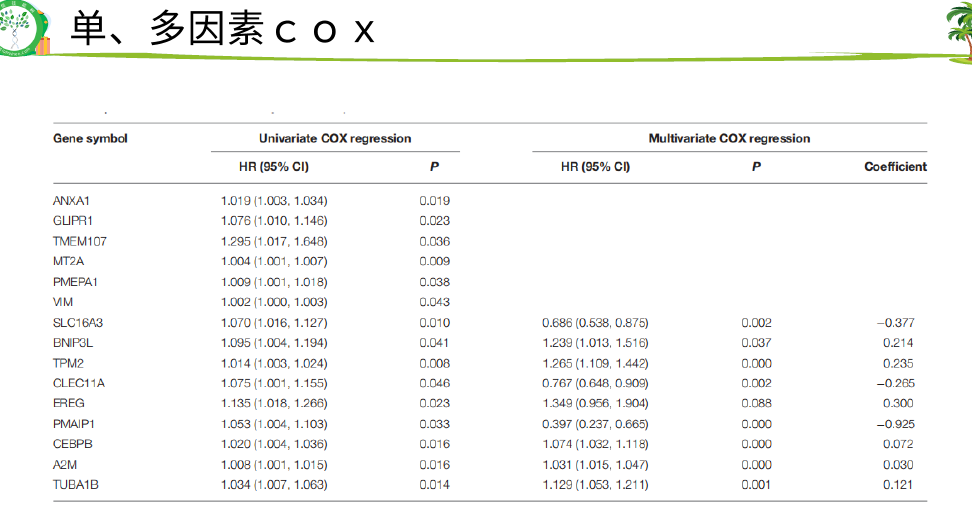
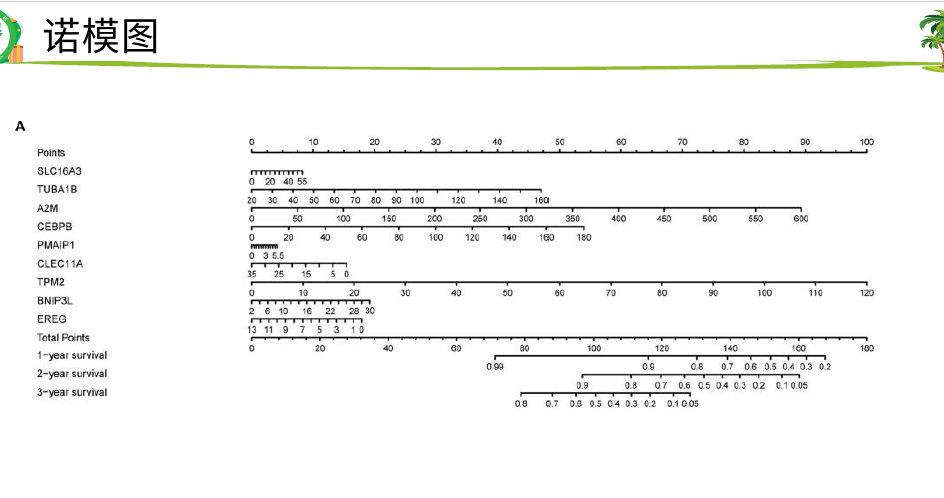
然后就是找训练集和测试集做一些分析,包括cox,kmplot,生存分析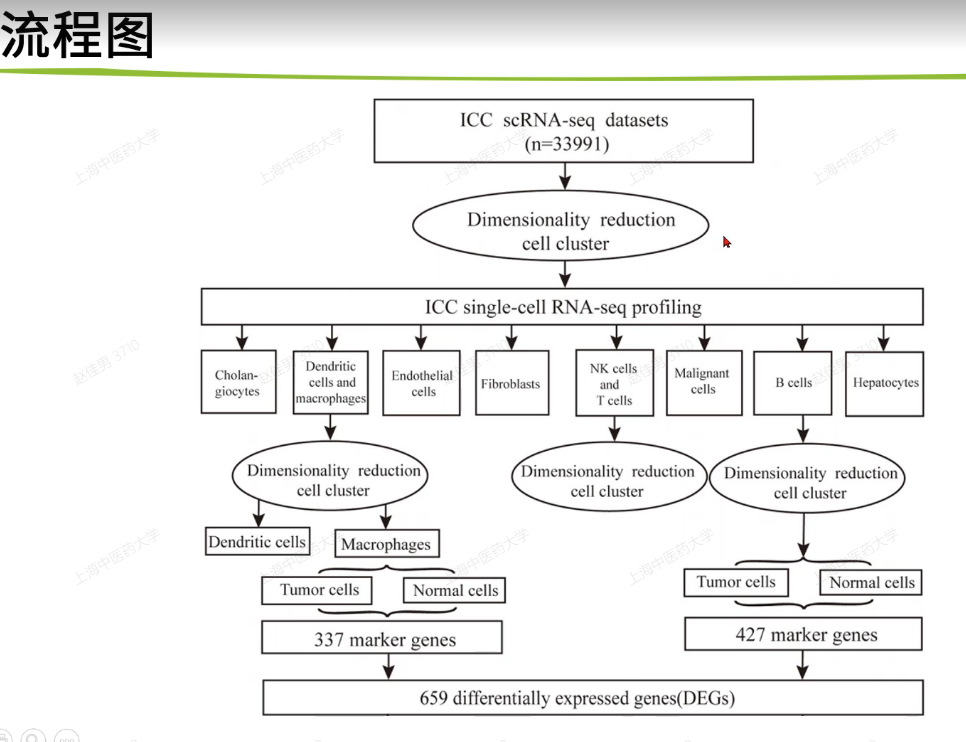
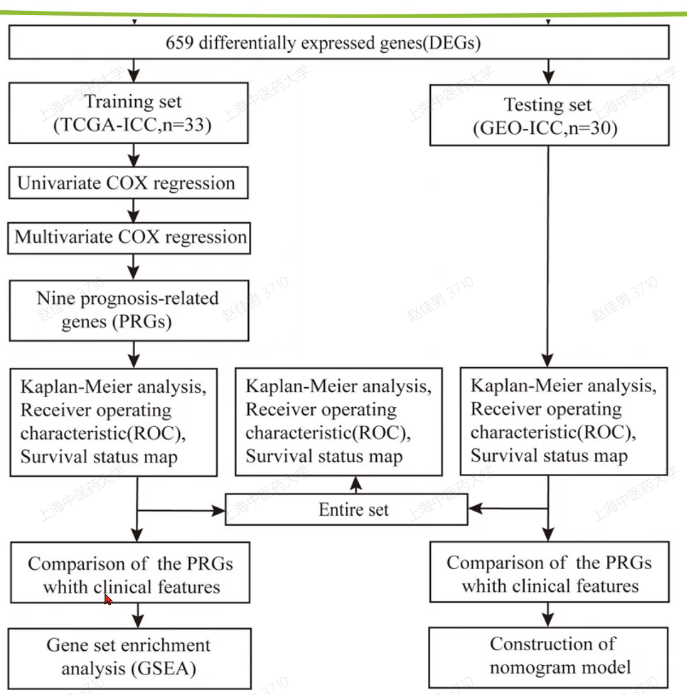



Seurat4.0系列教程1:标准流程- 简书(jianshu.com)
单细胞测序(sc-RNA seq)分析:Seurat4.0系列教程、高级分析、文章复现)


 ###
###

