胃癌:
粪便中SDC2、SFRP2、TERT、RASSF2基因甲基化标志物在胃癌筛查中具有一定的灵敏度和较高的特异度,是胃癌早期筛查中的潜在粪便生物标志物。
这些基因甲基化标志物可以很容易地从患者的体液如血液、胃液及粪便中检测出来。
RASSF2、SFRP2、TERT基因甲基化检测胃癌的灵敏度分别为31.8%、22.7%、36.4%,特异度均达到了90%左右。
reference:
http://rs.yiigle.com/CN112137202111/1313455.htm
胃癌中基本不存在WTX基因启动子区域高甲基化状态。
http://www.cqvip.com/qk/91170a/201303/45117810.html
CDH1基因启动子区甲基化可能是导致散发性胃癌上皮型钙粘附素表达下调的重要原因。
http://www.cqvip.com/qk/91170a/201301/44478711.html
ELMO1基因启动子区甲基化异化具有特异性,在GC组织及胃液中检测其甲基化异化具有敏感性,并且在早期GC中也具有较高的敏感性,ELMO1基因甲基化可作为GC早期诊断的分子靶标。
https://www.wjgnet.com/1009-3079/articlehighlights/v27/i17/1055.htm
高灵敏和特异性检测NDRG4基因启动子区的甲基化能够辅助诊断早期胃癌。
https://patents.google.com/patent/CN106119361A/zh
6 genes (MINT25, RORA, GDNF, ADAM23, PRDM5, MLF1) showed frequent differential methylation between gastric cancer and normal mucosa in the training, test and validation sets.
These findings suggest MINT25 is a sensitive and specific marker for screening in gastric cancer.
https://www.ncbi.nlm.nih.gov/pmc/articles/PMC2722957/
a large number of genes with different biological functions have been found to be methylated in gastric cancer (Table 1). Promoter methylation is an important hallmark of cancer cells, which plays a key role in the initiation and progression of tumor, including gastric cancer. Additionally, aberrant methylation of a number of genes is significantly associated with clinicopathological characteristics and clinical outcomes in gastric cancer (Table 2).
Table 1. Genes commonly methylated in gastric cancer.
| Functions | Gene | Assay | Methylation prevalence (%) | References | ||
|---|---|---|---|---|---|---|
| Normal | Para-cancer | Cancer | ||||
| DNA repair | hMLH1 | MSP | 20.0 | N/A | 8.8–72.9 | [61] , [66] , [67] , [229] , [230] |
| MGMT | MSP | 5.7–8.0 | N/A | 26.7–36.8 | [67] , [68] , [69] , [229] , [230] |
|
| Cell cycle | CDKN1C | Q-MSP | 66.7 | 96.0 | 36.0 | [182] |
| IGFBP3 | Q-MSP | N/A | N/A | 58.3 | [231] | |
| P16 | MSP | 3.8–35.0 | N/A | 21.3–45.0 | [31] , [67] , [75] , [79] , [80] , [81] , [82] , [229] , [230] |
|
| TCF4 | Pyrosequencing | 40.0 | N/A | 67.0 | [232] | |
| PRDM5 | MSP, BS | 0.0 | N/A | 50.0–88.0 | [233] | |
| Cell adherent/invasion/migration | CDH1 | MSP | 16.0–36.1 | N/A | 50.6–84.0 | [31] , [75] , [90] , [182] , [229] |
| FLNc | MSP | 8.0 | N/A | 37.0–41.3 | [67] , [229] |
|
| GRIK2 | Q-MSP | 7.41–30.0 | N/A | 50.0–66.6 | [97] , [98] |
|
| HOXA10 | Q-MSP | 7.4 | 0.0 | 24.0 | [182] | |
| LOX | MSP | 12.0 | N/A | 27.0–41.3 | [229] , [234] |
|
| TIMP3 | MSP | 3.8 | N/A | 13.2 | [230] | |
| TSP1 | MSP | 3.1 | N/A | 35.4 | [235] | |
| Cell growth/differentiation | HAI-2/SPINT2 | MSP | 0.0 | N/A | 75.0 | [100] |
| HOXA1 | Q-MSP | 18.5 | 72.0 | 48.0 | [182] | |
| HoxD10 | MSP | 0.0 | N/A | 85.7 | [104] | |
| NDRG2 | MSP | 20.0 | N/A | 54.0 | [236] | |
| RARRES1 | Q-MSP | 3.0–51.9 | 84.0 | 10.0–36.0 | [171] , [182] |
|
| SHP1 | MSP | 20.8 | 25.0 | [230] | ||
| Apoptosis | BNIP3 | Q-MSP | 15.0 | N/A | 39.0–65.0 | [97] , [112] |
| CACNA1G | Q-MSP | 11.1 | 4.0 | 48.0 | [182] | |
| CMTM3 | MSP | 14.0 | N/A | 44.0 | [237] | |
| DAPK | MSP | 24.5–42.2 | N/A | 30.9–83.2 | [75] , [112] , [116] , [230] |
|
| GPX3 | Pyrosequencing | 39.0 | N/A | 30.1–60.0 | [127] , [128] |
|
| GSTP1 | MSP | 1.9 | N/A | 20.6 | [230] | |
| PCDH10 | MSP, BS | 37.0 | N/A | 82.0 | [238] | |
| PCDH17 | MSP | N/A | N/A | 95.0 | [239] | |
| RBP1 | Q-MSP | 44.4 | 80.0 | 64.0 | [182] | |
| SFRP2 | Q-MSP | 10.0–20.0 | N/A | 55.0–73.3 | [97] , [240] |
|
| Transcriptional regulation | ZNF545 | MSP | 0.0 | 27.0 | 51.9 | [241] |
| CHD5 | Q-MSP | 20.0 | N/A | 40.0 | [97] , [134] |
|
| HLTF | MSP | 8.3–12.0 | N/A | 45.8–53.3 | [229] , [242] |
|
| ZIC1 | MSP | N/A | N/A | 94.6 | [144] | |
| RUNX3 | Q-MSP | 7.4 | 8.0 | 56.0–75. 2 | [141] , [182] , [243] |
|
| Ras pathway | hDAB2IP | MSP | 6.0 | N/A | 46.0 | [244] |
| HRASLS | MSP | N/A | N/A | 40.0–46.0 | [67] , [229] , [234] |
|
| RASSF1A | MSP | 5.7 | N/A | 45.6–61.8 | [116] , [149] , [230] |
|
| RASSF2 | Q-MSP | 35.0 | N/A | 14.0–70.0 | [67] , [75] , [97] , [245] |
|
| RKIP | MSP | 4.1 | N/A | 62.1 | [246] | |
| STAT pathway | SOCS-1 | MSP | 12.0 | N/A | 44.0 | [156] , [157] , [158] |
| Wnt pathway | APC | MSP | 37.7 | N/A | 52.9 | [230] , [247] |
| Dkk-3 | MSP | 34.6 | N/A | 67.6 | [163] , [166] |
|
| SFRP5 | Q-MSP | 66.7 | 76.0 | 56.0 | [182] | |
| Retinoic acid pathway | RARß | MSP | 16.0–20.0 | N/A | 36.0–50.7 | [75] , [116] , [229] |
| CRBP1 | MSP | 0.0 | N/A | 33.0 | [171] | |
| Others | KL | MSP | 0.0 | 47.5 | [181] , [182] |
|
| ITGA4 | Q-MSP | 29.6 | 24.0 | 96.0 | [182] | |
| CDKN2A | MSP, Q-MSP | 29.6 | 20.0 | 30.4–36 | [182] | |
| TP73 | Q-MSP | 3.7 | 0.0 | 24.0 | [182] | |
| BTG4 | MSP | 0.0 | N/A | 73.7 | [248] | |
| DACT1 | MSP, BS | 0.0 | N/A | 29.3 | [249] | |
| NPR1 | MSP | N/A | N/A | 42.5 | [231] | |
| ECRG4 | MSP | 6.7 | 53.3 | 69.4 | [250] | |
| EDNRB | Pyrosequencing | 6.5 | N/A | 50.4 | [250] | |
| CHFR | Q-MSP | 5.0 | N/A | 48–65 | [97] , [182] |
|
| HACE1 | Q-MSP | N/A | N/A | 26.0 | [31] | |
| LRP1B | Q-MSP | 23.0 | N/A | 61.0 | [251] | |
| NR3C1 | Q-MSP | 15.0 | N/A | 24.0–30.0 | [97] , [182] |
|
| TFPI2 | Q-MSP | 0.0 | N/A | 18.0–80.9.0 | [127] , [175] , [176] |
Table 2. Correlation of gene methylation with clinical outcomes in gastric cancer.
| Functions | Gene | Correlation with clinical outcomes | References |
|---|---|---|---|
| DNA repair | hMLH1 | Association with poor prognosis | [67] |
| MGMT | Association with lymph node metastasis, TNM stage and poor survival | [67] , [68] , [73] , [75] |
|
| Cell cycle | p16 | Correlation with poor tumor differentiation, lymph node metastasis, and poor survival | [38] , [67] , [91] , [92] , [93] |
| TCF4 | Correlation with tumor size, Lauren classification, depth of invasion, and lymph node metastasis | [232] | |
| Cell adherent/invasion/migration | CDH1 | Association with worse prognosis, tumor size, lymph vascular invasion, infiltration depth, lymph node and distant metastasis | [93] , [182] |
| FLNc | Association with a poor prognosis | [67] | |
| LOX | Association with depth of tumor invasion, lymph node metastasis, TNM stage and poor survival | [234] | |
| TIMP3 | Associated with tumor localization | [116] | |
| TSP1 | Correlation with TNM stage | [235] | |
| Cell growth/differentiation | HoxD10 | Association with poor prognosis | [104] |
| HAI-2/SPINT2 | Association with poor differentiation and lymph node metastasis | [107] | |
| NDRG2 | Association with lymph node metastasis, tumor invasion, Borrmann classification and TNM stage | [236] | |
| Apoptosis | BNIP3 | Association with poor survival | [112] , [122] |
| CACNA2D3 | Correlation with lymph node metastasis | [38] | |
| DAPK | Correlation with poorly differentiated tumors and lymph node metastasis | [75] , [112] , [114] , [116] |
|
| GPX3 | Correlation with lymph node metastasis | [127] , [128] |
|
| PCDH10 | Association with poor survival | [238] | |
| PCDH17 | Correlation with low tumor stage and lymph node metastasis | [239] | |
| Transcriptional regulation | HLTF | Association with TNM stage | [242] |
| PAX6 | Association with tumor stage, lymph node metastasis and poor prognosis | [116] | |
| ZNF545 | Association with poor prognosis | [241] | |
| RUNX3 | Correlation with depth of tumor invasion, lymph node and distant metastasis | [141] | |
| Ras pathway | RASSF1A | Association with TNM stage and poor prognosis | [75] , [116] , [252] |
| RASSF2 | Association with poor prognosis, histological differentiation, depth of tumor invasion, regional lymph node and distant metastasis, and TNM stage | [67] , [245] |
|
| RKIP | Association with TNM stage, histological differentiation, depth of invasion, lymph node and distant metastasis. | [246] | |
| STAT pathway | SOCS-1 | Association with poor prognosis and metastasis | [157] |
| Wnt pathway | Dkk-3 | Association with cancer-related death | [163] |
| Retinoic acid pathway | RAR-ß | Correlation with lymph node metastasis | [116] |
| Others | KL | Association with the poor prognosis | [181] |
| DACT1 | Association with tumor size, lymph node and distant metastasis | [249] | |
| BTG4 | Correlation with cell differentiation, lymph node metastasis | [248] | |
| ECRG4 | Correlation with tumor stage | [250] | |
| EDNRB | Correlation with lymph node and distant metastasis | [250] | |
| LRP1B | Correlation with tumorigenicity in nude mice | [251] | |
| TFPI2 | Correlation with poor prognosis | [127] | |
| CALCA | Correlation with lymph node metastasis | [116] | |
| QKI | Correlation with poor differentiation status, depth of invasion, lymph node and distant metastasis, advanced TNM stage, and poor survival | [253] |
reference
https://www.sciencedirect.com/science/article/pii/S0009898113001964?via%3Dihub
大肠癌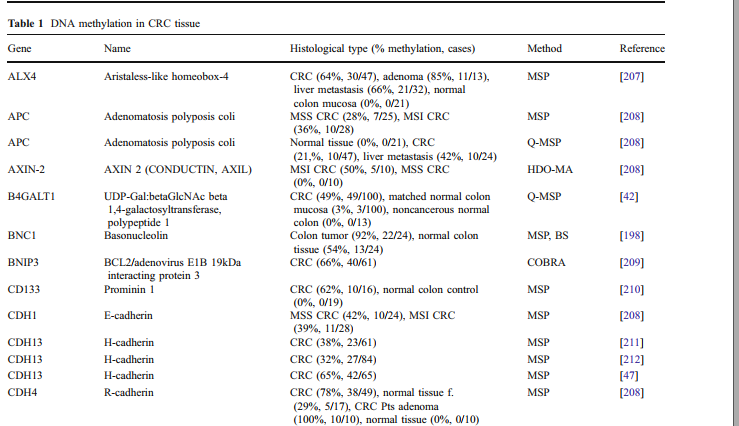


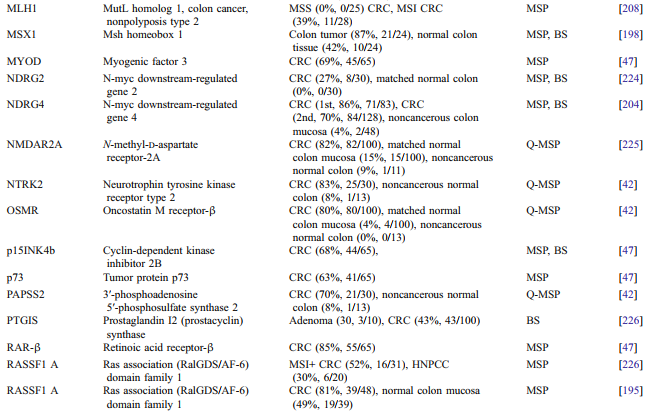


SEPT9、NDRG4和SDC2的甲基化可能是大肠癌早期筛查的生物标志物。SEPT9、NDRG4和SDC2甲基化的联合检测结直肠癌和腺瘤具有高度可行性。
reference:
https://www.x-mol.com/paper/1213056304859516961/t?recommendPaper=1213063552906235929
http://blog.sciencenet.cn/blog-3419762-1256870.html
CRC中SDC2和TFPI2的启动子和大多数CpG位点甲基化水平显著高于正常组织。
https://www.x-mol.com/paper/1388225434525655040/t?recommendPaper=1213056304859516961

若有收获,就点个赞吧
0 人点赞
