1:应用集成prometheus
<!-- 应用集成prometheus --><dependency><groupId>io.micrometer</groupId><artifactId>micrometer-registry-prometheus</artifactId></dependency>#yml或properties中暴露端点management.endpoints.web.exposure.include=prometheus
http://10.5.2.158:8888/actuator/prometheus
2:修改Prometheus的配置,加入要监控的应用的端点
# 端点配置scrape_configs:- job_name: 'prometheus'static_configs:- targets: ['10.5.2.186:9090']- job_name: 'node01'static_configs:- targets: ['10.5.2.186:9100']- job_name: 'api-gateway'metrics_path: '/actuator/prometheus'static_configs:- targets: ['10.5.2.158:8888']
3:访问下Prometheus控制台,看是否正常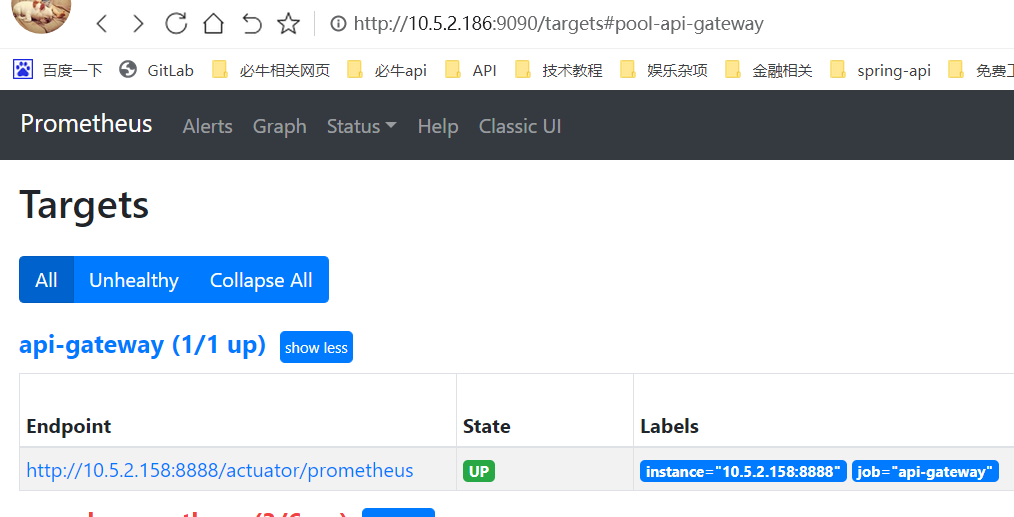
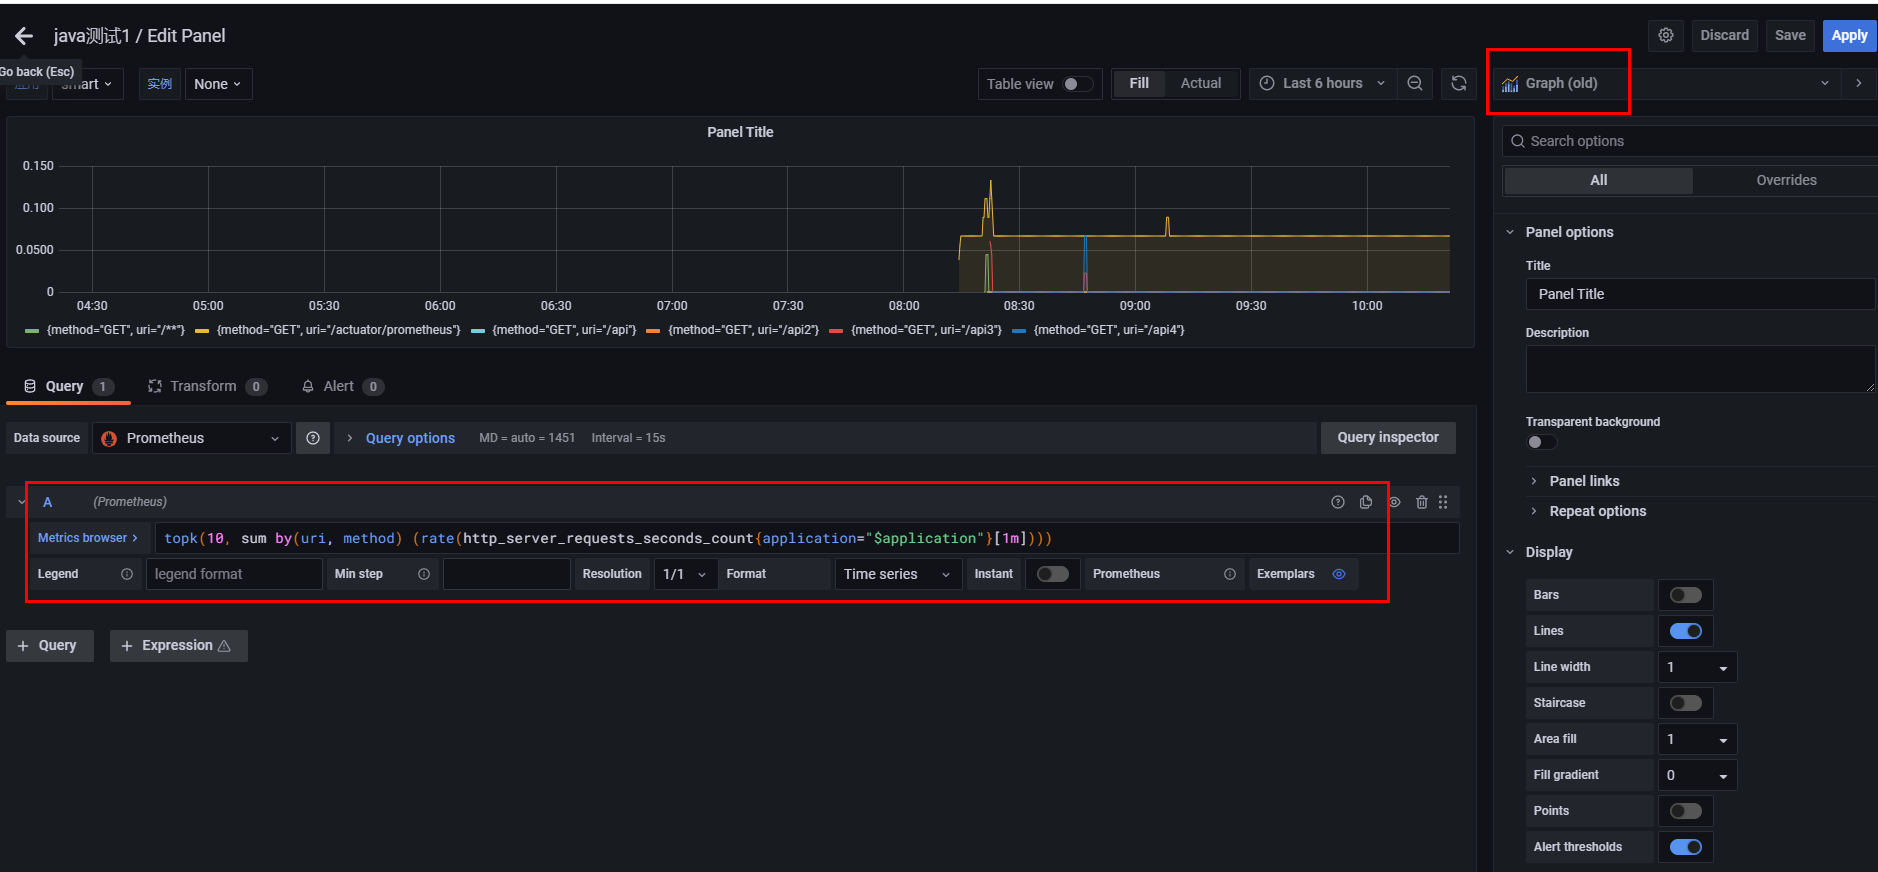
4:监控系统前10 API访问数
Create -> Add an empty panel 创建空面板
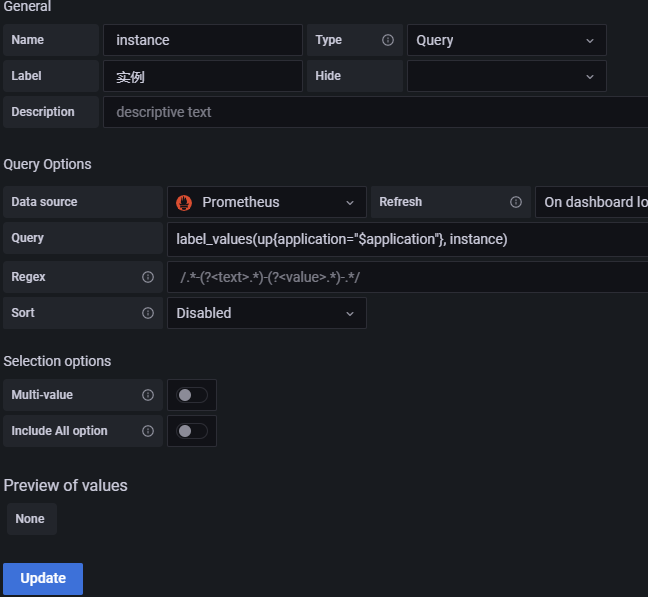
建几个变量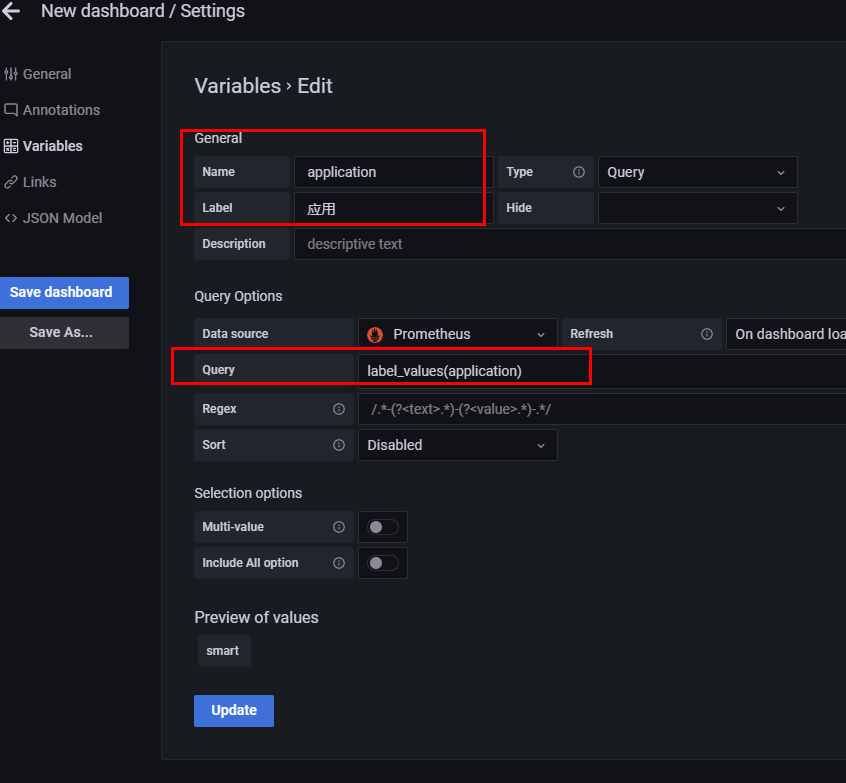
备注:一些语法和用到的API
grafana里prometheus查询语法label_values(label) 返回Promthues所有监控指标中,标签名为label的所有可选值label_values(metric, label) 返回Promthues所有监控指标metric中,标签名为label的所有可选值metrics(metric) 返回所有指标名称满足metric定义正则表达式的指标名称query_result(query) 返回prometheus查询语句的查询结果demo:label_values(application)label_values(up{application="$application"}, instance) 在监控指标application变量的表达式的值中,再取instance变量

若有收获,就点个赞吧
0 人点赞
