原文:https://alligator.io/js/js-performance-api/
性能,性能,性能,重要的事说三遍。你可能有世界上最好的网站,但如果加载它需要2分钟的话没有人会看它。如果你的网站需要2分钟来加载,要找到原因大概不会很难。但是当你想将平均加载时间从1秒降到0.85秒,优化就比较棘手了。
这里有很多工具可以帮助你理解应用程序在本地如何工作。Performance API可以帮助我们更细致地了解我们的页面。你可以得到真实的数据和查看你的网站在不同的浏览器、网络、世界各地等等是如何工作的。
Performance API通常被用来描述一组API。在一篇文章里全部描述它会有太多东西。在这篇文章里,我们将会展示最基本的功能来帮助你开始进行性能监控。
这个API还在不断进化中,将会出现很多新功能和废弃的功能。Performance Timeline Level 2马上就要来了;他们中有一些已经部分实现了,有一些仍然是草案。因此你需要经常去查看下MDN或者W3C的网站看看最近的更新。
如何访问性能数据
performance.now
测试一个程序的性能最基本的方式是使用performance.now()。它会返回一个亚毫秒的当前时间。如果你想要转换成高精度时间,我强烈推荐你阅读W3C草案的这篇文章。
performance.now只能允许你测试JavaScript代码的内容(又称为用户性能)。在文章的后面我将会介绍一个关于使用performance.now的例子。
要访问不同的DOM和浏览器事件我们有3种方法:
getEntries()返回所有可用的性能条目。试着在当前页面运行performance.getEntries(),你将会看到一个巨大的数组。初始的大多数条目将与图片,脚本,以及其他通过页面加载的东西(也称为资源)相关。const tenthEntry = performance.getEntries()[10]// on Alligator.io it will return the following object// { initiatorType: "script",// nextHopProtocol: "h2",// workerStart: 526.8099999520928,// redirectStart: 0,// ....// decodedBodySize: 0,// serverTiming: [],// name: "https://d33wubrfki0l68.cloudfront.net/bundles/e2203d1b1c14952473222bcff4c58a8bd9fef14a.js",// entryType: "resource",// startTime: 315.5049999477342,// duration: 231.48499999661//}// We can see this is a resource entry for a script loaded from cloudfront
getEntriesByType() 与 getEntries()类似,但会给你一个筛选结果的可能性。
这里有6种类型可以查看:
- frame: 一项非常实验性的功能,允许你获得关于在一次循环事件中浏览器完成了多少工作的数据。如果浏览器在一次循环中执行太多操作,frame率将会下降同时用户体验会变差。
- resource:这个涉及到站点下载的所有资源。
- mark: 这是自定义的标记可以被用来计算代码的速度。
- measure: 使我们能够很容易地测量两个标记之间的差异。
- paint:pain与屏幕像素的渲染有关。
- longtask: 长任务是指执行时间超过50ms的任务。
在下一节我们会深入了解其中一些类型。这里先从一个简单的例子开始:
const paintEntries = performance.getEntriesByType('paint')// paint Entries[0] equals {// name: "first-paint",// entryType: "paint",// startTime: 342.160000000149,// duration: 0,// }// paintEntries[1] equals {// name: "first-contentful-paint",// entryType: "paint",// startTime: 342.160000000149,// duration: 0,// }
- getEntriesByName(entryName) 通过名字筛选所有条目。
const nativeLogoPerfEntry = performance.getEntriesByName('https://alligator.io/images/alligator-logo3.svg')[0];// It will return performance information related to the logo's performance:// {initiatorType: "img",// nextHopProtocol: "",// workerStart: 539.6649999311194,// ........// name: "https://alligator.io/images/alligator-logo3.svg",// entryType: "resource",// startTime: 539.5149999530986,// duration: 94.24000000581145//}
如果你在寻找关于网站性能更高级的信息,你可以调用performance.toJSON()。
审核你的函数
调整特定的JavaScript函数,最基本的工具是我们在上面讨论的performance.now()。
这里是一个用法示例:
const firstNow = performance.now()// This loop is just to simulate slow calculationsfor (let i = 0; i < 100000; i++){var ii = Math.sqrt(i)}const secondNow = performance.now()const howLongDidOurLoopTake = secondNow - firstNow// on my laptop it returns howLongDidOurLoopTake == 4.08500000089407 in milliseconds
now有一个问题是如果你多次测量,它管理起来有点困难。一个更好的工具是mark,它能创建一些性能条目允许你稍后查看。然而你可以结合markers并使用measure创建新条目。
performance.mark('beginSquareRootLoop');// This loop is just to simulate slow calculationsfor (let i = 0; i < 1000000; i++){var ii = Math.sqrt(i);}performance.mark('endSquareRootLoop');// Then anywhere in your code you can use// We create a new entry called measureSquareRootLoop which combines our two marksperformance.measure('measureSquareRootLoop','beginSquareRootLoop', 'endSquareRootLoop');console.log(performance.getEntriesByName('beginSquareRootLoop'));// {detail: null,// name: "beginSquareRootLoop",// entryType: "mark",// startTime: 3745.360000000801,// duration: 0}console.log(performance.getEntriesByName('measureSquareRootLoop'));// {detail: null,// name: "measureSquareRootLoop",// entryType: "measure",// startTime: 3745.360000000801, This is the same as beginSquareRootLoop// duration: 9.904999984428287 shows the time it took to get from beginSquareRootLoop to endSquareRootLoop//}
Navigation数据
Navigation用来获得创建web页面的关键步骤的详细信息。访问navigation数据最安全的方式是:
const navigationEntry = performance.getEntriesByType('navigation')[0]
在我的浏览器里,我得到:
{unloadEventStart: 213.41000002576038,unloadEventEnd: 213.41000002576038,domInteractive: 975.8100000326522,domContentLoadedEventStart: 982.2649999987334,domContentLoadedEventEnd: 1217.9650000180118,domComplete: 2000.960000033956,loadEventStart: 2001.044999982696,loadEventEnd: 2008.6500000325032,type: "reload",redirectCount: 0,initiatorType: "navigation",nextHopProtocol: "",workerStart: 2.5550000136718154,redirectStart: 0,redirectEnd: 0,fetchStart: 2.5599999935366213,domainLookupStart: 2.5599999935366213,domainLookupEnd: 2.5599999935366213,connectStart: 2.5599999935366213,connectEnd: 2.5599999935366213,secureConnectionStart: 0,requestStart: 2.5599999935366213,responseStart: 107.46500000823289,responseEnd: 214.3950000172481,transferSize: 0,encodedBodySize: 0,decodedBodySize: 0,serverTiming: [],name: "https://alligator.io/",entryType: "navigation",startTime: 0,duration: 2008.6500000325032}
在后面的文章我们将详细介绍如何使用这些数据。但现在这里只展示一个可视化的导航时间轴。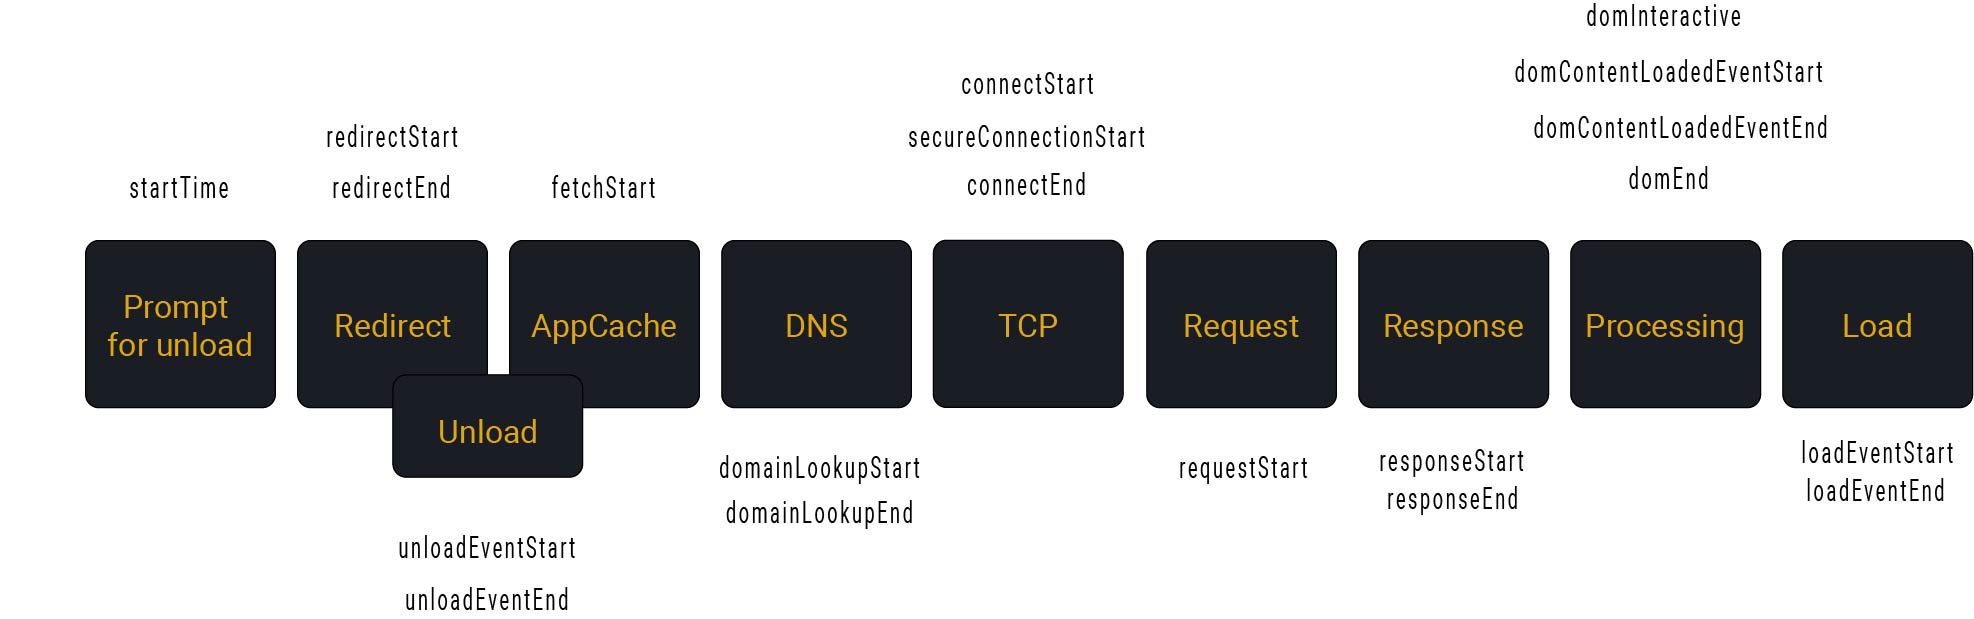
Resource
无论何时资源通过页面被加载,我们都可以在Performance Entries找到它的踪迹。我们获得他们要通过执行performance.getEntriesByType('resource')。它包括图片,脚本,CSS文件等等。所以假如我们想要关注网站上图片的性能我们可以运行:
performance.getEntriesByType('resource').filter(resource=> resource.initiatorType == 'img')
这是一些Alligator.io上的资源:
{initiatorType: "img",nextHopProtocol: "h2",workerStart: 551.2149999849498,redirectStart: 0,redirectEnd: 0,fetchStart: 551.3149999896996,domainLookupStart: 0,domainLookupEnd: 0,connectStart: 0,connectEnd: 0,secureConnectionStart: 0,requestStart: 0,responseStart: 0,responseEnd: 560.1850000093691,transferSize: 0,encodedBodySize: 0,decodedBodySize: 0,serverTiming: [],name: "https://d33wubrfki0l68.cloudfront.net/39d2d2905588dad289b228deb021d51449f6143d/a3baf/images/logos/gatsby-logo.svg",entryType: "resource",startTime: 222.0450000022538,duration: 338.1400000071153}
你可以看到这个的条目有很多值为0,这是因为我们受到CORS的限制(这是资源时间一个很大的限制)。所以相关的数据总是会返回0:redirectStart, redirectEnd, domainLookupStart, domainLookupEnd, connectStart, connectEnd, secureConnectionStart, requestStart, 和 responseStart。
Paint
paint API和窗口渲染像素的事件有关。正如我们在前面的片段中看到的,我们可以访问First Time to Paint和First Contentful Paint。如果你有在用前端优化工具如Lighthouse,你可能会对他们感到熟悉。首次渲染是指在用户的屏幕出现第一个像素时。首次内容绘制是指当一个在DOM中定义的一个元素第一次被渲染。优化首次内容绘制你可以减少阻塞渲染的脚本和样式表,使用HTTP缓存,优化JavaScript的启动等等。
这些都是有用的指标,但如果你试图了解你的用户看到了什么,那这些指标是相当有限的。为了更好地了解用户的性能感知,我们需要结合更多指标。
performance API 非常庞大并且变化很快。查看更新最好的地方当然是Alligator.io,但如果你想要深入研究这个主题,你可以查看Web性能工作组的页面,你可以看到最新的工作草案和建议。

若有收获,就点个赞吧
0 人点赞
