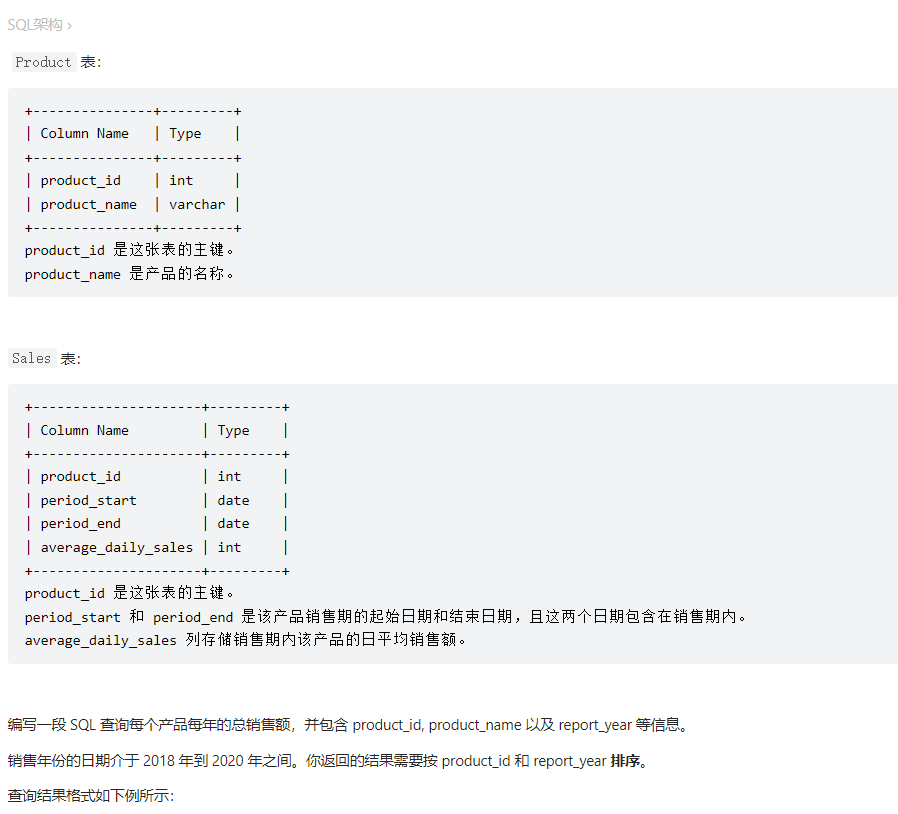
<br />![HJ0E3V{QZD5OBR13~%]LTGD.png](/uploads/projects/youyu77@gthg7v/49557dde91240700c19c3b7d8308e2c8.png)
个人认为比较难的一题,需要把思路理清
题目需要的是18-20年之间的数据,所以事先创建好每年的第一个日期和最后一个日期
第2张表t1是将t中的日期塞到period_start和period_end之间
比如对于id=2的商品,我们生成了 2018-12-01, 2018-12-31, 2019-01-01, 2019-12-31, 2020-01-01这样一个序列
麻烦的主要在预处理阶段,后面只需根据日期的year进行分组,用最大值与最小值的日期差再+1即可表示销售天数
其实严格来说最后一步需要将year(dt)限制在2018至2020之间,否则如果start小于2018或者end大于2020时,结果会显示其他年份(不过leetcode的测试用例没出现这种情况)
with t as(
    select product_id, '2018-01-01' dt from Sales
    union
    select product_id, '2018-12-31' from Sales
    union
    select product_id, '2019-01-01' from Sales
    union
    select product_id, '2019-12-31' from Sales
    union
    select product_id, '2020-01-01' from Sales
    union
    select product_id, '2021-12-31' from Sales
    union all
    select product_id, period_start from Sales
    union all
    select product_id, period_end from Sales
)
,
t1 as(
select t.*, average_daily_sales from Sales S inner join t
on S.product_id = t.product_id and dt between period_start and period_end
order by product_id, dt
)

select t1.product_id,product_name, date_format(dt,'%Y') report_year
, (datediff(max(dt),min(dt))+1)*average_daily_sales total_amount
from t1,Product P where t1.product_id = P.product_id
group by product_id, year(dt) order by product_id, report_year

若有收获,就点个赞吧
0 人点赞
