之前讲了helm的使用,这一章主要用 helm 来部署 prometheus 来监控我们的k8s集群,先认识一下prometheus。
特征
- 一个多维数据模型,其中包含通过度量标准名称和键/值对标识的时间序列数据
- PromQL,一种灵活的查询语言 ,可利用此维度
- 不依赖分布式存储;单服务器节点是自治的
- 时间序列收集通过HTTP上的拉模型进行
- 通过中间网关支持推送时间序列
- 通过服务发现或静态配置发现目标
- 多种图形和仪表板支持模式
组件
Prometheus生态系统包含多个组件,其中许多是可选的:
- Prometheus主服务器,它会刮取并存储时间序列数据
- 客户端库,用于检测应用程序代码
- 一个支持短期工作的推送网关
- 诸如HAProxy,StatsD,Graphite等服务的专用出口商
- 一个alertmanager处理警报
架构
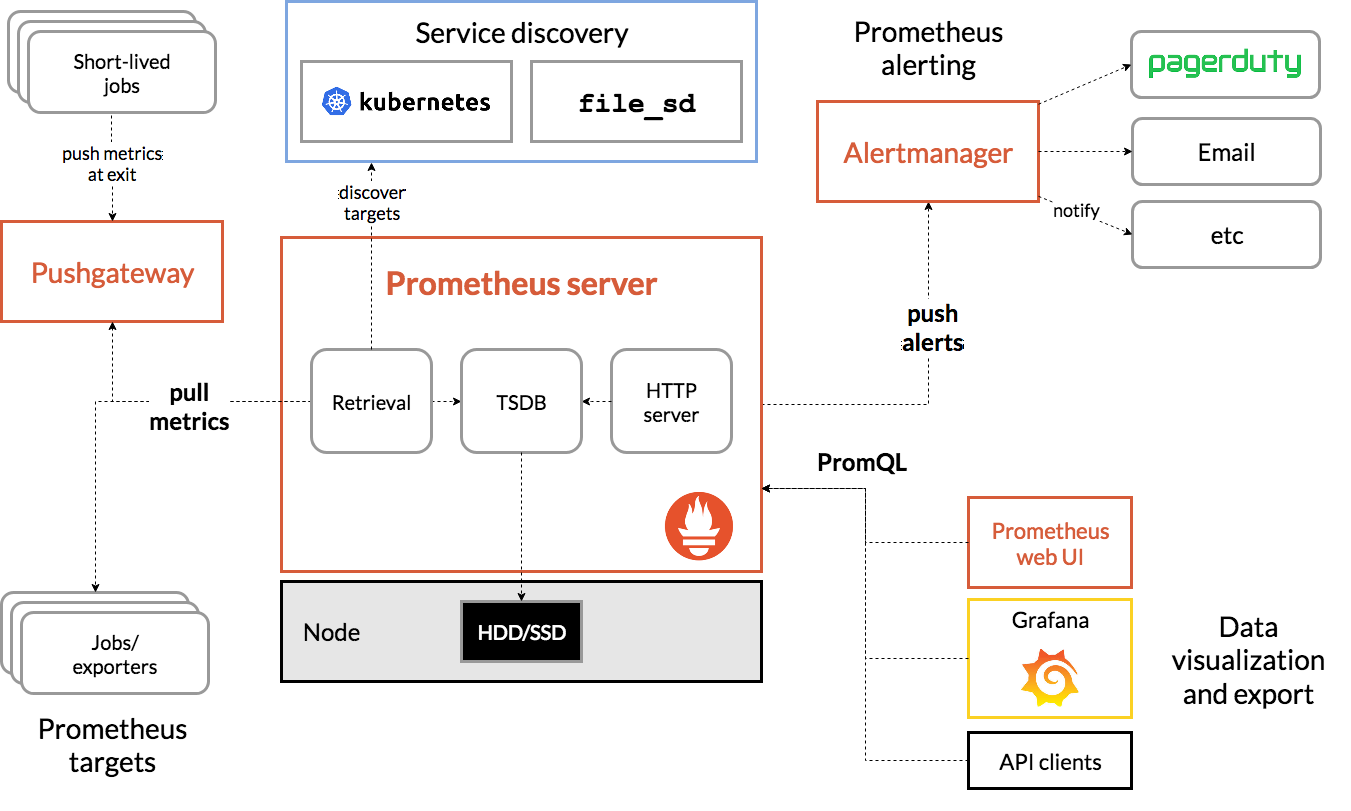
Prometheus直接或通过中介推送网关从已检测作业中删除指标,以用于短期作业。它在本地存储所有报废的样本,并对这些数据运行规则,以汇总和记录现有数据中的新时间序列,或生成警报。Grafana或其他API使用者可以用来可视化收集的数据。
安装 Prometheus
创建 namespace
yangtengcandeMacBook-Pro:charts yangtengcan$ kubectl create ns mon namespace/mon created
安装 prometheus
yangtengcandeMacBook-Pro:charts yangtengcan$ helm install prometheus stable/prometheus -n mon NAME: prometheus LAST DEPLOYED: Sat Jun 27 21:51:47 2020 NAMESPACE: mon STATUS: deployed REVISION: 1 TEST SUITE: None NOTES: The Prometheus server can be accessed via port 80 on the following DNS name from within your cluster: prometheus-server.mon.svc.cluster.local Get the Prometheus server URL by running these commands in the same shell: export POD_NAME=$(kubectl get pods —namespace mon -l “app=prometheus,component=server” -o jsonpath=”{.items[0].metadata.name}”) kubectl —namespace mon port-forward $POD_NAME 9090
The Prometheus alertmanager can be accessed via port 80 on the following DNS name from within your cluster:
prometheus-alertmanager.mon.svc.cluster.local
Get the Alertmanager URL by running these commands in the same shell:
export POD_NAME=$(kubectl get pods —namespace mon -l “app=prometheus,component=alertmanager” -o jsonpath=”{.items[0].metadata.name}”)
kubectl —namespace mon port-forward $POD_NAME 9093
#
WARNING: Pod Security Policy has been moved to a global property.
use .Values.podSecurityPolicy.enabled with pod-based
annotations
(e.g. .Values.nodeExporter.podSecurityPolicy.annotations)
#
The Prometheus PushGateway can be accessed via port 9091 on the following DNS name from within your cluster:
prometheus-pushgateway.mon.svc.cluster.local
Get the PushGateway URL by running these commands in the same shell:
export POD_NAME=$(kubectl get pods —namespace mon -l “app=prometheus,component=pushgateway” -o jsonpath=”{.items[0].metadata.name}”)
kubectl —namespace mon port-forward $POD_NAME 9091
For more information on running Prometheus, visit:
- 访问
将svc 的类型改成 NodePort
yangtengcandeMacBook-Pro:charts yangtengcan$ kubectl edit svc prometheus-server -n mon
apiVersion: v1
kind: Service
metadata:
annotations:
meta.helm.sh/release-name: prometheus
meta.helm.sh/release-namespace: mon
creationTimestamp: “2020-06-27T13:51:48Z”
labels:
app: prometheus
app.kubernetes.io/managed-by: Helm
chart: prometheus-11.6.0
component: server
heritage: Helm
release: prometheus
name: prometheus-server
namespace: mon
resourceVersion: “502034”
selfLink: /api/v1/namespaces/mon/services/prometheus-server
uid: cd58b01e-93fa-48ea-99fd-35024cb9b784
spec:
clusterIP: 10.96.255.51
ports:
name: http
port: 80
protocol: TCP
targetPort: 9090
selector:
app: prometheus
component: server
release: prometheus
sessionAffinity: None
type: ClusterIP #修改NodePort
status:
loadBalancer: {}

安装 grafana
- 下载charts
helm pull stable/grafana —untar
- 修改密码
vim grafana/values.yaml
……
adminPassword: admin123
……
- 安装
yangtengcandeMacBook-Pro:charts yangtengcan$ helm install grafana ./grafana -n mon
NAME: grafana
LAST DEPLOYED: Sat Jun 27 22:21:48 2020
NAMESPACE: mon
STATUS: deployed
REVISION: 1
NOTES:
Get your ‘admin’ user password by running:
kubectl get secret —namespace mon grafana -o jsonpath=”{.data.admin-password}” | base64 —decode ; echo
The Grafana server can be accessed via port 80 on the following DNS name from within your cluster:
grafana.mon.svc.cluster.local
Get the Grafana URL to visit by running these commands in the same shell:
export POD_NAME=$(kubectl get pods —namespace mon -l “app.kubernetes.io/name=grafana,app.kubernetes.io/instance=grafana” -o jsonpath=”{.items[0].metadata.name}”)
kubectl —namespace mon port-forward $POD_NAME 3000
Login with the password from step 1 and the username: admin
#
WARNING: Persistence is disabled!!! You will lose your data when
the Grafana pod is terminated.
#
- 访问
将svc 的类型改成 NodePort
yangtengcandeMacBook-Pro:charts yangtengcan$ kubectl edit svc grafana -n mon
…… type: ClusterIP #修改NodePort status: loadBalancer: {} ……
- 登录
修改完之后用admin/admin123登录grafana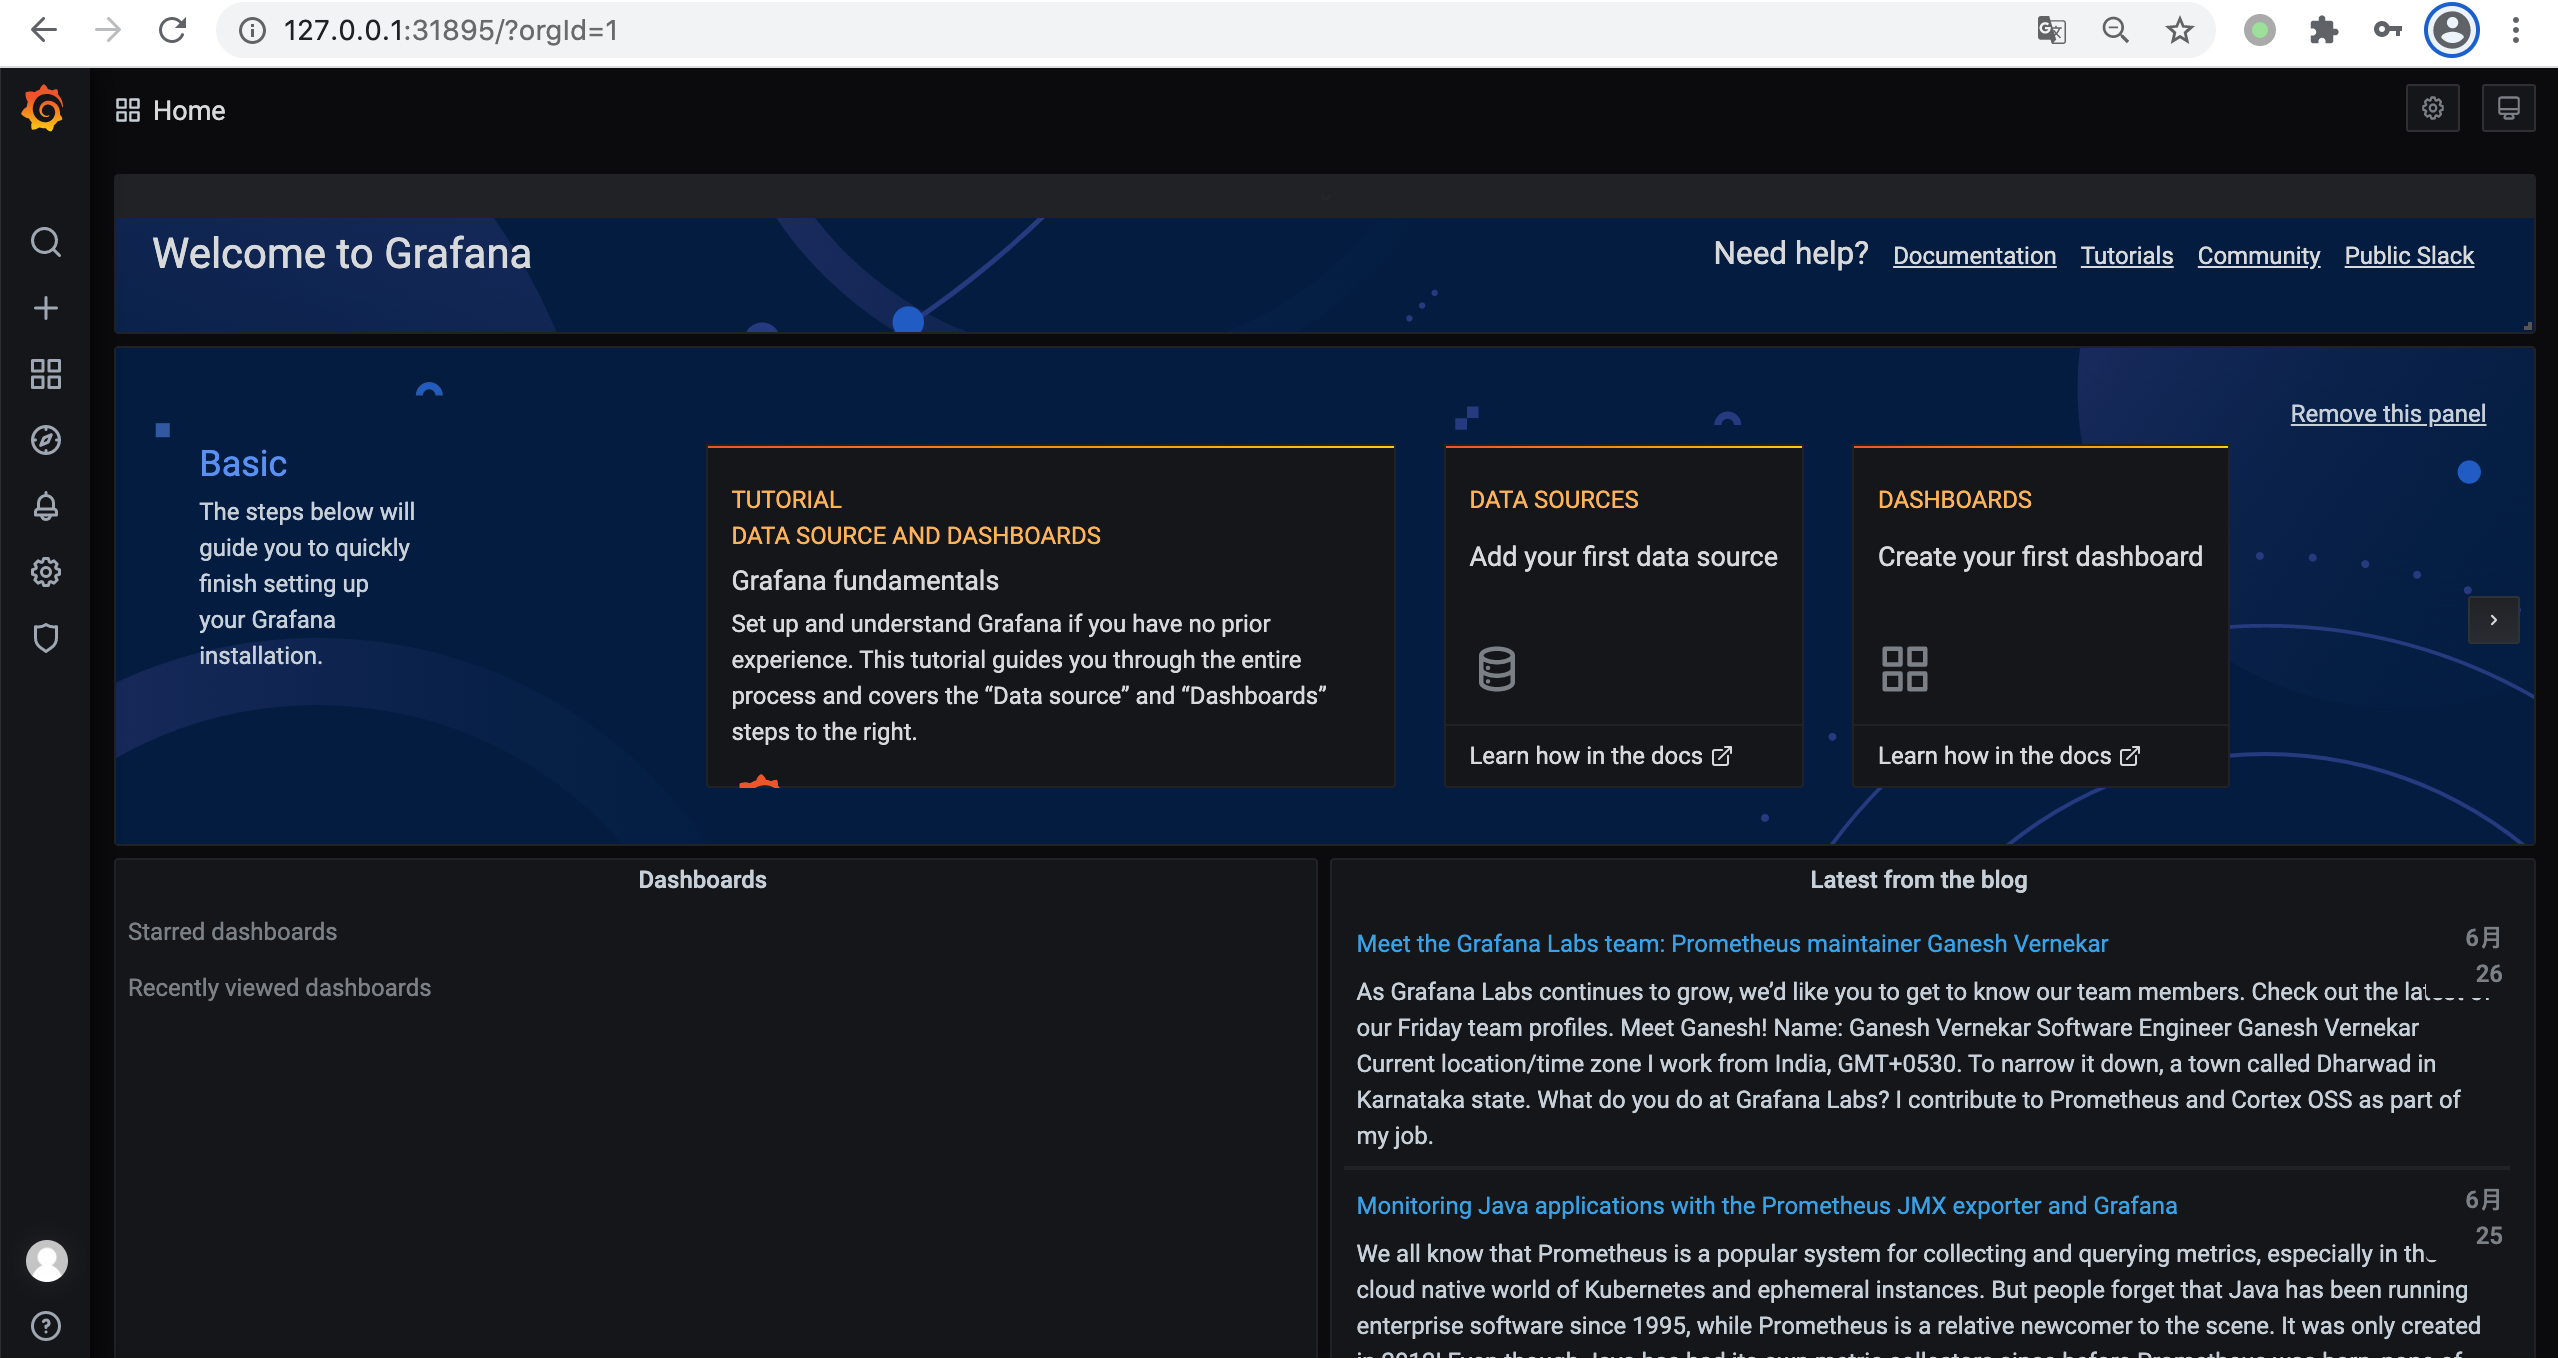
- 添加数据源

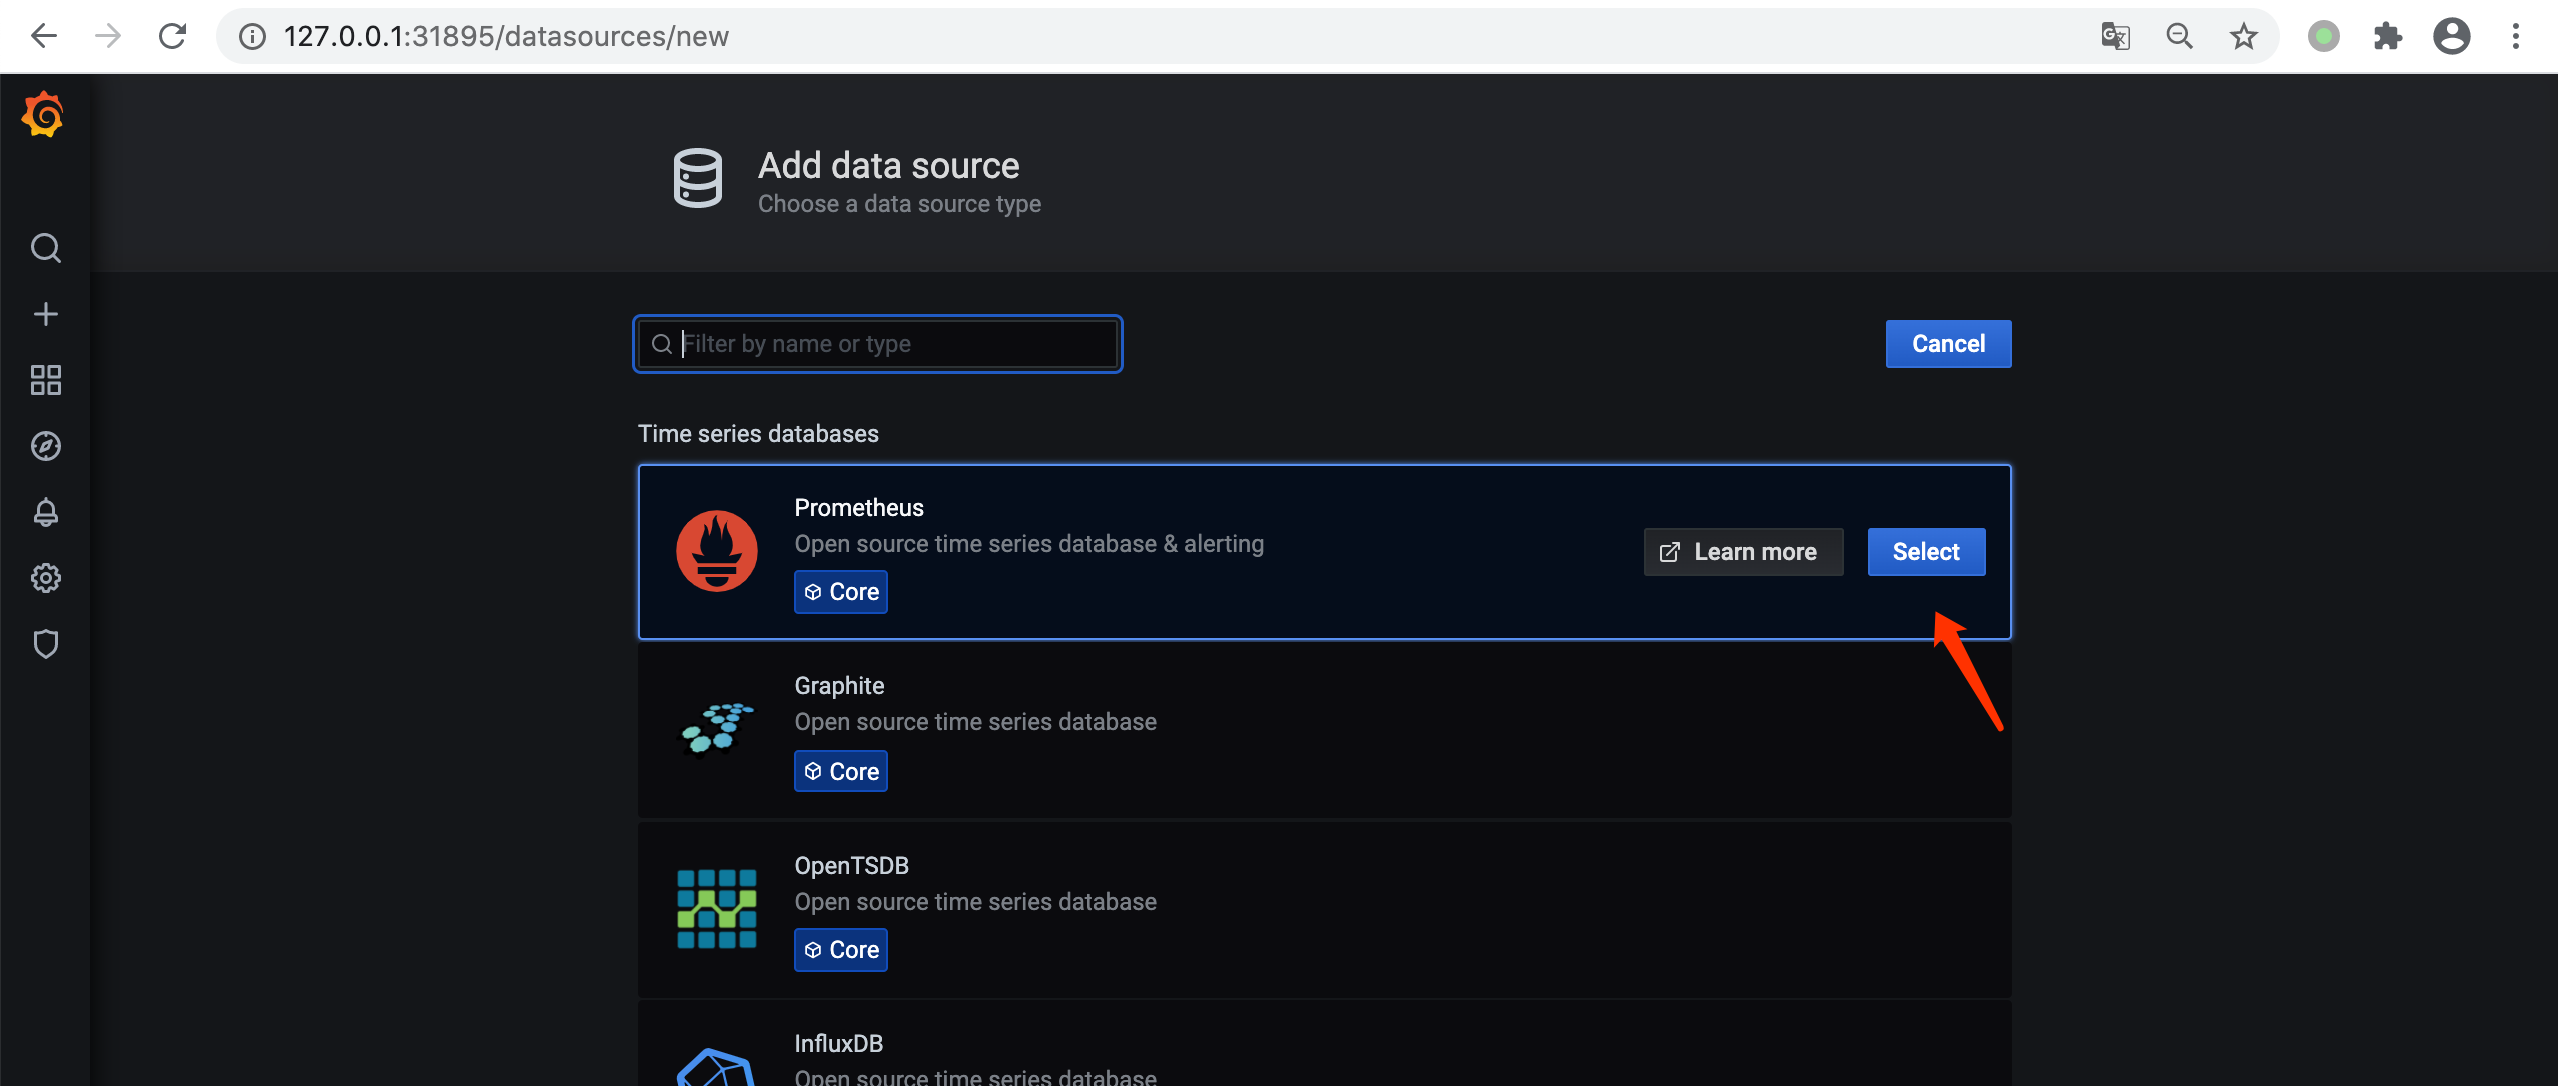
这里天prometheus server 的地址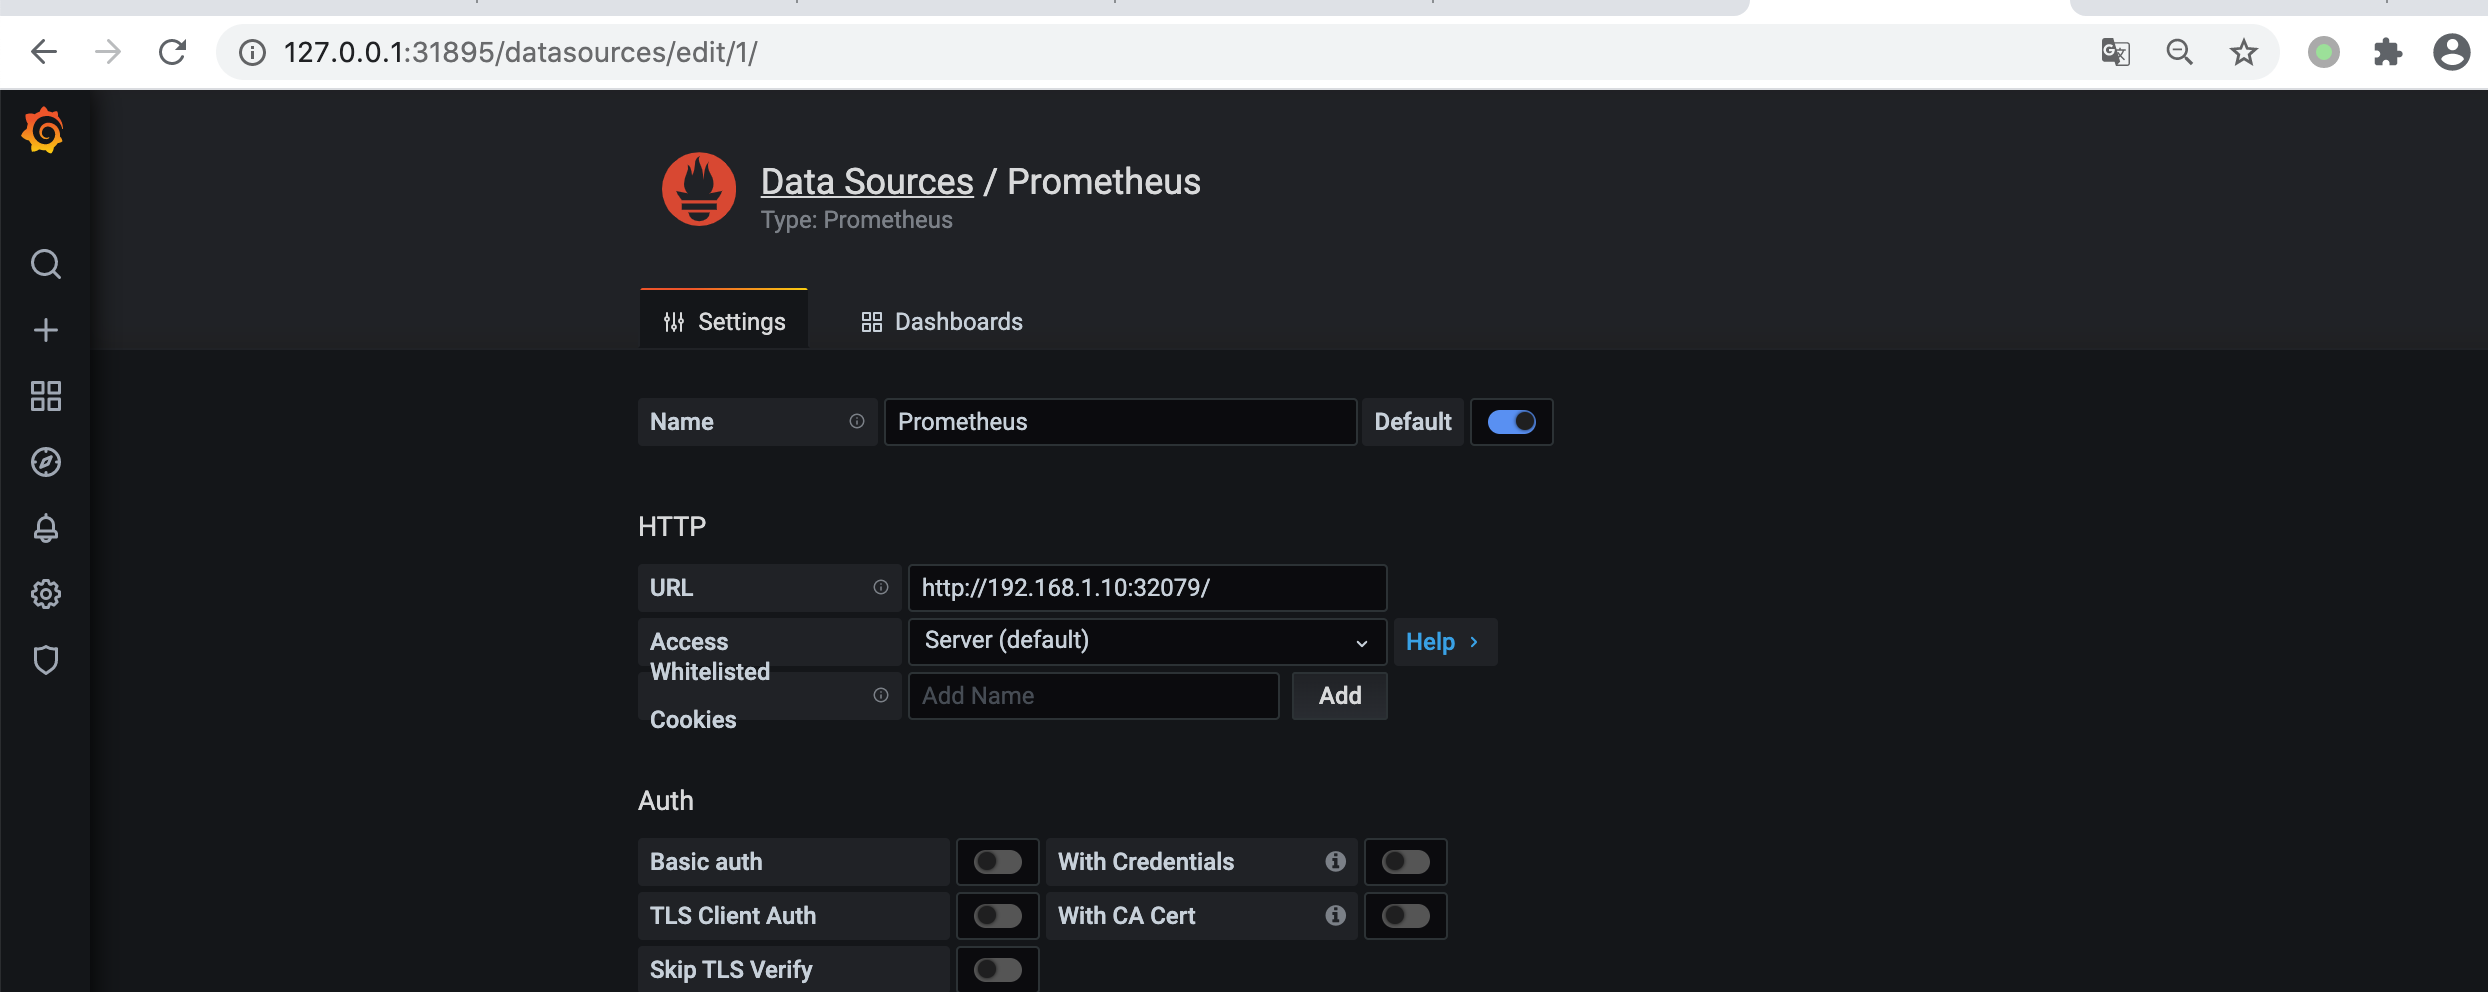
看到以下提示表示添加成功


若有收获,就点个赞吧
0 人点赞
