函数跟踪
Xdebug允许你记录所有的函数调用数据(包括参数和返回值)到不同格式的文件。
之所以称之为函数跟踪,是因为它可以帮助你在使用新的应用程序,或者当你试图找出应用程序运行时到底发生了什么。函数跟踪还可以选择显示传递给函数和方法的变量的值,并返回值。在默认跟踪中,这两个元素不可用。
输出格式
有三种输出格式。第一种是人类可读的调用栈,第二种更适合计算机程序,因为它更容易解析,最后一种使用HTML格式化踪迹。您可以通过设置xdebug.trace_format参数在两种不同格式之间切换。有几个设置可以控制将哪些信息写入跟踪文件。例如,包含变量(xdebug.collect_params)和包含返回值(xdebug.collect_return)的设置。下面的例子显示了不同的设置对人类可读的函数调用栈有什么影响。
Example:
<?php$str = "Xdebug";function ret_ord( $c ){return ord( $c );}foreach ( str_split( $str ) as $char ){echo $char, ": ", ret_ord( $char ), "\n";}
结果:
以下是使用不同设置的xdebug.collect_params 设置的结果。由于这不是Web环境,工具提示在文本文件中不起作用,所以2的值没有任何意义。
输出(默认)
TRACE START [2007-05-06 14:37:06]0.0003 114112 - > {main}()../trace.php:00.0004 114272 - > str_split()../trace.php:80.0153 117424 - > ret_ord()../trace.php:100.0165 117584 - > ord()../trace.php:50.0166 117584 - > ret_ord()../trace.php:100.0167 117584 - > ord()../trace.php:50.0168 117584 - > ret_ord()../trace.php:100.0168 117584 - > ord()../trace.php:50.0170 117584 - > ret_ord()../trace.php:100.0170 117584 - > ord()../trace.php:50.0172 117584 - > ret_ord()../trace.php:100.0172 117584 - > ord()../trace.php:50.0173 117584 - > ret_ord()../trace.php:100.0174 117584 - > ord()../trace.php:50.0177 41152TRACE END [2007-05-06 14:37:07]
输出(collect_params=1):
TRACE START [2007-05-06 14:37:11]0.0003 114112 -> {main}() ../trace.php:00.0004 114272 -> str_split(string(6)) ../trace.php:80.0007 117424 -> ret_ord(string(1)) ../trace.php:100.0007 117584 -> ord(string(1)) ../trace.php:50.0009 117584 -> ret_ord(string(1)) ../trace.php:100.0009 117584 -> ord(string(1)) ../trace.php:50.0010 117584 -> ret_ord(string(1)) ../trace.php:100.0011 117584 -> ord(string(1)) ../trace.php:50.0012 117584 -> ret_ord(string(1)) ../trace.php:100.0013 117584 -> ord(string(1)) ../trace.php:50.0014 117584 -> ret_ord(string(1)) ../trace.php:100.0014 117584 -> ord(string(1)) ../trace.php:50.0016 117584 -> ret_ord(string(1)) ../trace.php:100.0016 117584 -> ord(string(1)) ../trace.php:50.0019 41152TRACE END [2007-05-06 14:37:11]
输出(collect_params=3):
TRACE START [2007-05-06 14:37:13]0.0003 114112 -> {main}() ../trace.php:00.0004 114272 -> str_split('Xdebug') ../trace.php:80.0007 117424 -> ret_ord('X') ../trace.php:100.0007 117584 -> ord('X') ../trace.php:50.0009 117584 -> ret_ord('d') ../trace.php:100.0009 117584 -> ord('d') ../trace.php:50.0010 117584 -> ret_ord('e') ../trace.php:100.0011 117584 -> ord('e') ../trace.php:50.0012 117584 -> ret_ord('b') ../trace.php:100.0013 117584 -> ord('b') ../trace.php:50.0014 117584 -> ret_ord('u') ../trace.php:100.0014 117584 -> ord('u') ../trace.php:50.0016 117584 -> ret_ord('g') ../trace.php:100.0016 117584 -> ord('g') ../trace.php:50.0019 41152TRACE END [2007-05-06 14:37:13]
输出(collect_params=4):
TRACE START [2007-05-06 14:37:16]0.0003 114112 -> {main}() ../trace.php:00.0004 114272 -> str_split('Xdebug') ../trace.php:80.0007 117424 -> ret_ord($c = 'X') ../trace.php:100.0007 117584 -> ord('X') ../trace.php:50.0009 117584 -> ret_ord($c = 'd') ../trace.php:100.0009 117584 -> ord('d') ../trace.php:50.0010 117584 -> ret_ord($c = 'e') ../trace.php:100.0011 117584 -> ord('e') ../trace.php:50.0012 117584 -> ret_ord($c = 'b') ../trace.php:100.0013 117584 -> ord('b') ../trace.php:50.0014 117584 -> ret_ord($c = 'u') ../trace.php:100.0014 117584 -> ord('u') ../trace.php:50.0016 117584 -> ret_ord($c = 'g') ../trace.php:100.0016 117584 -> ord('g') ../trace.php:50.0019 41152TRACE END [2007-05-06 14:37:16]
除了xdebug.collect_params设置之外,还有一些影响跟踪文件输出的设置。选项show_mem_delta = 1显示输出文件中两条不同行之间的内存使用率差异。
输出(show_mem_delta = 1):
TRACE START [2007-05-06 14:37:06]0.0003 114112 - > {main}()../trace.php:00.0004 114272 - > str_split()../trace.php:80.0153 117424 - > ret_ord()../trace.php:100.0165 117584 - > ord()../trace.php:50.0166 117584 - > ret_ord()../trace.php:100.0167 117584 - > ord()../trace.php:50.0168 117584 - > ret_ord()../trace.php:100.0168 117584 - > ord()../trace.php:50.0170 117584 - > ret_ord()../trace.php:100.0170 117584 - > ord()../trace.php:50.0172 117584 - > ret_ord()../trace.php:100.0172 117584 - > ord()../trace.php:50.0173 117584 - > ret_ord()../trace.php:100.0174 117584 - > ord()../trace.php:50.0177 41152TRACE END [2007-05-06 14:37:07]
输出(collect_return = 1):
TRACE START [2007-05-06 14:37:35]0.0003 114112 -> {main}() ../trace.php:00.0004 114272 -> str_split('Xdebug') ../trace.php:8>=> array (0 => 'X', 1 => 'd', 2 => 'e', 3 => 'b', 4 => 'u', 5 => 'g')0.0007 117424 -> ret_ord($c = 'X') ../trace.php:100.0007 117584 -> ord('X') ../trace.php:5>=> 88>=> 880.0009 117584 -> ret_ord($c = 'd') ../trace.php:100.0009 117584 -> ord('d') ../trace.php:5>=> 100>=> 1000.0011 117584 -> ret_ord($c = 'e') ../trace.php:100.0011 117584 -> ord('e') ../trace.php:5>=> 101>=> 1010.0013 117584 -> ret_ord($c = 'b') ../trace.php:100.0013 117584 -> ord('b') ../trace.php:5>=> 98>=> 980.0015 117584 -> ret_ord($c = 'u') ../trace.php:100.0016 117584 -> ord('u') ../trace.php:5>=> 117>=> 1170.0017 117584 -> ret_ord($c = 'g') ../trace.php:100.0018 117584 -> ord('g') ../trace.php:5>=> 103>=> 103>=> 10.0021 41152TRACE END [2007-05-06 14:37:35]
所有函数调用的返回值也是可见的,这个需要打开打开xdebug.collect_return设置。
输出(trace_format=1):
Version: 2.0.0RC4-devTRACE START [2007-05-06 18:29:01]1 0 0 0.010870 114112 {main} 1 ../trace.php 02 1 0 0.032009 114272 str_split 0 ../trace.php 82 1 1 0.032073 1166322 2 0 0.033505 117424 ret_ord 1 ../trace.php 103 3 0 0.033531 117584 ord 0 ../trace.php 53 3 1 0.033551 1175842 2 1 0.033567 1175842 4 0 0.033718 117584 ret_ord 1 ../trace.php 103 5 0 0.033740 117584 ord 0 ../trace.php 53 5 1 0.033758 1175842 4 1 0.033770 1175842 6 0 0.033914 117584 ret_ord 1 ../trace.php 103 7 0 0.033936 117584 ord 0 ../trace.php 53 7 1 0.033953 1175842 6 1 0.033965 1175842 8 0 0.034108 117584 ret_ord 1 ../trace.php 103 9 0 0.034130 117584 ord 0 ../trace.php 53 9 1 0.034147 1175842 8 1 0.034160 1175842 10 0 0.034302 117584 ret_ord 1 ../trace.php 103 11 0 0.034325 117584 ord 0 ../trace.php 53 11 1 0.034342 1175842 10 1 0.034354 1175842 12 0 0.034497 117584 ret_ord 1 ../trace.php 103 13 0 0.034519 117584 ord 0 ../trace.php 53 13 1 0.034536 1175842 12 1 0.034549 1175841 0 1 0.034636 117584TRACE END [2007-05-06 18:29:01]
最后一个标签显示了一个不同的输出格式,它更容易解析,但难以阅读。该xdebug.trace_format因此设置主要是对分析工具有用的。
VIM语法文件
Xdebug附带的VIM语法文件,支持突出显示跟踪文件:xt.vim。为了让VIM识别文件语法格式,您需要执行以下步骤:
将xt.vim文件复制到〜/ .vim / syntax
编辑或创建
~/vim/filetype.vim并添加以下行:augroup filetypedetectau BufNewFile,BufRead *.xt setf xtaugroup END
使用这些设置打开一个Xdebug跟踪文件会出现如下所示:
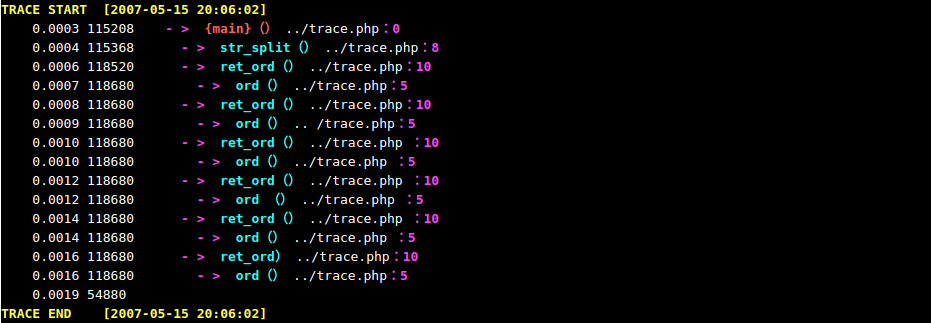
你也可以使用zc和zo折叠部分跟踪文件。
相关设置
xdebug.auto_trace
类型:boolean,默认值:0
当此设置设置为打开时,函数调用的跟踪将在脚本运行之前启用。这使得跟踪auto_prepend_file中的代码成为可能。
xdebug.collect_assignments
该功能仅适用于
Xdebug> = 2.1
类型:boolean,默认值:0
这个默认为0的设置控制着Xdebug是否应该为函数追踪添加变量赋值。
从Xdebug2.6起,包含assign-by-var(=&)赋值。
xdebug.collect_includes
类型:boolean,默认值:1
此设置默认为1,它控制Xdebug是否应将include(),include_once(),require()或require_once()中使用的文件名写入跟踪文件。
xdebug.collect_params
类型:integer,默认值:1
此设置默认为0,控制Xdebug是否应该在功能跟踪或堆栈跟踪中记录函数调用时传递给函数的参数。
该设置默认为0,因为对于非常大的脚本,它可能会使用大量的内存,因此运行巨大的脚本可能会有一点点问题。大部分情况下您可以最安全地开启此设置,但是您可能会在具有大量函数调用和/或巨大数据结构作为参数的脚本中遇到一些问题。Xdebug2不存在该问题,不会因增加内存使用而产生这个问题,因为它永远不会将这些信息存储在内存中。相反,它只会写入磁盘。这意味着您需要查看磁盘使用情况。
该设置可以有四个不同的值。对于每个值,都会显示不同的信息量。下面你会看到每个值提供的信息。有关一些屏幕截图,另请参阅堆栈跟踪功能的介绍 。
| 值 | 参数信息如图所示 |
|---|---|
| 0 | 没有。 |
| 1 | 元素的类型和数量 (f.e. string(6), array(8))。 |
| 2 | 元素的类型和数量,以及提供完整信息的工具提示。 |
| 3 | 完全可变的内容(限制由xdebug.var_display_max_children,xdebug.var_display_max_data和xdebug.var_display_max_depth设置)。 |
| 4 | 全变量内容和变量名称。 |
| 5 | PHP序列化变量的内容,没有名字。(Xdebug 2.3中的新功能) |
注:在CLI版本的PHP中不会有工具提示,也不会出现在输出文件中。
xdebug.collect_return
类型:boolean,默认值:0
这个默认为0的设置控制Xdebug是否应该将函数调用的返回值写入跟踪文件。
对于计算机化的跟踪文件(xdebug.trace_format = 1),从Xdebug 2.3起可用。

若有收获,就点个赞吧
0 人点赞
