在v11.7.0中加入实验性功能,诊断报告。诊断报告的输出是一个json文件,包括以下信息。
- 进程信息
- 操作系统信息
- 堆栈信息
- 内存资源使用
- libuv状态
- 环境变量
- 共享库
- 诊断报告的原始信息
如何产生诊断报告
- 必需使用 —experimental-report 来启用
- process.report.writeReport() 来输出诊断报告 ``` node —experimental-report —diagnostic-report-filename=YYYYMMDD.HHMMSS.PID.SEQUENCE#.txt —eval “process.report.writeReport(‘report.json’)”
Writing Node.js report to file: report.json Node.js report completed
用编辑器打开诊断报告,可以看到类似下面的内容。<br />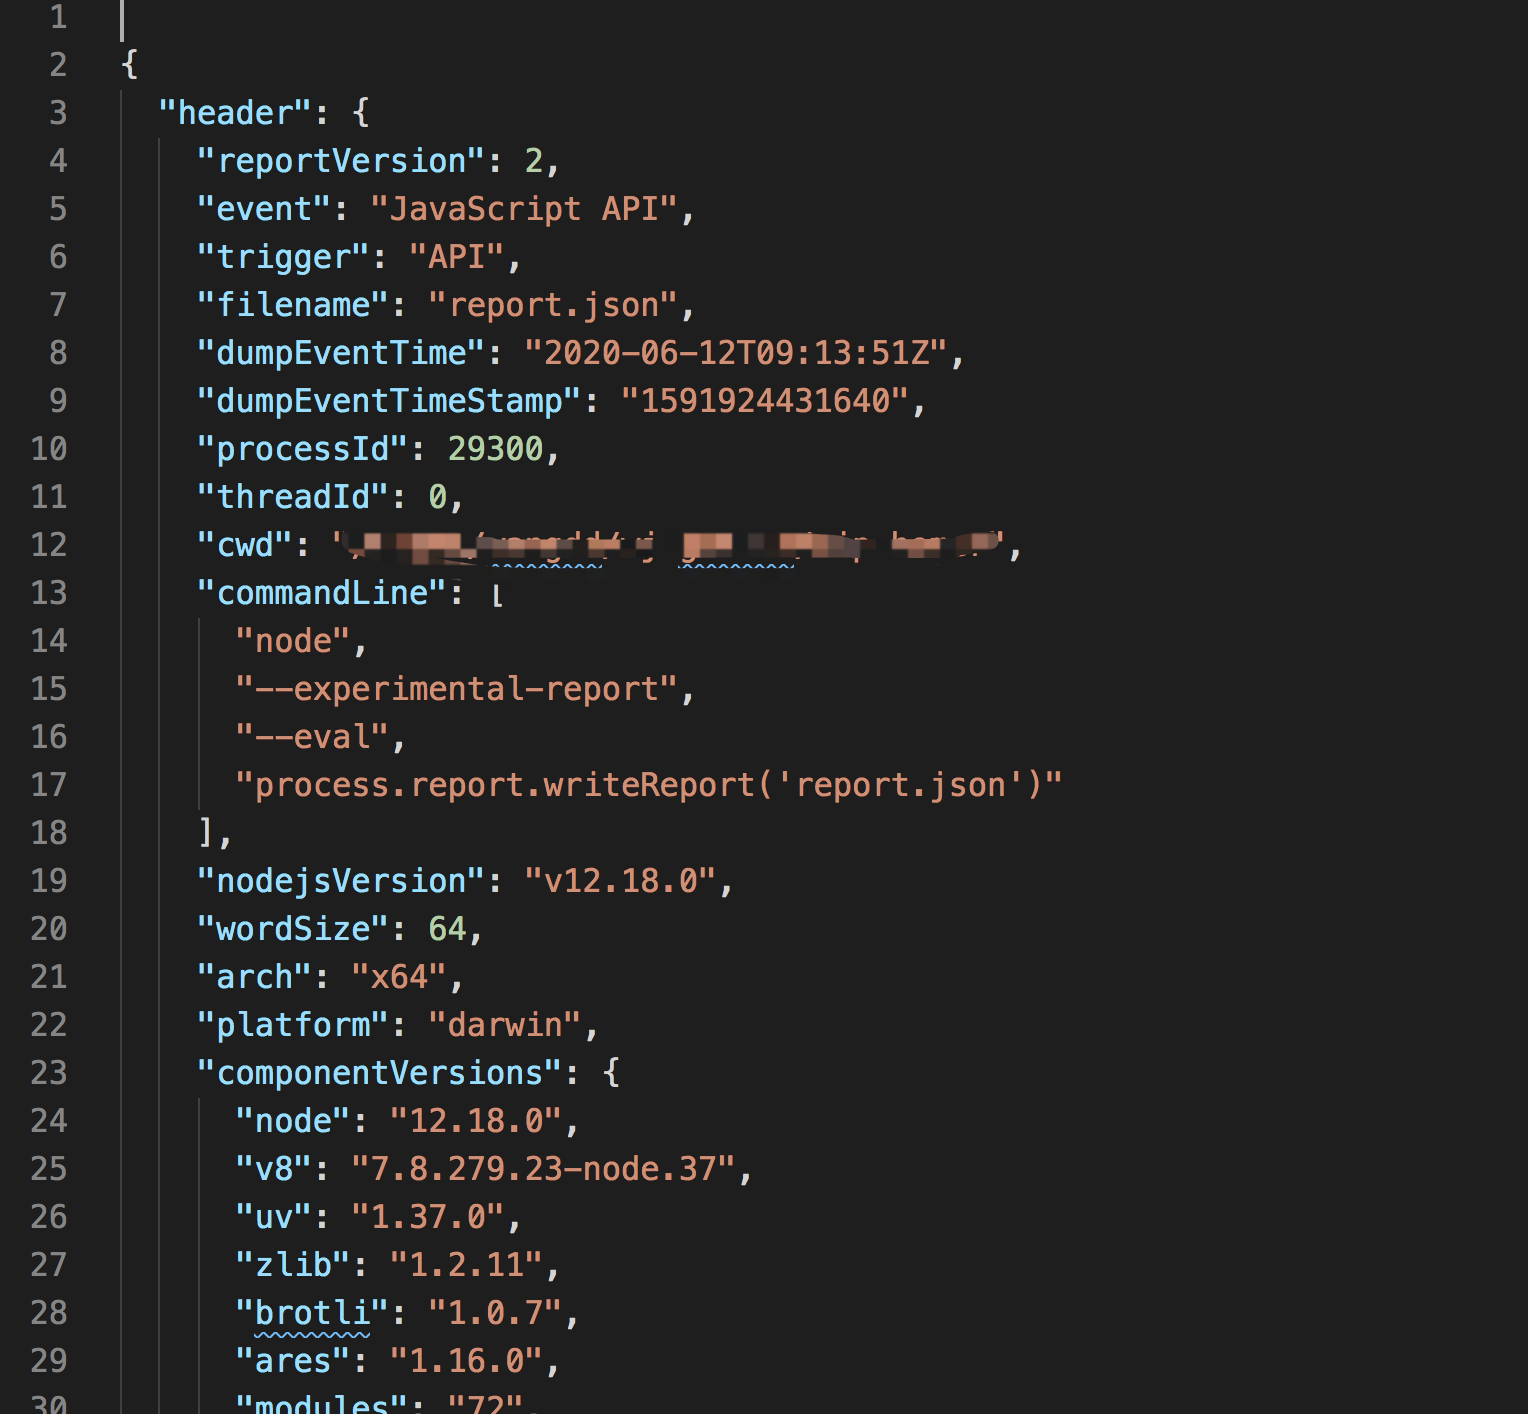<a name="SBbzr"></a># 如何从诊断报告中分析问题?诊断报告很长,不太好理解。IBM开发了report-toolkit工具,可以用来分析。<br />要求:node > 11.8.0
npm install report-toolkit —global 或者 yarn global add report-toolkit
查看帮助信息
rtk —help
<a name="LCDxP"></a># 自动出发报告
node —experimental-report \ —diagnostic-report-on-fatalerror \ —diagnostic-report-uncaught-exception \ index.js ```
| $ node –help | grep report |
|---|---|
--experimental-report |
enable report generation 启用report功能 |
--diagnostic-report-on-fatalerror |
generate diagnostic report on fatal (internal) errors 产生报告当发生致命错误 |
--diagnostic-report-on-signal |
generate diagnostic report upon receiving signals 产生报告当收到信号 |
--diagnostic-report-signal=... |
causes diagnostic report to be produced on provided signal. Unsupported in Windows. (default: SIGUSR2) |
--diagnostic-report-uncaught-exception |
generate diagnostic report on uncaught exceptions 产生报告当出现未捕获的异常 |
--diagnostic-report-directory=... |
define custom report pathname. (default: current working directory of Node.js process) |
--diagnostic-report-filename=... |
define custom report file name. (default: YYYYMMDD.HHMMSS.PID.SEQUENCE#.txt) |
参考

若有收获,就点个赞吧
0 人点赞
