gremlin-server 是tinkerpop3提供的远程API.
他的具体配置可见:
https://github.com/aws/graph-notebook
最终是要在jupyter中完成可视化效果,需要:
- 安装并配置gremlin-server
- 安装并配置jupyter
- 安装并配置graph-notebook
1. gremlin-server
https://github.com/aws/graph-notebook/tree/main/additional-databases/gremlin-server
安装最新版gremlinserver, 根据上述连接配置就可以了。这里主要是打开HTTP服务, 注意gremlin-server默认的图数据库是tinkergraph。
开启后你的gremlin-server就可以访问了, 默认是localhost的8182端口。
连接服务端的话我用的是python,需要安装gremlinpython库:
https://pypi.org/project/gremlinpython/
from gremlin_python.process.anonymous_traversal import traversalfrom gremlin_python.driver.driver_remote_connection import DriverRemoteConnectiong = traversal().withRemote(DriverRemoteConnection('ws://localhost:8182/gremlin','g'))
这样就可以连接了(这里是ws连接)。
jupyter+graph-notebook
jupyter安装就按个anaconda就行了
主要是如何安装graph-notebook并配置连接gremlin。
查询
gremlin有两种方式,对于jvm语言可以直接在jvm上使用。 其他情况可以开一个gremlin-server通过网络交互使用。
使用python连接gremlin-server,有两种查询方式,一种是”原生”利用即python即gremlin-client。另一种是,python写client查询语句然后使用gremlin.client()将查询发送出到远程client:
# basic-client.py## Connect to a Gremlin Server using a client connection.## Note that in this case the Gremlin queries are sent to the server as text strings.# To see an example of using Gremlin byte code instead see the glv-client.py example.## This example code assumes that the GremlinPython library has been installed using:## pip install gremlinpython## Import some classes we will need to talk to our graphfrom gremlin_python.driver.client import Client# Path to our graph (this assumes a locally running Gremlin Server)# Note how the path is a Web Socket (ws) connection.client = Client('ws://localhost:8182/gremlin','g')query = """g.V().hasLabel('airport').sample(30).order().by('code').local(__.values('code','city').fold()).toList()"""result = client.submit(query).all().result()client.close()
reference: https://github.com/krlawrence/graph/blob/master/sample-code/basic-client.py

如果出现了以上错误(Cannot run the event loop while another loop is running),有效解决:
!pip install nest_asyncioimport nest_asyncionest_asyncio.apply()
reference: https://blog.csdn.net/weixin_35757704/article/details/108812809
使用 graph-notebook
使用jupyter哈市主要为了辅助做一些小笔记,那么在里边能嵌入图就更好啦:
https://github.com/aws/graph-notebook
现在我们要在jupyter中安装graph-notebook, 有效的解决方案就是按着github说明在终端一步一步做就好啦:
# pin specific versions of Jupyter, Tornado, and RDFLib dependenciespip install notebook==5.7.13pip install tornado==4.5.3pip install rdflib==5.0.0# install the packagepip install graph-notebook# install and enable the visualization widgetjupyter nbextension install --py --sys-prefix graph_notebook.widgetsjupyter nbextension enable --py --sys-prefix graph_notebook.widgets# copy static html resourcespython -m graph_notebook.static_resources.installpython -m graph_notebook.nbextensions.install# copy premade starter notebookspython -m graph_notebook.notebooks.install --destination ~/notebook/destination/dir# start jupyterjupyter notebook ~/notebook/destination/dir
注意版本,一把梭安装之后,再开启jupyter我们就有graph_notebook_config的magic cell使用了,开启我们的gremlin-server, 连接:
%%graph_notebook_config{"host": "localhost","port": 8182,"ssl": false}
导张图进去:
%%gremlingraph.io(graphml()).readGraph('/Your_path/air-routes.graphml') // TinkerPop 3
查一下:
%%gremlin -p v,oute,inv,oute,inv,oute,invg.V().has('airport', 'code', 'AUS').repeat(outE().inV().simplePath()).until(has('code', 'WLG')).limit(5).path().by('code').by('dist')
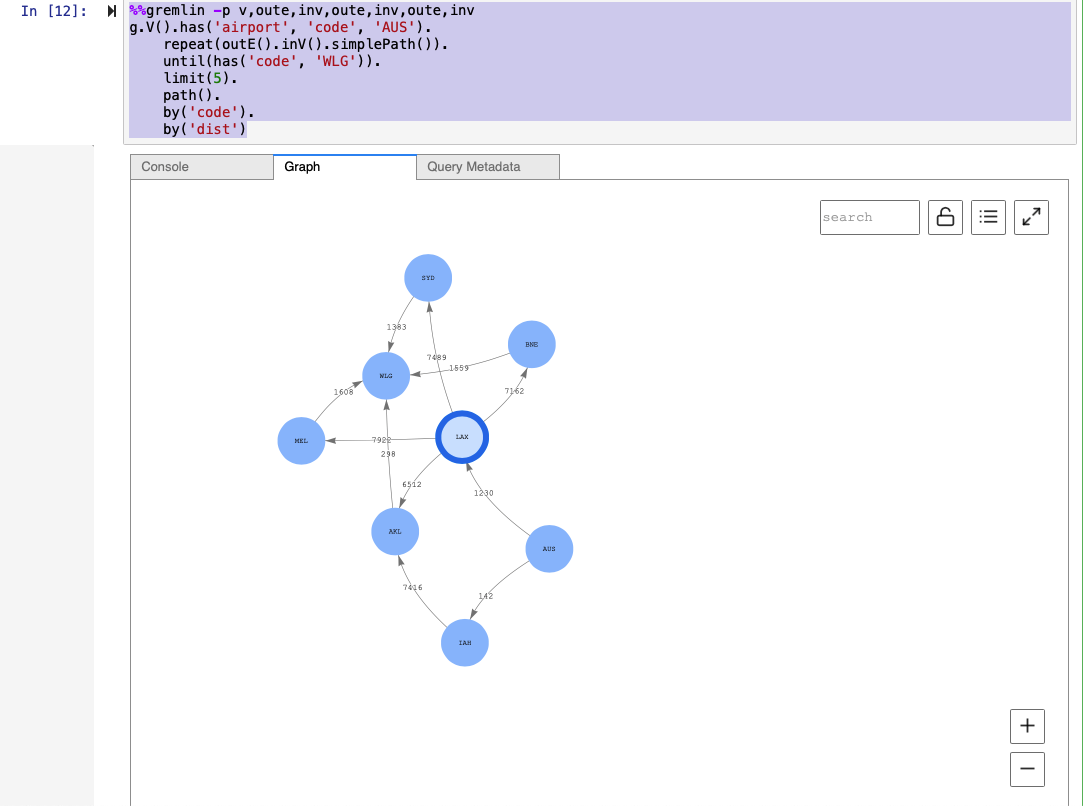
灰常的棒

若有收获,就点个赞吧
0 人点赞
