0x01 环境
phpstorm phpstudy Windows10
0x02 配置过程
1.下载对应的xdebug.dll
将PHPINFO内容复制到http://xdebug.org/wizard
2.配置php.ini,添加如下配置
[XDebug]xdebug.profiler_output_dir="D:\phpStudy1\PHPTutorial\tmp\xdebug"xdebug.trace_output_dir="D:\phpStudy1\PHPTutorial\tmp\xdebug"zend_extension = D:\phpStudy1\PHPTutorial\php\php-7.2.1-nts\ext\php_xdebug-2.9.8-7.2-vc15-nts.dllxdebug.auto_trace=1xdebug.collect_params=1xdebug.collect_return=1xdebug.profiler_enable = 1xdebug.profiler_output_name = "cachegrind.out.%t.%p"xdebug.remote_enable = 1xdebug.remote_handler = "dbgp"xdebug.idekey = PHPSTORMxdebug.remote_host = "127.0.0.1"xdebug.remote_port = 9001
3.phpstorm配置
配置位置 File | Settings | Languages & Frameworks | PHP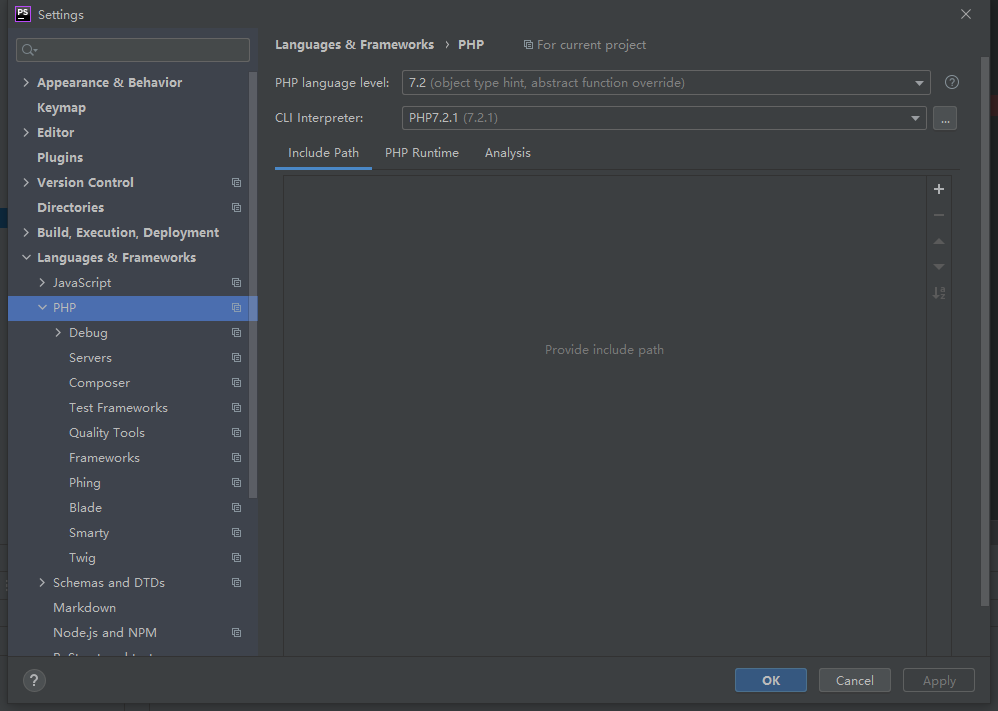
配置位置 File | Settings | Languages & Frameworks | PHP | Debug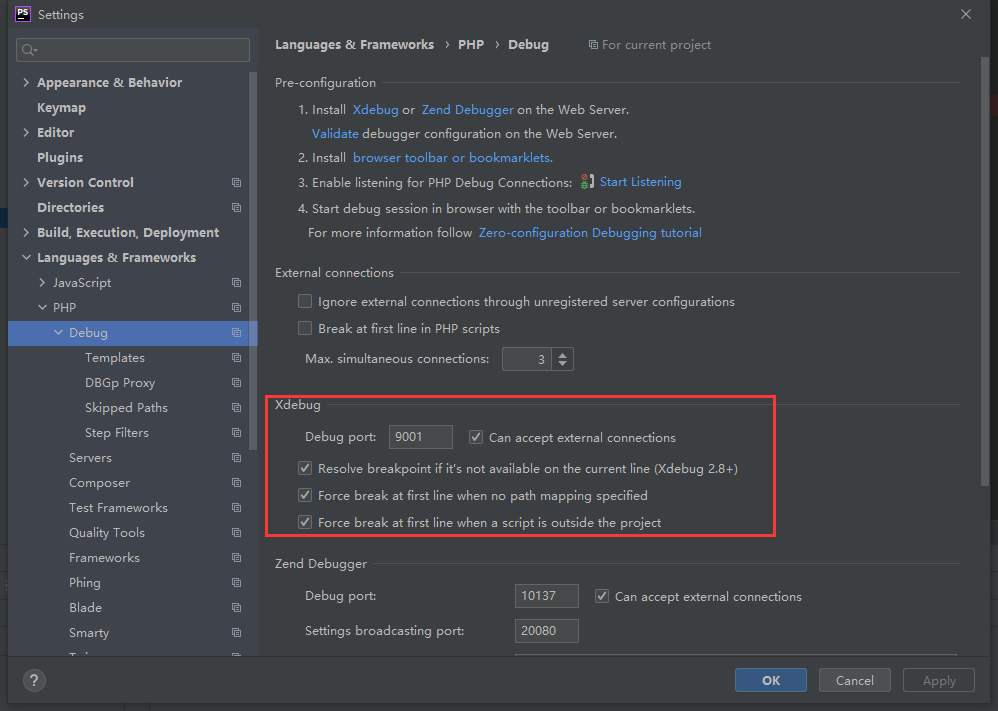
配置位置 File | Settings | Languages & Frameworks | PHP | Debug | DBGp Proxy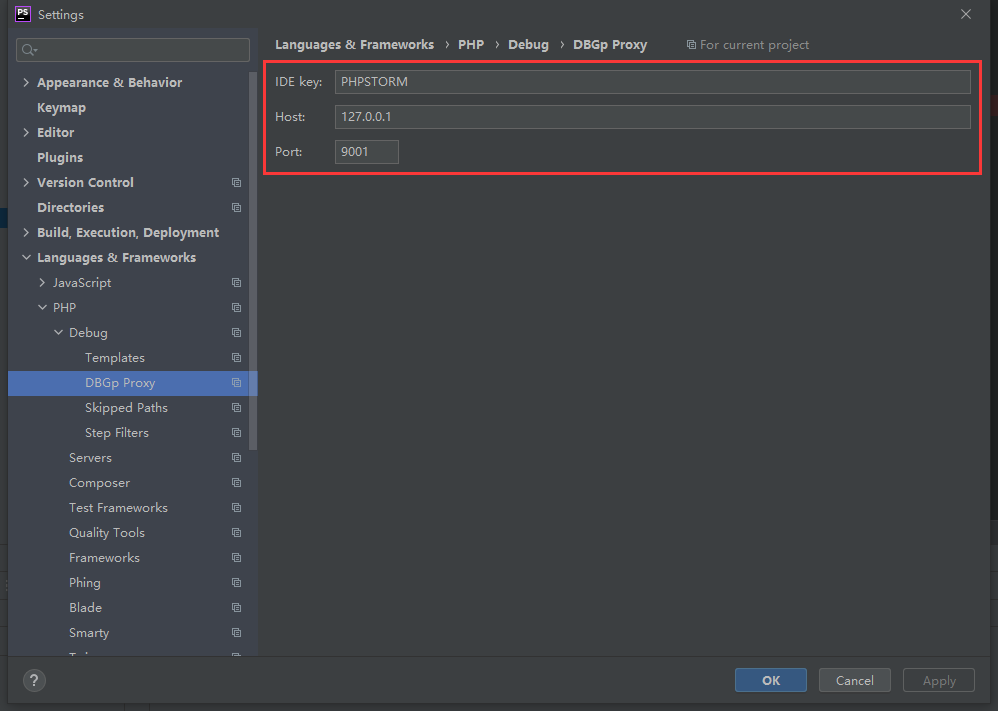
配置位置 File | Settings | Languages & Frameworks | PHP | Servers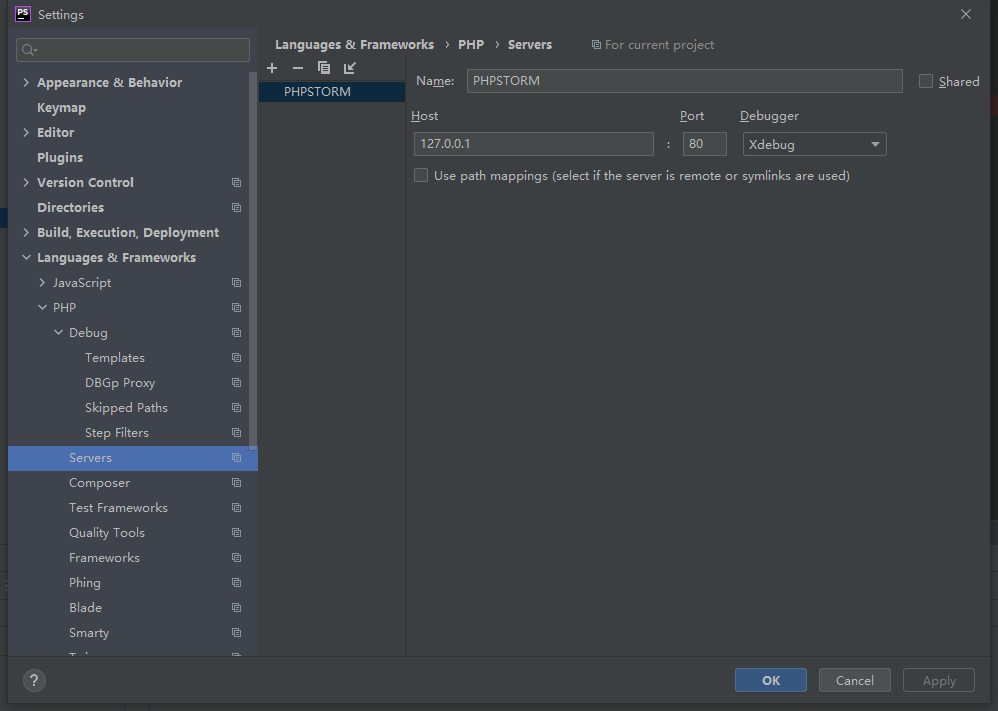
配置位置 Run | + | PHP Web Page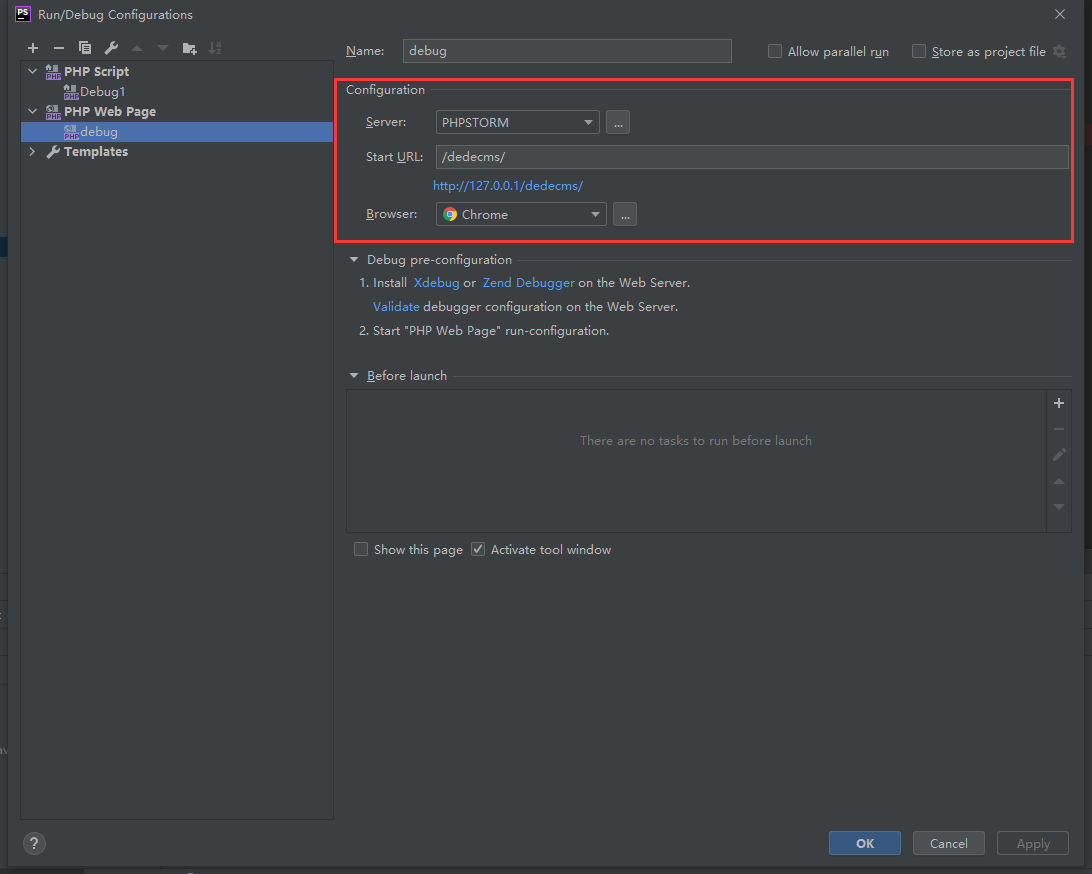

若有收获,就点个赞吧
0 人点赞
