笔记2008/08/21-持续更新
Heap Dump堆转储
A heap dump is a snapshot of the memory of a Java process at a certain point of time.There are different formats for persisting this data, and depending on the format, maycontain different pieces of information; but, in general, the snapshot contains informationabout the Java objects and classes in the heap at the moment the snapshot was triggered.In some cases, a full GC is triggered before the heap dump is written so it containsinformation about the remaining objects.
The Memory Analyzer is able to work with HPROF binary heap dumps,IBM system dumps (old versions require preprocessing), and IBM portable heap dumps (PHD)from a variety of platforms.
Typical information which can be found in heap dumps (depending on the heap dump type):
•All Objects
Class, fields, primitive values and references
•All Classes
Classloader, name, super class, static fields
When MAT parses IBM system dumps, the size of classes includes some of the amountof native memory in the Java process (but outside of the Java heap) which is relatedto those classes such as native memory for bytecode and JIT compiled code for the classmethods. In some cases, this may cause the total size reported on the Overview pane toexceed the maximum Java heap size. This calculation may be disabled using an optionin the MAT configuration.
•Garbage Collection Roots
Objects defined to be reachable by the JVM
•Thread Stacks and Local Variables
The call-stacks of threads at the moment of the snapshot, and per-frame information about local objects
A heap dump does not contain allocation information so it cannotresolve questions like who had created the objects and where theyhave been created.
Reachability可达性
Objects in a heap dump have references to other objects. These can either be via field references (for simple objects), array elements (for object arrays) or via various hidden references. For instance every object contains a reference to its type, and each class contain a reference to the class loader which loaded the class.
These objects and references form a directed graph. The objects are the nodes, the references are the directed links between the nodes. The garbage collection roots are the roots of this graph.
Reachable
An object is reachable from another object if there is a path following the directed links from the source object to the destination object.
Unreachable object
If there is no path from a garbage collection root to an object then it is unreachable. There is then no way a legitimate Java program can every get access to this object, so it is safe for the Java virtual machine to discard this object from the heap. This process of determining unreachable objects and discarding them, thus making room for more objects to be allocated as required, is called garbage collection.
Unreachable objects不可达对象
Find out more about objects that could or should be garbage collected.
Motivation
Sometimes a heap dump contains objects which would be removed at the next garbage collection.These are objects which are unreachable from the garbage collection roots.By default, Memory Analyzer removes these objects as part of the parse process as normally they are notimportant in determining a memory leak. If the heap dump is generated as a result of an OutOfMemoryErrorthen the Java virtual machine will usually have performed a garbage collection operation to attempt tofree space for the new object, so there will not be those objects in the heap dump file.There is a chance that the garbage collection was not performed, for example if theobject to be allocated was so huge that it was obvious to the JVM that no amount of garbage collectioncould free enough space, or if the heap dump was triggered by another event.
Sometimes however, it is interesting to investigate these unreachable objects. For example if the applicationis spending a lot of time garbage collecting then it may be allocating and discarding more objectsthan is sensible. The types of the objects which could be discarded at the next garbage collectiongives a clue as to which temporary objects the application is causing to be allocated.When acquiring a heap dump for this purpose using the Memory Analyzer,do not use the live=true option as that would discard unreachable objectsbefore the heap dump is generated.
Another reason for unreachable objects is if Memory Analyzerhas been configured to discard objects on parsing to keep thenumber of remaining objects small enough for Memory Analyzer tohandle. See Enable discard (experimental) for details.
[
](http://127.0.0.1:1798/help/topic/org.eclipse.mat.ui.help/concepts/gcroots.html)
Shallow vs. Retained Heap浅堆与保留堆
Shallow heap is the memory consumed by one object. An object needs 32 or 64 bits(depending on the OS architecture) per reference, 4 bytes perInteger, 8 bytes per Long, etc. Depending on the heap dump format thesize may be adjusted (e.g. aligned to 8, etc…) to model better thereal consumption of the VM.
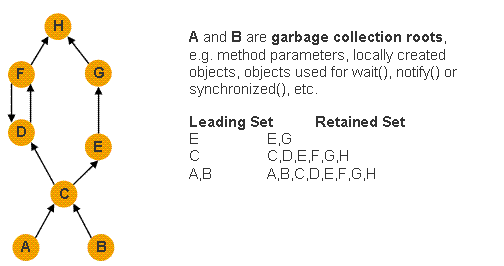
Retained set of X is the set of objects which would be removed by GC when X is garbagecollected.
Retained heap of X is the sum of shallow sizes of all objects in the retained setof X, i.e. memory kept alive by X.
Generally speaking, shallow heap of an object is its sizein the heap and retained size of the same object is the amount ofheap memory that will be freed when the object is garbage collected.
The retained set for a leading set of objects, such as allobjects of a particular class or all objects of all classes loaded bya particular class loader or simply a bunch of arbitrary objects, isthe set of objects that is released if all objects of that leadingset become unaccessible. The retained set includes these objects aswell as all other objects only accessible through these objects. Theretained size is the total heap size of all objects contained in theretained set.
The Minimum Retained Size gives a good (under)estimation of theretained size which is calculated ways faster than theexact retained size of a set of objects. It only depends on thenumber of objects in the inspected set, not the number of objects inthe heap dump.
Dominator Tree支配树
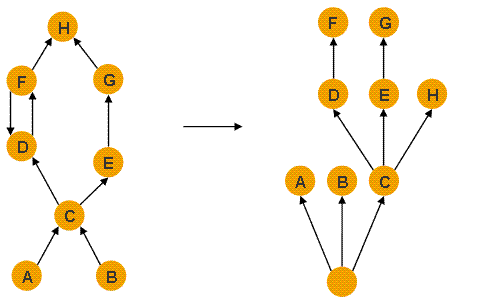
Memory Analyzer provides a dominator tree of the object graph.The transformation of the object reference graph into adominator tree allows you to easily identify the biggest chunks ofretained memory and the keep-alive dependencies among objects.Bellow is an informal definition of the terms.
An object x dominatesan object y if every path in the object graph from the start (or theroot) node to y must go through x.
The immediate dominatorx of some object y is the dominator closest to the object y.
A dominator treeis built out of the object graph. In the dominator tree each objectis the immediate dominator of its children, so dependencies betweenthe objects are easily identified.
The dominator tree has the following important properties:
•The objects belonging to the sub-tree of x(i.e. the objects dominated by x) represent the retained set of x.
•If xis the immediate dominator of y, then the immediate dominator of xalso dominates y, and so on.
•The edges in the dominator tree do not directly correspond toobject references from the object graph.
Garbage Collection Roots
A garbage collection root is an object that is accessible from outside the heap. The following reasons make an object a GC root:
- System Class
Class loaded by bootstrap/system class loader. For example, everything from the rt.jar like java.util.*
- JNI Local
Local variable in native code, such as user defined JNI code or JVM internal code.
- JNI Global
Global variable in native code, such as user defined JNI code or JVM internal code.
- Thread Block
Object referred to from a currently active thread block.
- Thread
A started, but not stopped, thread.
- Busy Monitor
Everything that has called wait() or notify() or that is synchronized. For example, by calling synchronized(Object) or by entering a synchronized method. Static method means class, non-static method means object.
- Java Local
Local variable. For example, input parameters or locally created objects of methods that are still in the stack of a thread.
- Native Stack
In or out parameters in native code, such as user defined JNI code or JVM internal code. This is often the case as many methods have native parts and the objects handled as method parameters become GC roots. For example, parameters used for file/network I/O methods or reflection.
- Finalizable
An object which is in a queue awaiting its finalizer to be run.
- Unfinalized
An object which has a finalize method, but has not been finalized and is not yet on the finalizer queue.
- Unreachable
An object which is unreachable from any other root, but has been marked as a root by MAT to retain objects which otherwise would not be included in the analysis.
- Java Stack Frame
A Java stack frame, holding local variables. Only generated when the dump is parsed with the preference set to treat Java stack frames as objects.
- Unknown
An object of unknown root type. Some dumps, such as IBM Portable Heap Dump files, do not have root information. For these dumps the MAT parser marks objects which are have no inbound references or are unreachable from any other root as roots of this type. This ensures that MAT retains all the objects in the dump.
Leak Identification泄漏识别
Analyze a component for possible memory waste andother inefficiencies.
Introduction
A heap dump contains millions of objects. But which of thosebelong to your component? And what conclusions can you draw fromthem? This is where the Component Report can help.
Before starting, one has to decide what constitutes a component.Typically, a component is either a set of classes in a common root packageor a set of classes loaded by the same class loader.
Using this root set of objects, the component report calculates acustomized retained set. This retained set includes all objects keptalive by the root set. Additionally, it assumes that all objectsthat have become finalizableactually have been finalized and that also all soft references havebeen cleared.
Executing the Component Report
To run the report for a common root package, select the componentreport from the tool bar and provide a regular expression to matchthe package: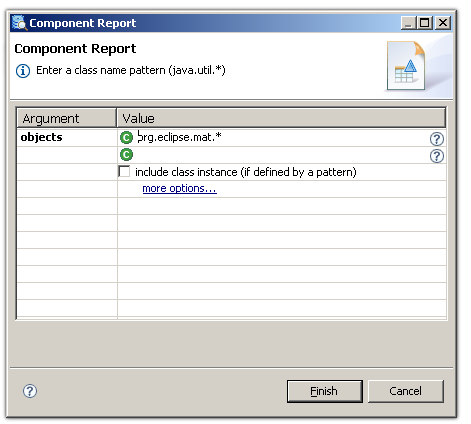
Regular expression to match common root package to be used for the component report.
Alternatively, one can group the class histogram by class loaderand then right-click the appropriate class loader and select thecomponent report:
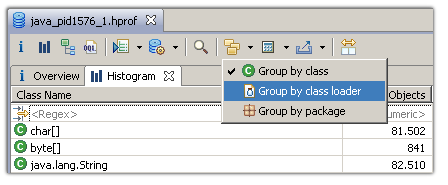
Group histogram by class loader.
Overview
The component report is rendered as HTML. It is stored in a ZIPfile next to the heap dump file.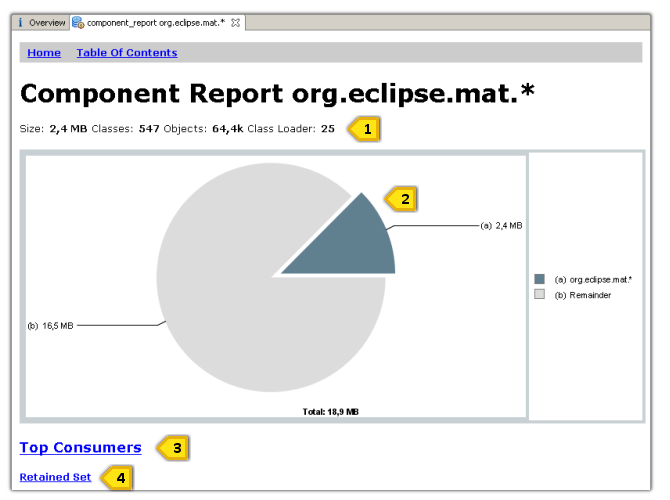
Overview section of the component report.
1.Details about the size, the number of classes, thenumber of objects and the number of different class loaders.
2.The pie chart shows the size of the component relative tothe total heap size.See Pie Chart Linksfor links from pie charts.
3.The Top Consumerssection lists the biggest object, classes, class loader andpackages which are retained by the component. It provides a goodoverview of what is actually kept alive by the component.
4. Retained Set displays all objects grouped by classes which are retained.
Duplicate Strings
Duplicate Strings are a prime example for memory waste: multiplechar arrays with identical content. To find the duplicates, thereport groupsthe char arrays by their value. It lists all char arrays with 10 ormore instances with identical content.
The content of the char arrays typically gives away ideas how toreduce the duplicates: •Sometimes the duplicate strings are used as keys or values in hash maps. For example, when reading heap dumps, MAT itself used to readthe char constant denoting the type of an attribute into memory.It turned out that the heap was littered with many ‘L’s forreferences, ‘B’s for bytes, and ‘Z’s for booleans, etc. Byreplacing the charwith an int, MAT could save some of the precious memory. Alternatively,Enumerations could do the same trick.
•When reading XML documents, fragments like UTF-8, tag names or tag content remains in memory. Again, think aboutusing Enumerations for the repetitive content.
•Another option is interningthe String. This adds the string to a pool of strings which ismaintained privately by the class String. For each unique string, the pool will keep on instance alive.However, if you are interning, make sure do it responsibly: A big pool of strings will have maintenance costs and one cannotrely on interned strings being garbage collected.
Empty Collections
Even if collections are empty, they usually consume memorythrough their internal object array. Imagine a tree structure whereevery node eagerly creates array lists to hold its children, butonly a few nodes actually possess children.
One remedy is the lazy initialization of the collections: create thecollection only when it is actually needed. To find out who isresponsible for the empty collections, use the immediatedominatorscommand.
Collection Fill Ratio
Just like empty ones, collections with only a few elementsalso take up a lot of memory. Again, the backing array of thecollection is the main culprit. The examination of the fill ratiosusing a heap dump from a production system gives hints to whatinitial capacity to use.
Soft Reference Statistics
Soft references are cleared by the virtual machine in response tomemory demand. Usually, soft references are used to implementcaches: keep the objects around while there is sufficient memory,clear the objects if free memory becomes low. •Usually objects are cached, because they are expensiveto re-create. Across a whole application, soft referenced objectsmight carry very different costs. However, the virtual machinecannot know this and clears the objects on some least recentlyused algorithm. From the outside, this is very unpredictable anddifficult to fine tune.
•Furthermore, soft references can impose a stop-the-worldphase during garbage collection. Oversimplified, the GC marks theobject graph behind the soft references while the virtual machineis stopped.
The report shows: •CommentAn example is the following:
A total of 217,035 java.lang.ref.SoftReference objects have been found, which softly reference 38,874 objects.77,745 objects totalling 20.8 MB are retained (kept alive) only via soft references.No objects totalling 0 B are softly referenced and also strongly retained (kept alive) via soft references.
•Histogram of Soft ReferencesThese are the reference objects which are instances of a type or subclass of java.lang.ref.SoftReference
•Histogram of Softly ReferencedThese are the objects which the referent fields point to.
•Only Softly RetainedThese are all the objects retained the objects in the Only Softly Retainedtable. All these objects could be freed in the next garbage collection cycleif the VM was short of memory.
•Referents strongly retained by soft referenceThese could indicate a possible memory leak, as the referent field cannever be cleared while there is a strong path from the soft referencesto the referenced objects.
•If there are objects in the Referents strongly retained by soft referencetable then the Reference Leakis run to examine the possible leaks in more detail.
Note: This might not show the same problems because the initial report Referents strongly retained by soft reference is done forall references of a particular type whereas the Reference Leakquery operates on individual references.
Weak Reference Statistics
Weak references are cleared by the virtual machine when theobject referred to by the referent is no longer strongly reachableor softly reachablevia another path.Usually, weak references are used to retain extra data associatedwith an object in a java.util.WeakHashMapor to maintain a canonical mapping as the canonical object canbe retrieved if it is in use anywhere, but if no longer in usethen the mapping table will not keep it alive.
The report follows the format of the Soft Referencesection above. An example of the comment is
A total of 620 java.lang.ref.WeakReference objects have been found, which weakly reference 436 objects.
No objects totalling 0 B are retained (kept alive) only via weak references.
Possible Memory Leak 301 objects totalling 7.1 KB are weakly referenced and also strongly retained (kept alive) via weak references.
Finalizer Statistics
Objects which implement the finalizemethod are included in the component report, because those objectscan have serious implications for the memory of a Java VirtualMachine: •Whenever an object with finalizer is created, a corresponding java.lang.ref.Finalizerobject is created. If the object is only reachable via itsfinalizer, it is placed in the queue of the finalizer thread andprocessed. Only then the next garbage collection will actuallyfree the memory. Therefore it takes at least two garbagecollections until the memory is freed.
•When using Sun’s current virtual machine implementation,the finalizer thread is a single thread processing the finalizerobjects sequentially. One blocking finalizer queue therefore caneasily keep alive big chunks of memory (all those other objectsready to be finalized).
•Depending on the actual algorithm, finalizer may require a stop-the-worldpause during garbage collections. This, of course, can haveserious implications for the responsiveness of the wholeapplication.
•Last not least, the time of execution of the finalizer isup to the VM and therefore unpredictable.
Map Collision Ratios
This sections analyzes the collision ratios of hash maps. Mapsplace the values in different buckets based on the hash code of thekeys. If the hash code points to the same bucket, the elementsinside the bucket are typically compared linearly.
High collision ratios can indicate sub-optimal hash codes.This is not a memory problem (a better hash code does not savespace) but rather performance problem because of the linear accessinside the buckets.
Reference Leak-引用泄漏
Find incorrect uses of soft or weak references.
Motivation
Soft references java.lang.ref.SoftReference and weak references java.lang.ref.WeakReference are used to keep references to objects which can be cleared by garbage collection if there are no other strong references.
Soft references can be used for object caching, so that an object can usually be retained for fast access, but if memory is tight then garbage collection can break the link and free the object. Next time it is needed then the application program can regenerate the object.
Weak references can be used in a weak hash map java.util.WeakHashMap to hold information associated with another object, but if that object is no longer available then the associated information can be freed too.
Sometimes an error in the application program can mean that the object which is supposed to be softly or weakly referenced is also strongly retained by the reference object. For example the key of a weak hash map is weakly retained, but if there is a strong reference to it from the value of the weak hash map entry then the object will never be freed.
Operation
This query performs the following steps:
- For each reference object supplied to the query, find the object referred to by the reference object via the reference field.
- Find all the objects strongly retained by the reference object.
- Find if the object from the first step is also in the second list. If so:
- Generate a tree with a path showing the reference object, the referent and the strong path to the referent.
- Generate a tree showing paths from GC roots to the reference object including showing field names.
This type of query is also performed by the component report.
Arguments
| Argument | Description |
|---|---|
| objects | Reference objects for which the reference leaks query should be run. |
| -referent_attribute | The referent field name for the reference objects. The default is referent |
| -maxresults | The maximum number of objects for which a tree should be shown. |
| -maxobjs | The maximum number of objects to be examined for leaks. A random selection of the total objects will be chosen. |
| -factor | For common paths, how much to truncate the path as the number of objects reduces. |

若有收获,就点个赞吧
0 人点赞
