时间分析
在本章中,我们将改进游戏实现的性能并利用时间分析来辅助我们的工作。
使用 window.performance.now 函数创建每秒帧数计时器
当我们研究如何加速游戏渲染时,这个 FPS 计时器将非常有用。
我们首先添加一个 fps 对象到 wasm-game-of-life/www/index.js:
const fps = new class {constructor() {this.fps = document.getElementById('fps');this.frames = [];this.lastFrameTimeStamp = performance.now();}render() {// Convert the delta time since the last frame render into a measure// of frames per second.const now = performance.now();const delta = now - this.lastFrameTimeStamp;this.lastFrameTimeStamp = now;const fps = (1 / delta) * 1000;// Save only the latest 100 timings.this.frames.push(fps);if (this.frames.length > 100) {this.frames.shift();}// Find the max, min, and mean of our 100 latest timings.let min = Infinity;let max = -Infinity;let sum = 0;for (let i = 0; i < this.frames.length; i++) {sum += this.frames[i];min = Math.min(this.frames[i], min);max = Math.max(this.frames[i], max);}let mean = sum / this.frames.length;// Render the statistics.this.fps.textContent = `Frames per Second:latest = ${Math.round(fps)}avg of last 100 = ${Math.round(mean)}min of last 100 = ${Math.round(min)}max of last 100 = ${Math.round(max)}`.trim();}}();
接着,在每次 renderLoop 迭代时,我们调用 fps.render 函数:
const renderLoop = () => {fps.render(); // 新universe.tick();drawGrid();drawCells();animationId = requestAnimationFrame(renderLoop);};
最后,别忘了添加 fps 元素到 wasm-game-of-life/www/index.html,就在 <canvas> 上面:
<div id="fps"></div>
并添加CSS以使其格式更美观:
#fps {white-space: pre;font-family: monospace;}
瞧!刷新 http://localhost:8080,现在我们有一个 FPS 计数器!
用 console.time 和 console.timeEnd 计时每个 Universe::tick
需要测量每次 Universe::tick 调用的时间,我们可以使用 console.time 和 console.timeEnd,通过 web-sys crate。
首先,在 wasm-game-of-life/Cargo.toml 添加 web-sys 作为依赖:
[dependencies.web-sys]version = "0.3"features = ["console",]
因为每个 console.time 调用都应该有一个对应的 console.timeEnd 调用,方便将它们包装为一个 RAII类型 :
extern crate web_sys;use web_sys::console;pub struct Timer<'a> {name: &'a str,}impl<'a> Timer<'a> {pub fn new(name: &'a str) -> Timer<'a> {console::time_with_label(name);Timer { name }}}impl<'a> Drop for Timer<'a> {fn drop(&mut self) {console::time_end_with_label(self.name);}}
然后,我们可以通过将以下代码段添加到方法的顶部来计算每个 Universe::tick 需要多长时间:
let _timer = Timer::new("Universe::tick");
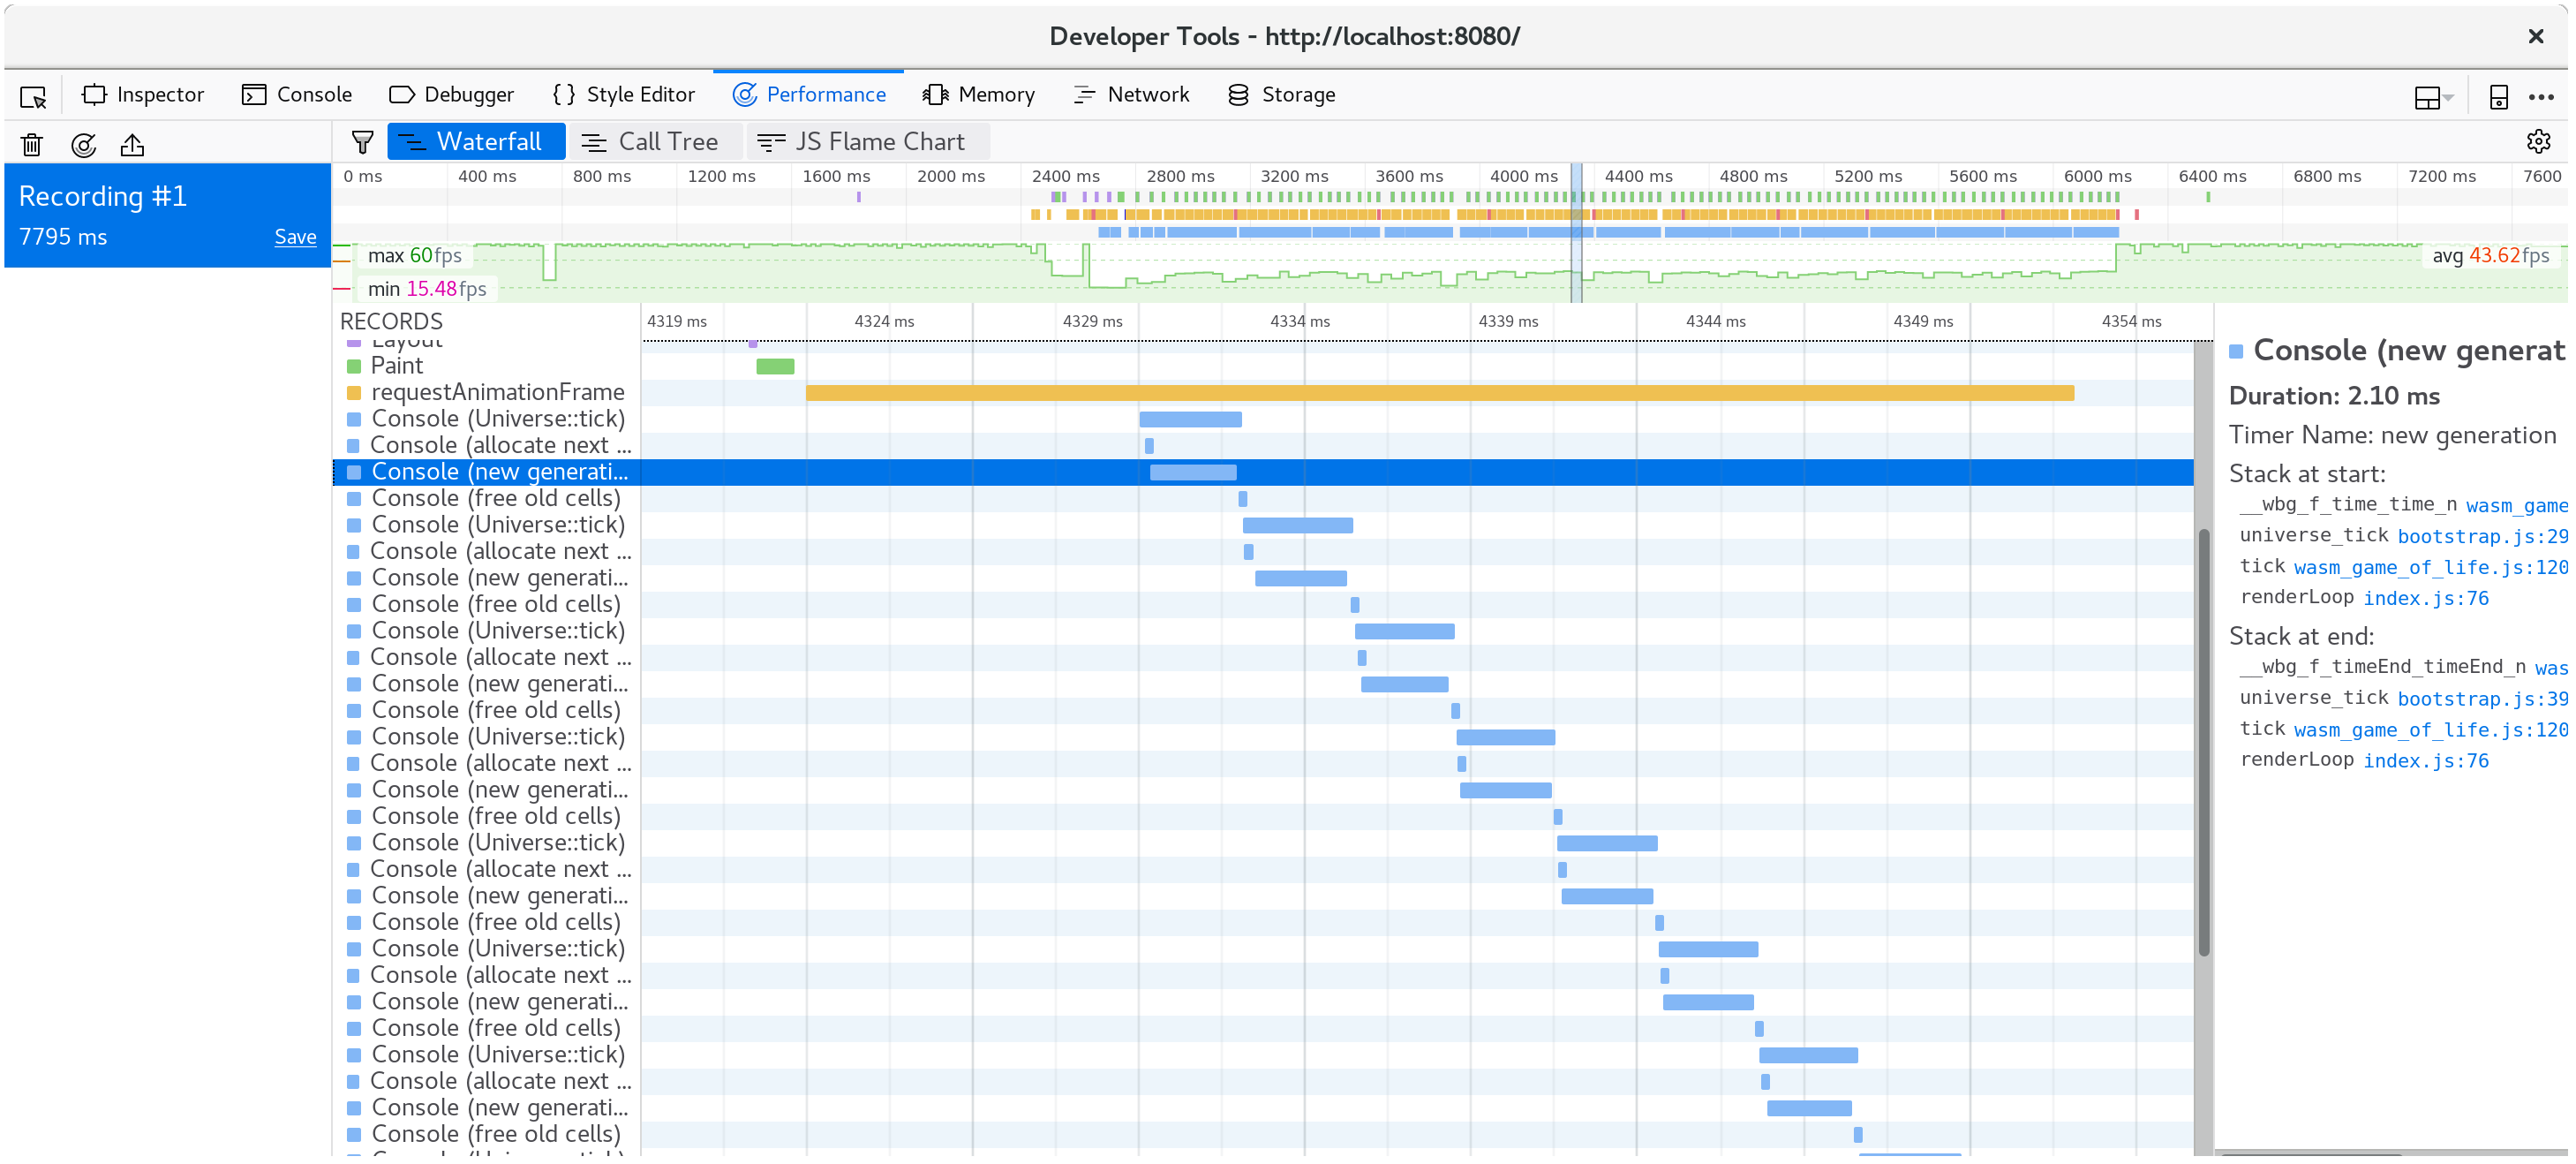
每次调用 Universe::tick 所用的时间现在都记录在控制台中:
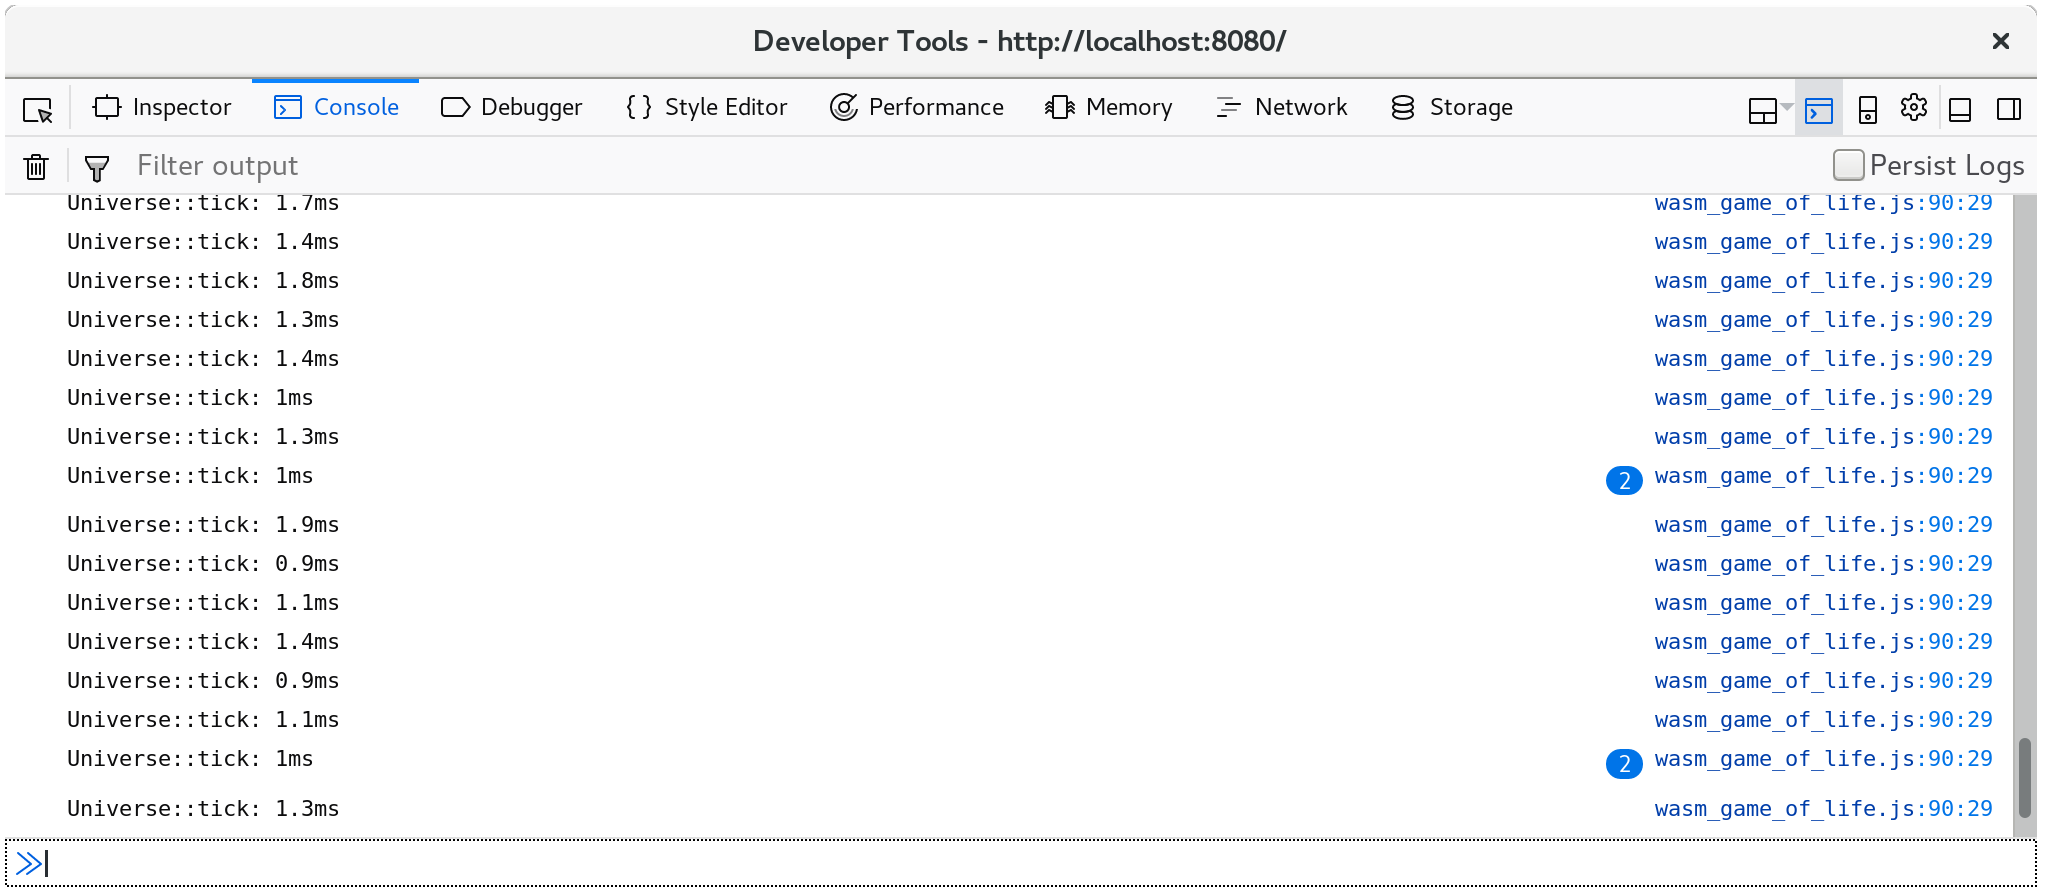
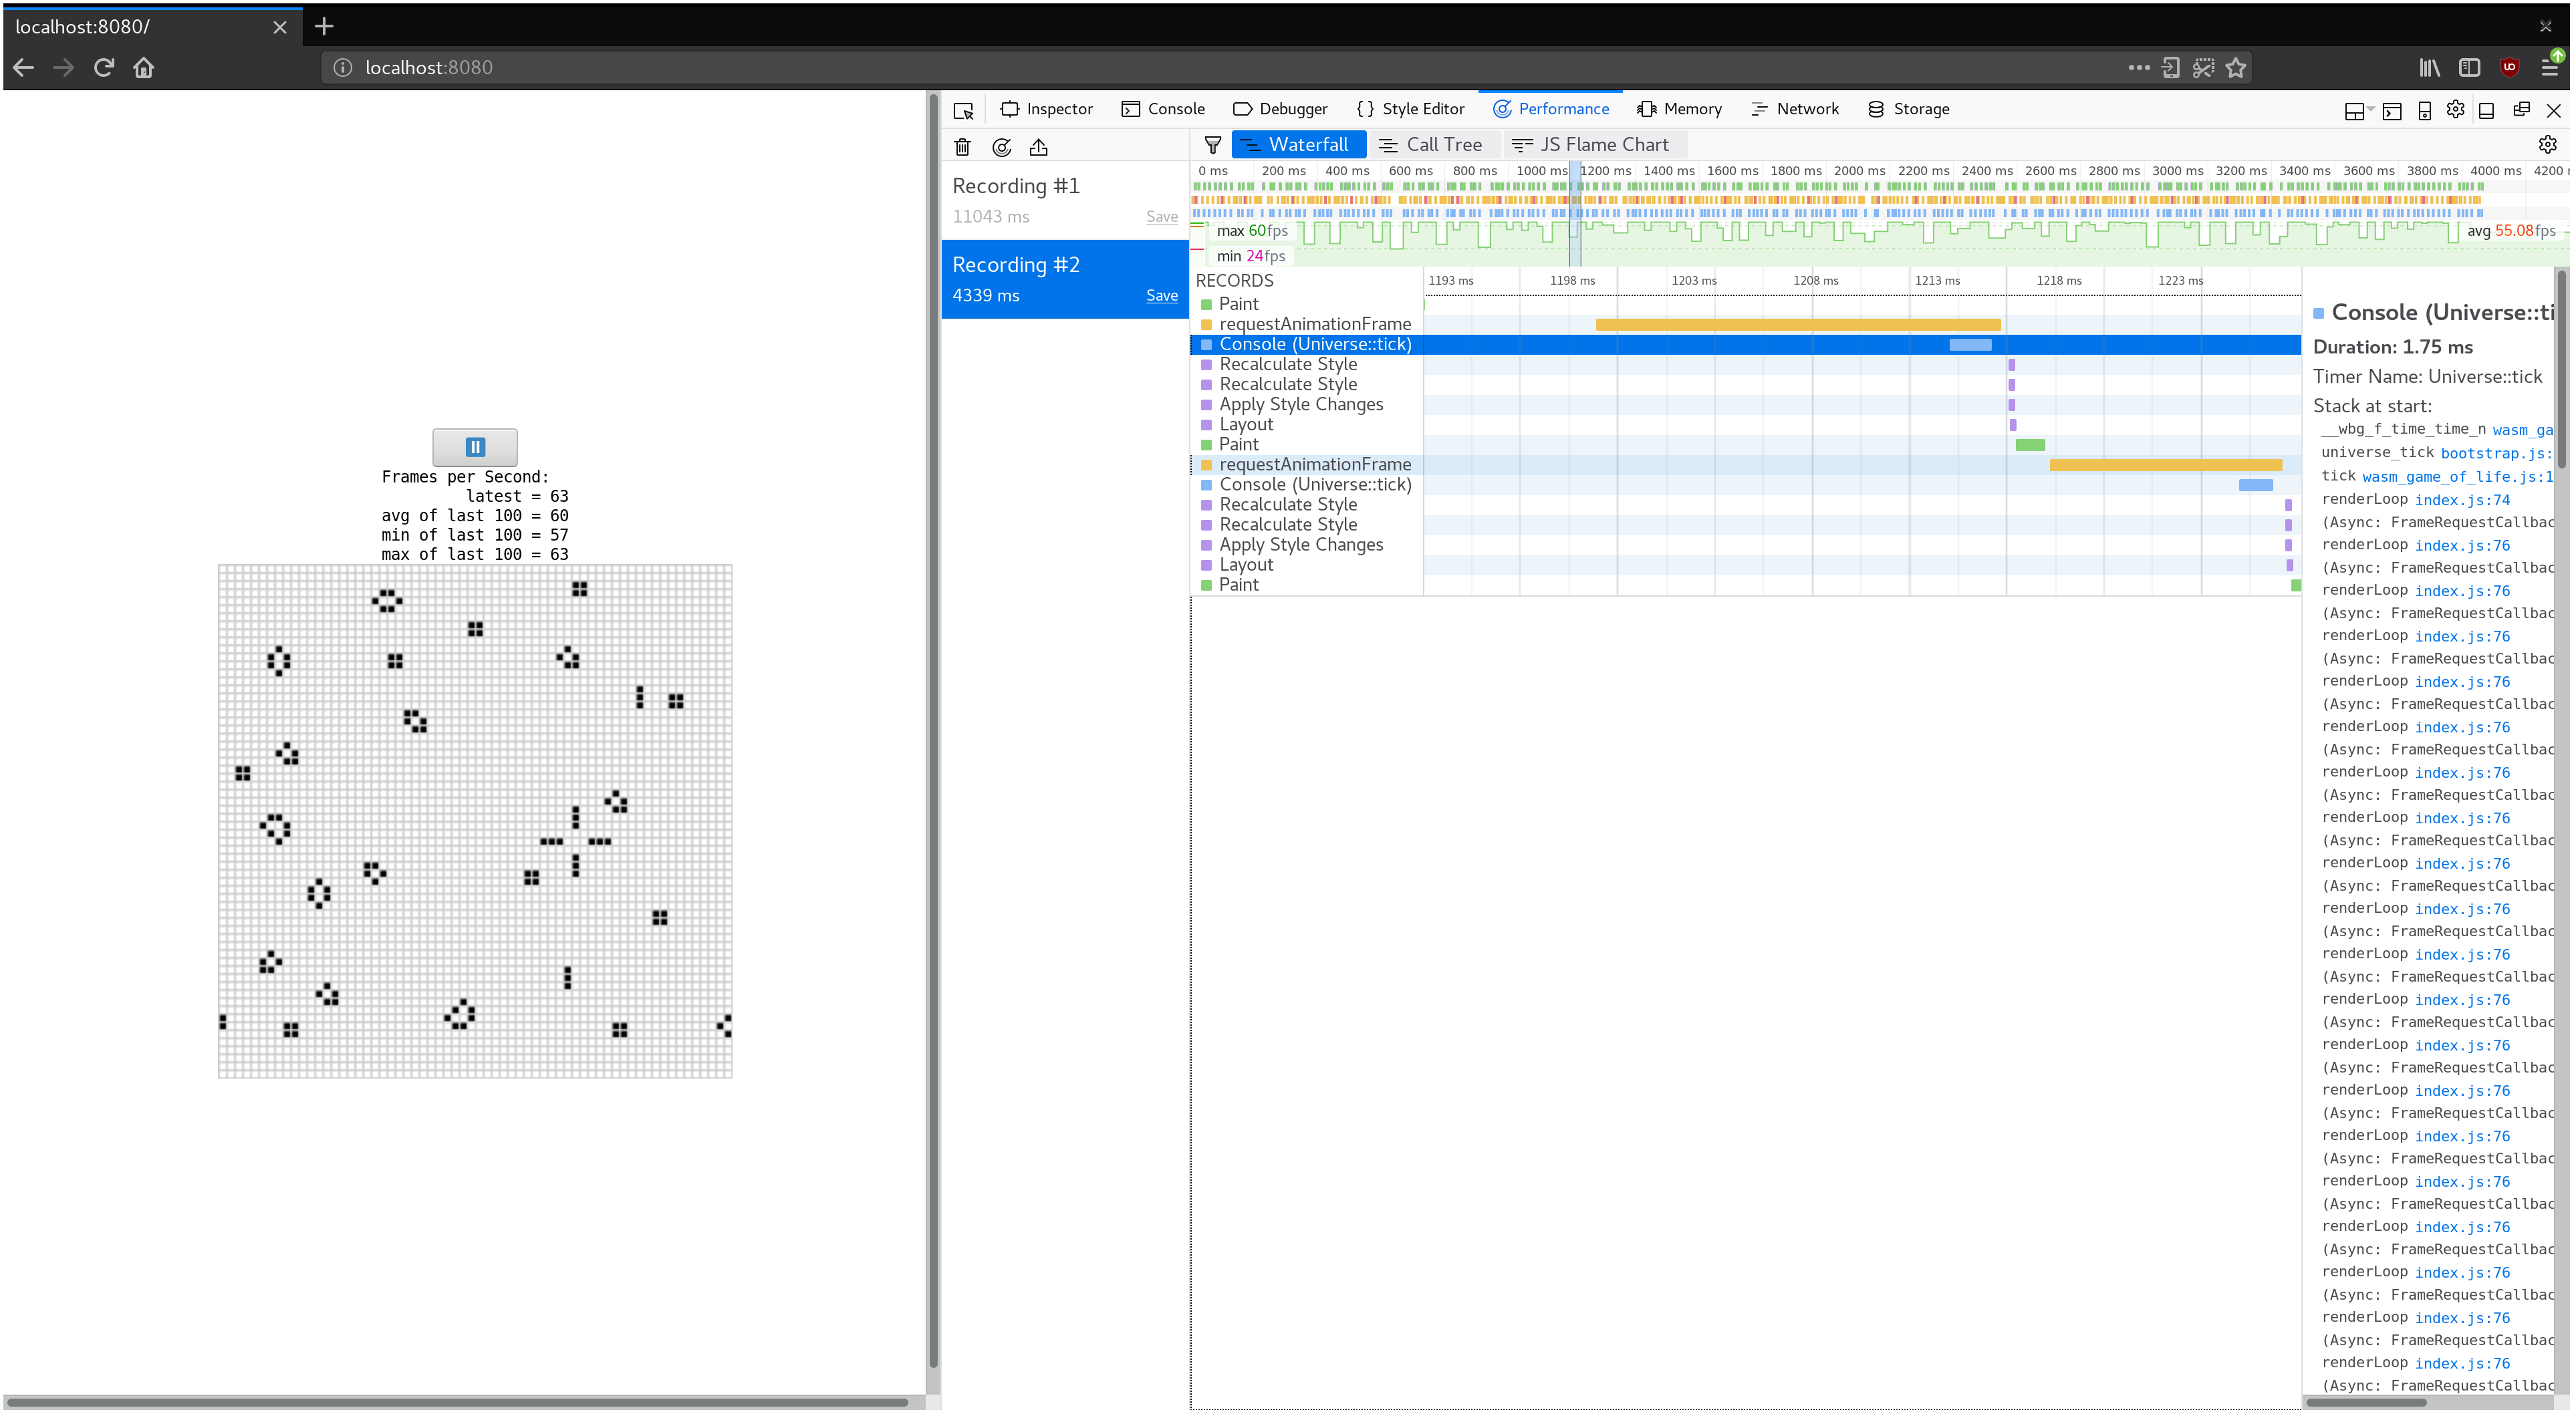
此外,console.time 和 console.timeEnd 对将显示在浏览器探查器的“时间线”或“瀑布”视图中:
扩大我们的游戏世界
⚠️ 本节使用Firefox的示例屏幕截图。虽然所有现代浏览器都有类似的工具,但使用不同的开发人员工具可能会有细微差别。 你提取的概要信息在本质上是相同的,但是你的里程数可能因你看到的视图和不同工具的命名而有所不同。
如果我们游戏宇宙变得更大会发生什么?
将 64x64 的宇宙替换为 128x128 的宇宙(通过修改 wasm-game-of-life/src/lib.rs 中的 Universe::new)会导致在我的机器上FPS从平滑的 60 下降到起伏的 40。
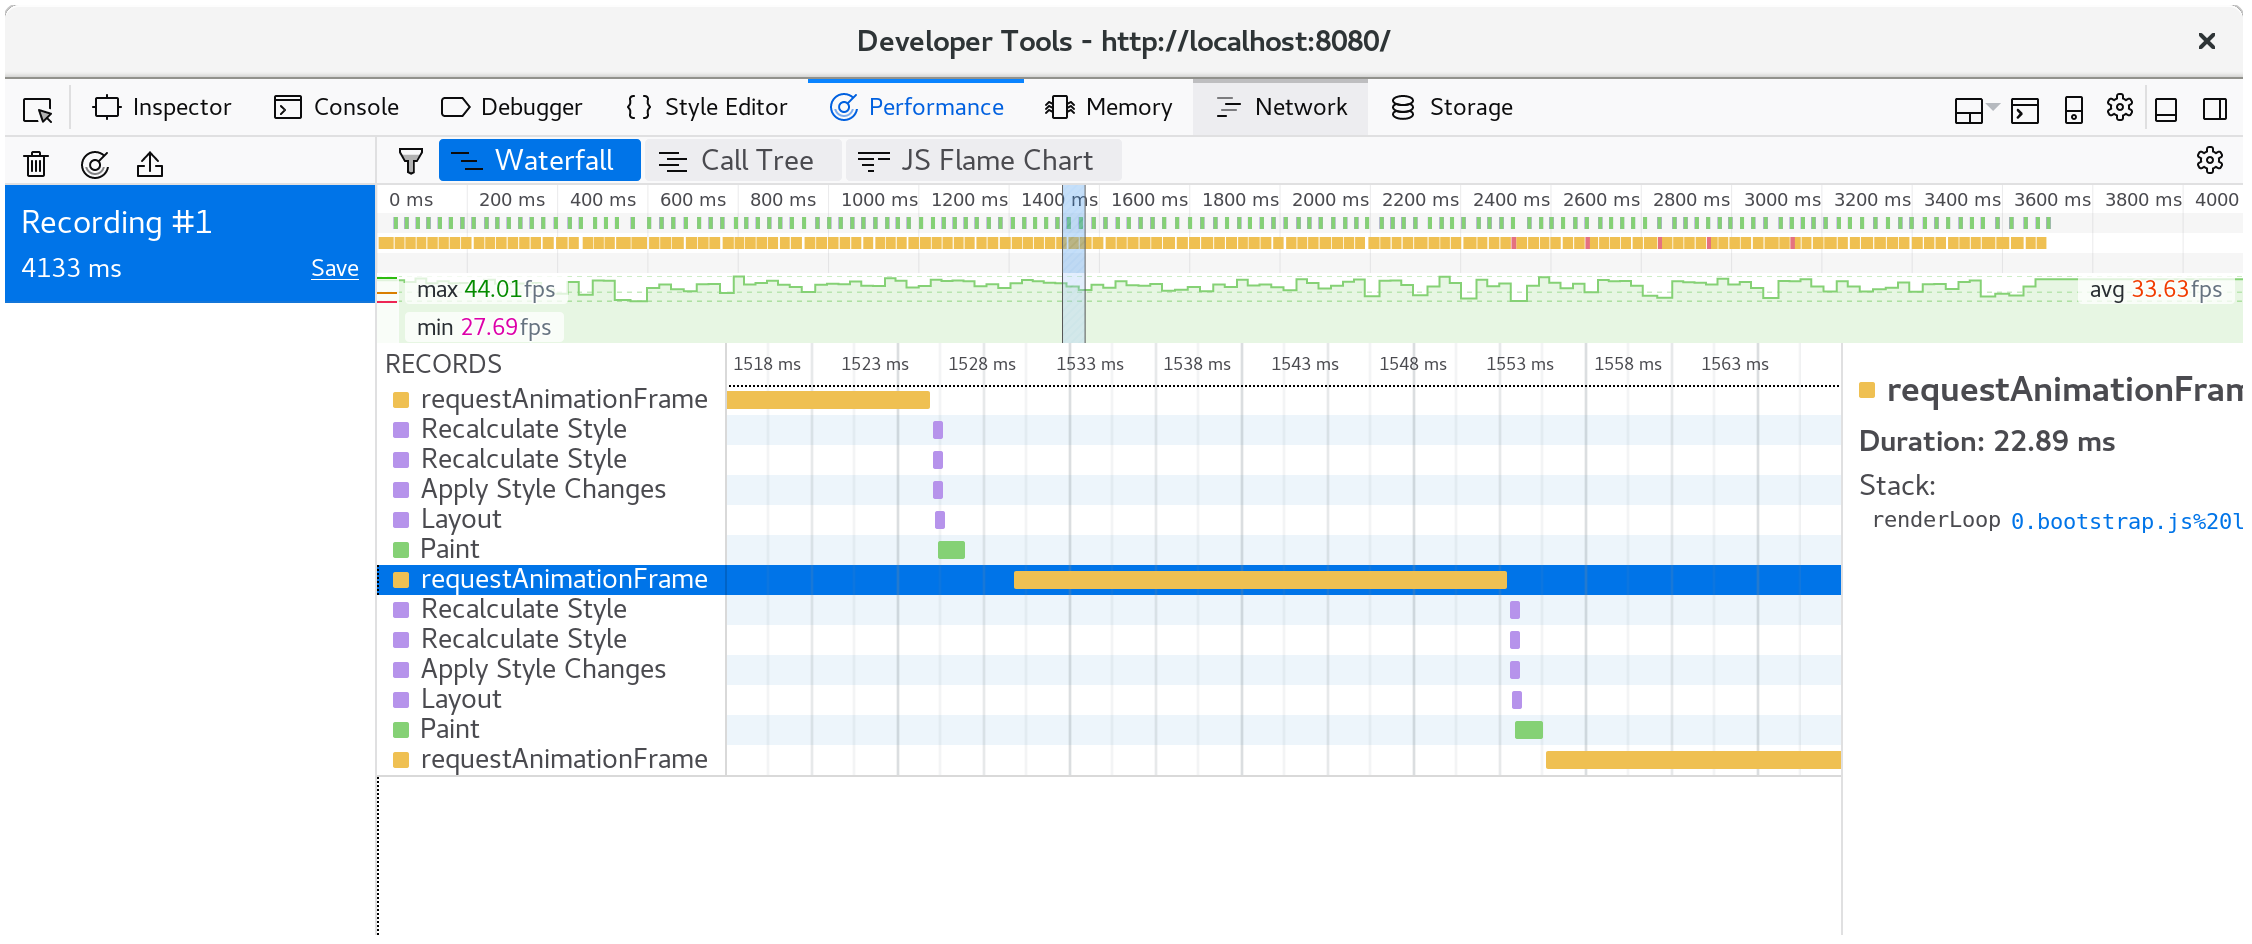
如果我们记录一个配置文件(profile)并查看瀑布视图,我们会看到每个动画帧花费超过 20 毫秒。回想一下,每秒 60 帧的意思是,渲染帧的整个过程最多 16 毫秒。其中不仅仅是我们的 JavaScript 和 WebAssembly,还有浏览器正在做的其他事情,比如绘画。
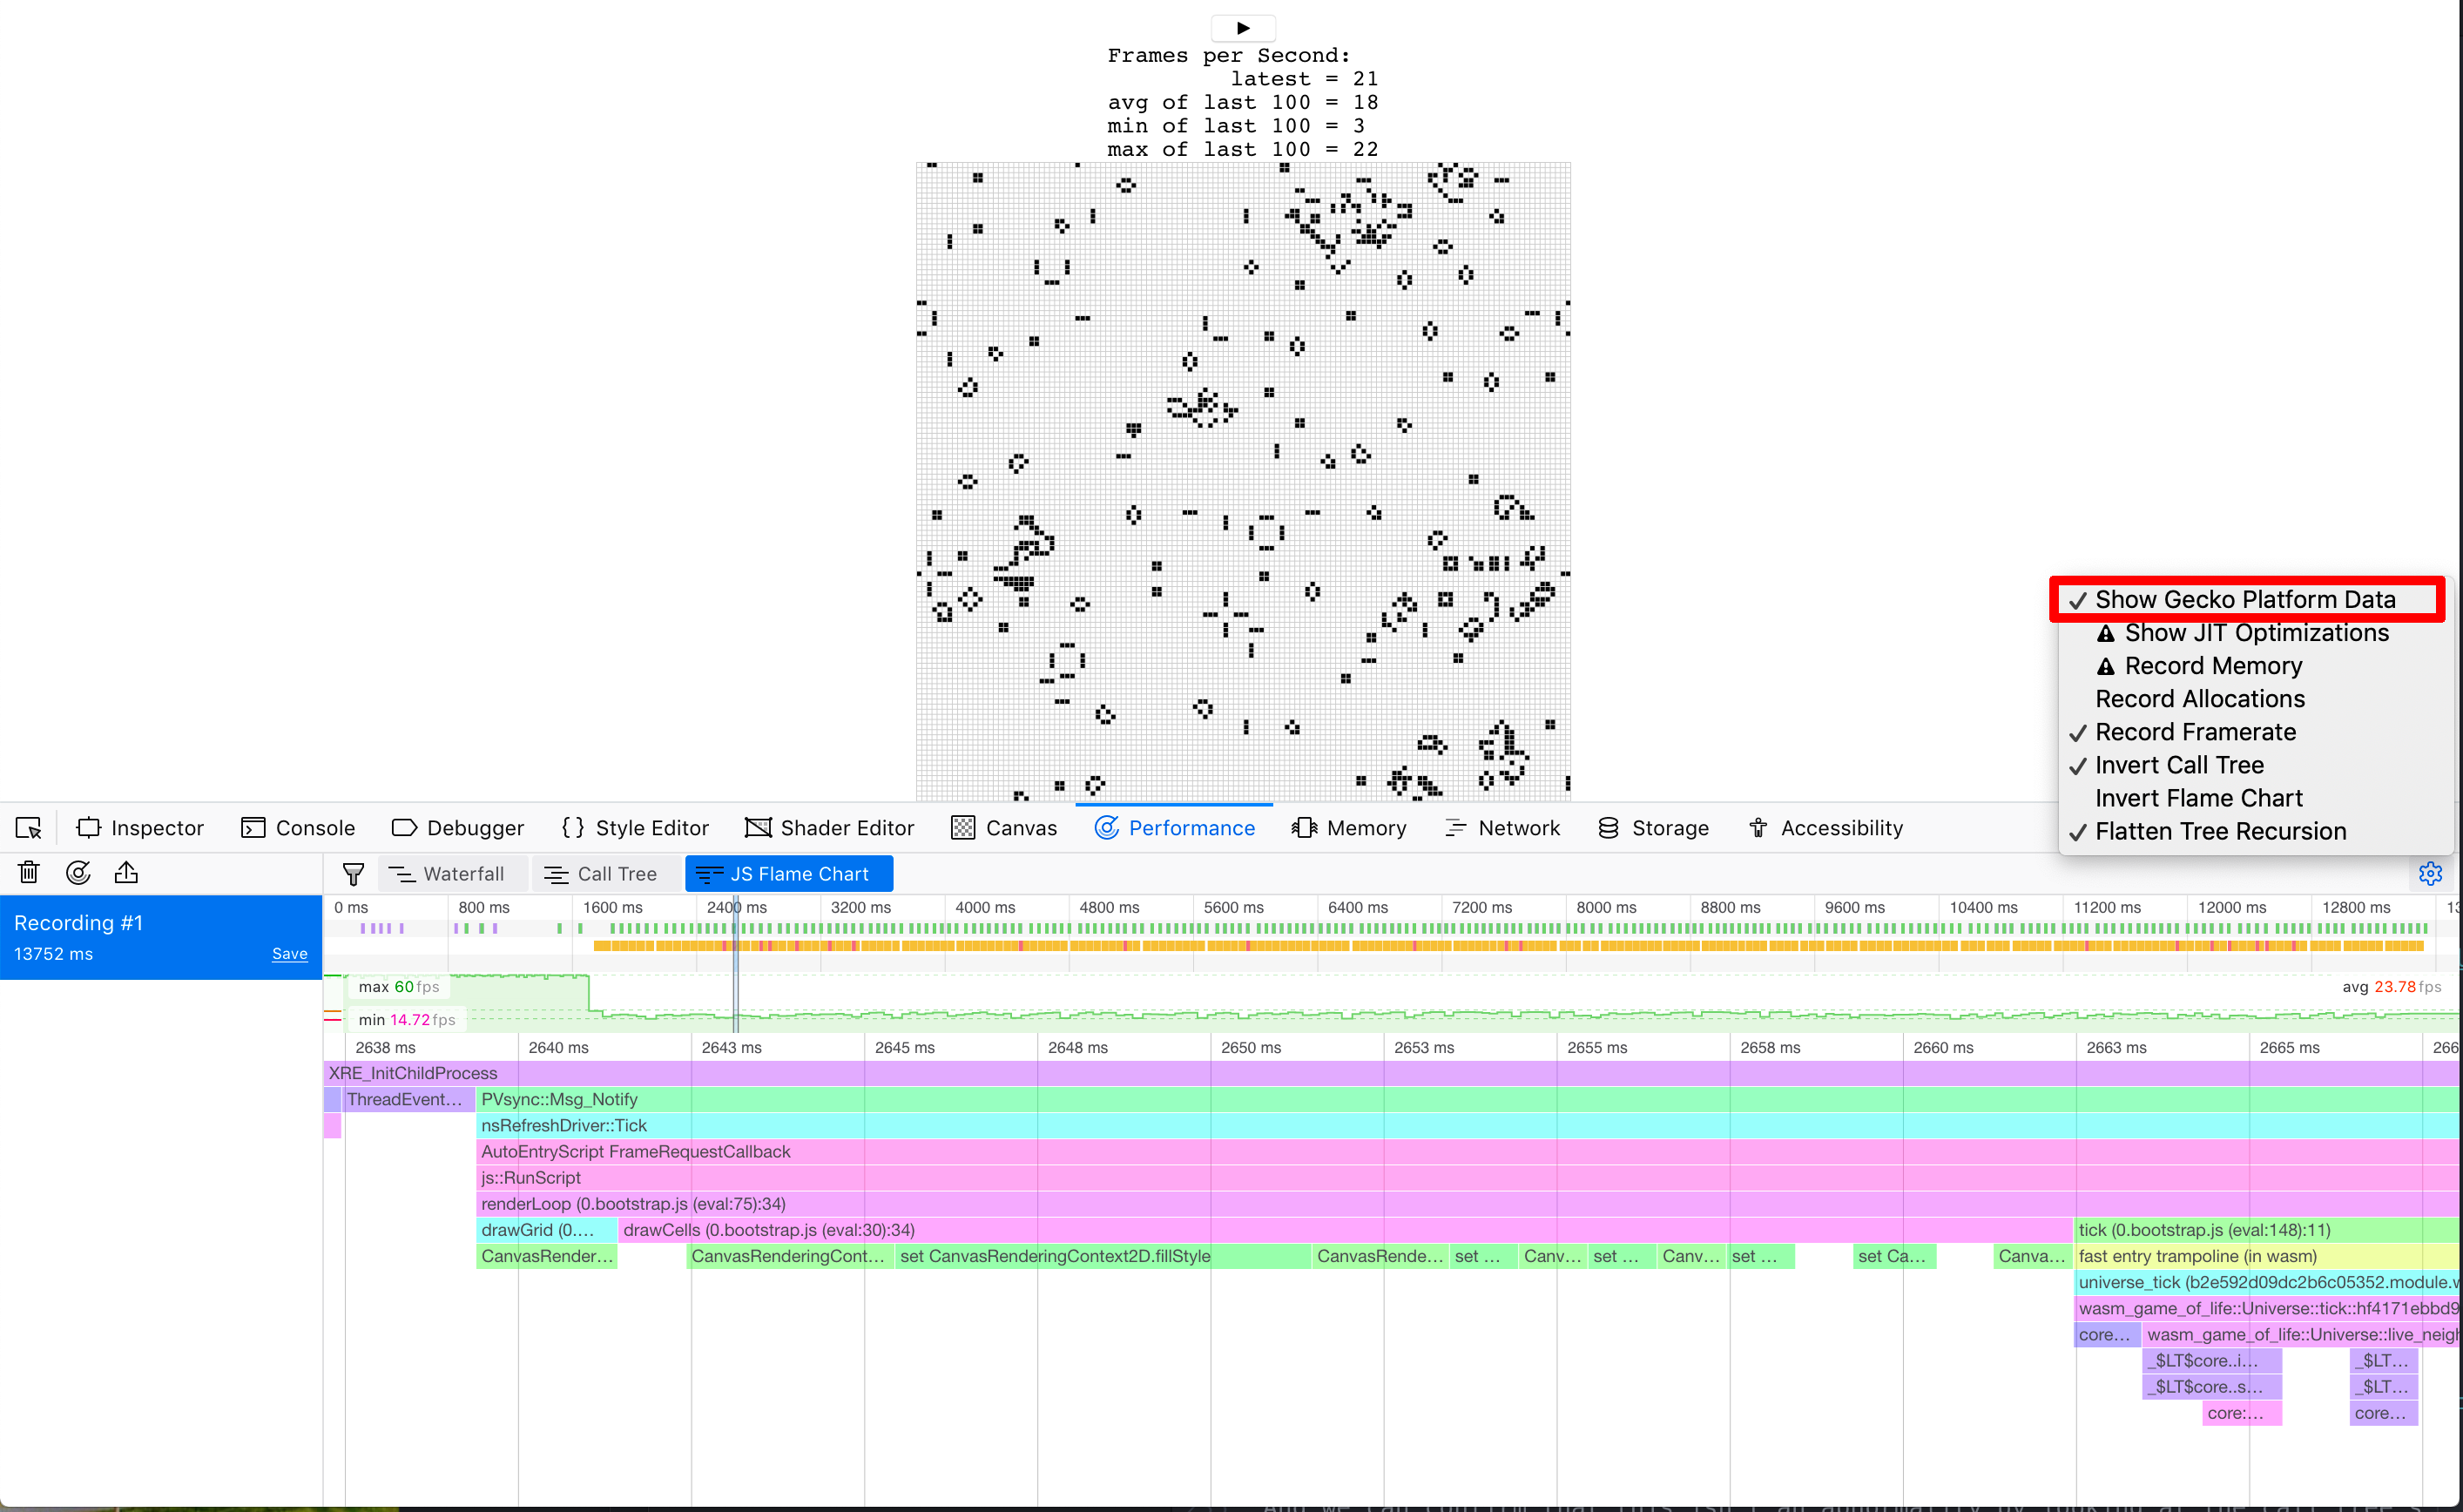
如果我们看一下单个动画帧中发生的情况,就会发现 CanvasRenderingContext2D.fillStyle setter 运行开销非常昂贵!
在Firefox中,如果你看到一行仅仅显示“DOM”而不是上面提到的
CanvasRenderingContext2D.fillStyle,你可能需要在performance developer tools选项中打开“Show Gecko Platform Data”选项:
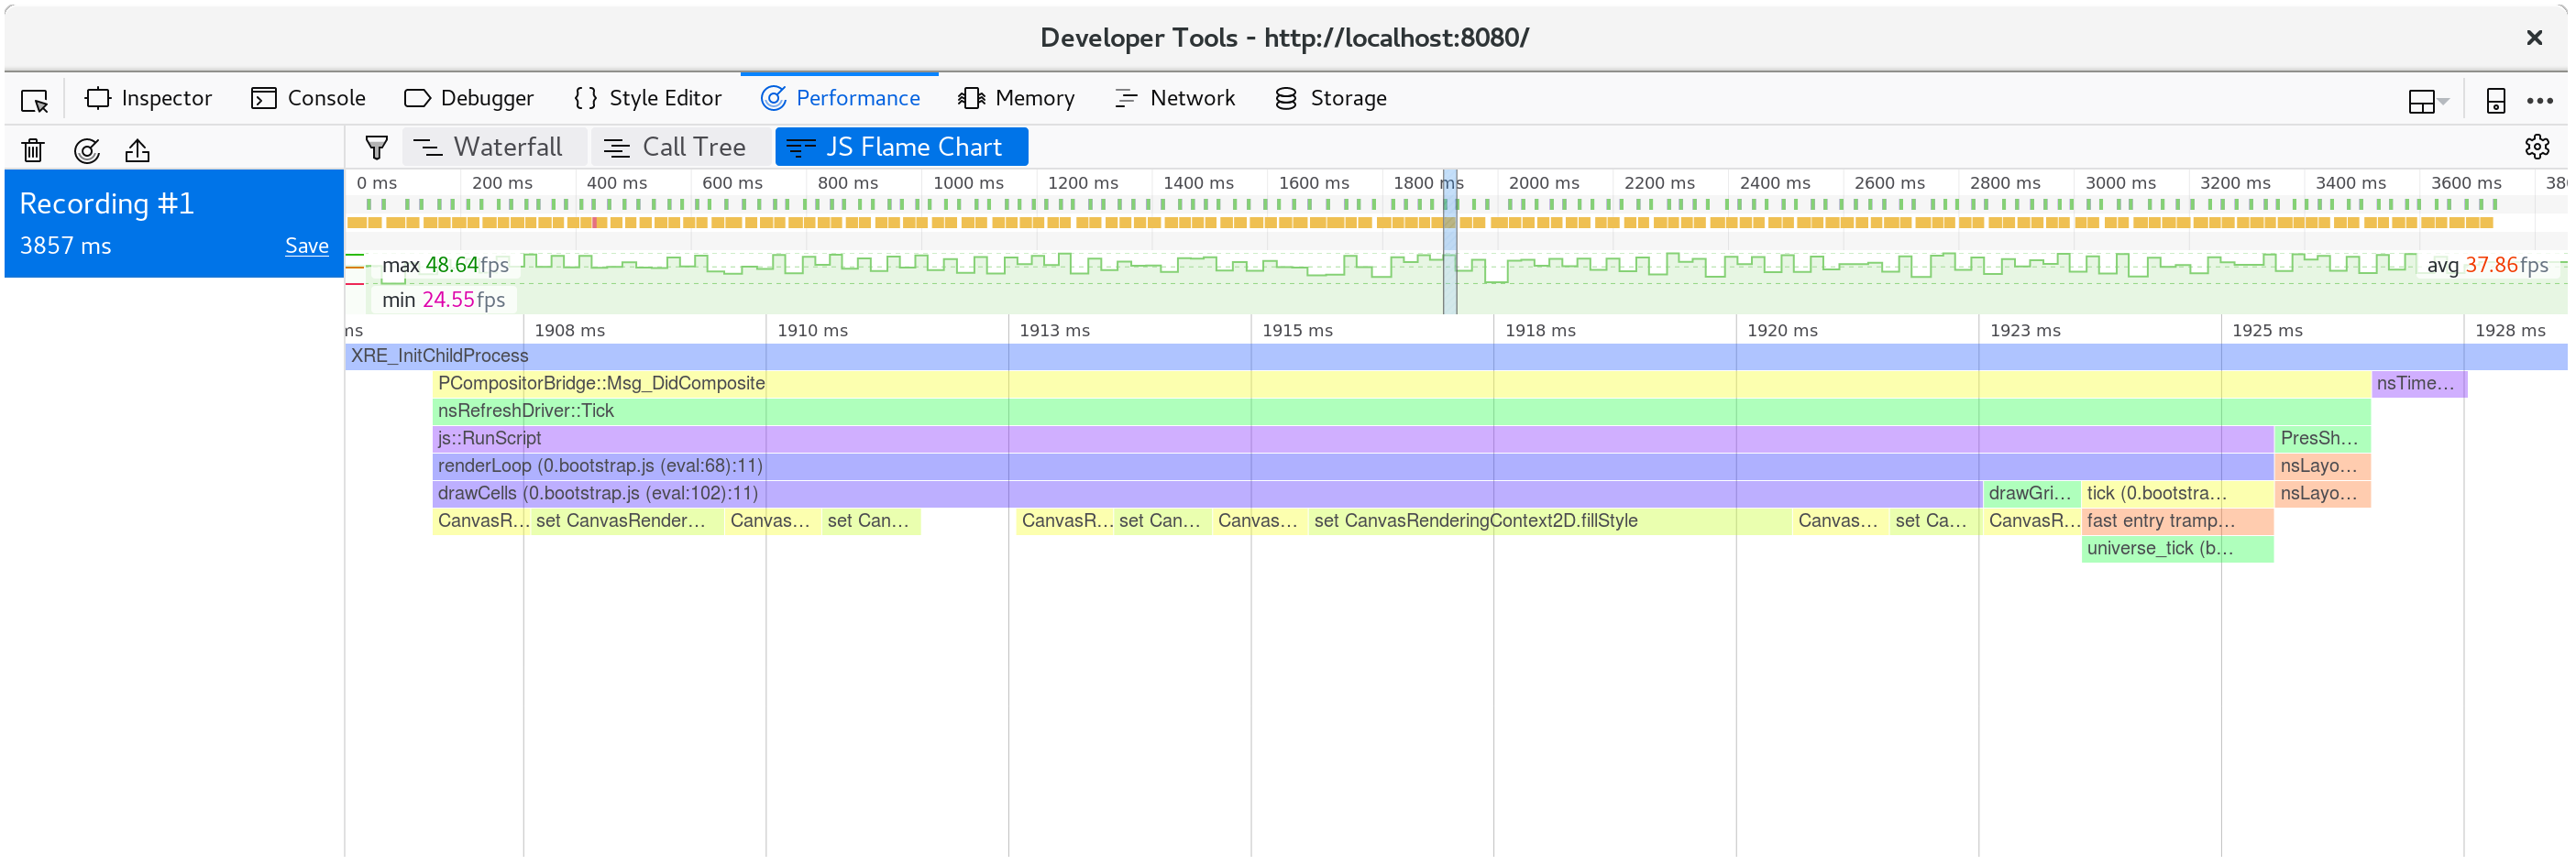
我们可以通过查看调用树的多帧聚合来确认这不是异常:
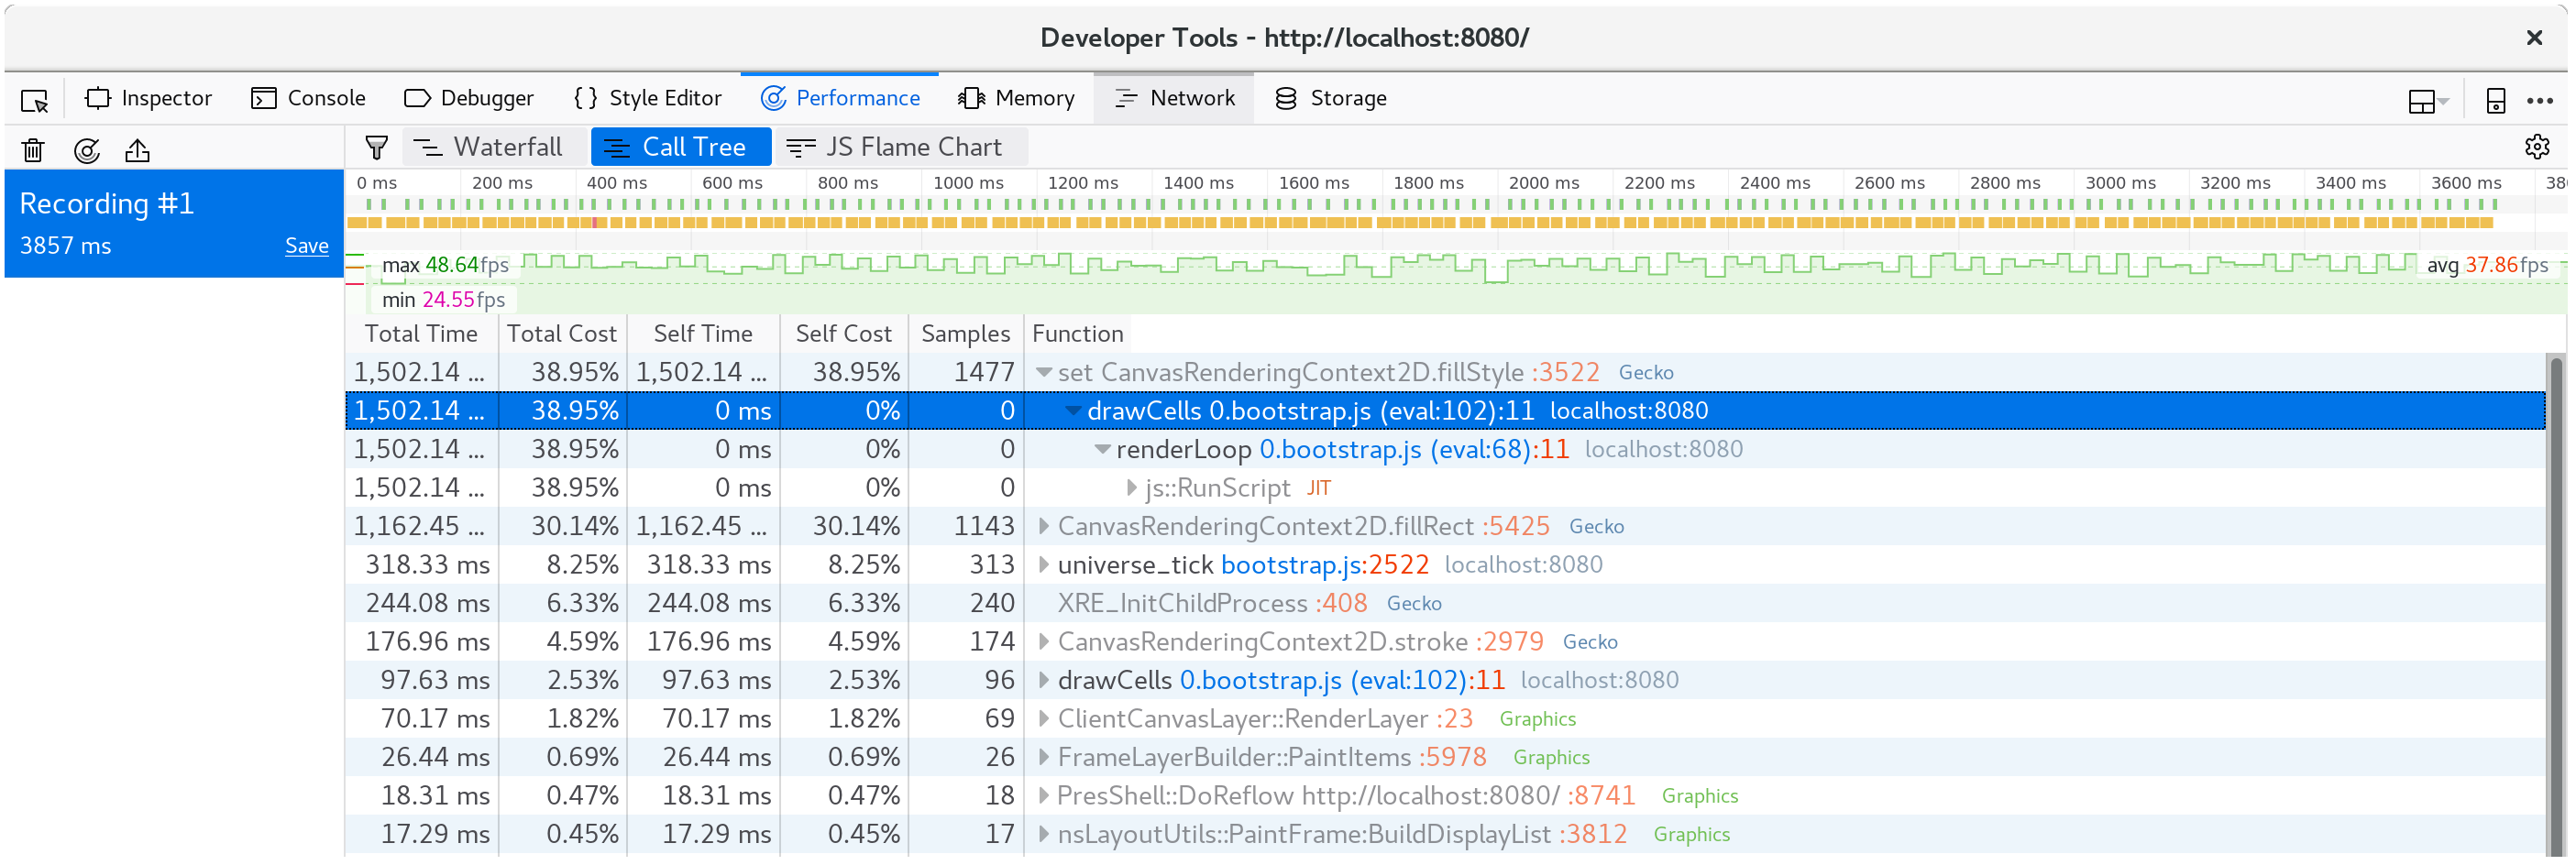
我们将近 40% 的时间花在了这个 setter 上!
⚡ 我们可能会想这个
tick方法是性能瓶颈,但事实并非如此。 要让分析引导你的注意力,不然时间可能花在你不期望的地方。
wasm-game-of-life/www/index.js 的 drawCells 函数里面,对每次动画帧,Universe 中的每个单元格都设置一次 fillStyle 属性:
for (let row = 0; row < height; row++) {for (let col = 0; col < width; col++) {const idx = getIndex(row, col);ctx.fillStyle = cells[idx] === DEAD ? DEAD_COLOR : ALIVE_COLOR;ctx.fillRect(col * (CELL_SIZE + 1) + 1,row * (CELL_SIZE + 1) + 1,CELL_SIZE,CELL_SIZE);}}
现在我们已经发现了这个 fillStyle 是如此昂贵,我们可以做些什么来避免经常设置它?
我们需要改变 fillStyle,表明单元格是活着还是死亡。
如果我们设定 fillStyle = ALIVE_COLOR ,然后在一次通过,绘制完所有活单元格,然后设置 fillStyle = DEAD_COLOR,并在另一次,绘制所有死单元格,然后到结束,我们只设置了 fillStyle 两次,而不是单元格数。
// 活细胞ctx.fillStyle = ALIVE_COLOR;for (let row = 0; row < height; row++) {for (let col = 0; col < width; col++) {const idx = getIndex(row, col);if (cells[idx] !== Cell.Alive) {continue;}ctx.fillRect(col * (CELL_SIZE + 1) + 1,row * (CELL_SIZE + 1) + 1,CELL_SIZE,CELL_SIZE);}}// 死细胞ctx.fillStyle = DEAD_COLOR;for (let row = 0; row < height; row++) {for (let col = 0; col < width; col++) {const idx = getIndex(row, col);if (cells[idx] !== Cell.Dead) {continue;}ctx.fillRect(col * (CELL_SIZE + 1) + 1,row * (CELL_SIZE + 1) + 1,CELL_SIZE,CELL_SIZE);}}
保存这些更改,并刷新 http://localhost:8080/ 后,渲染恢复到每秒平滑 60 帧。
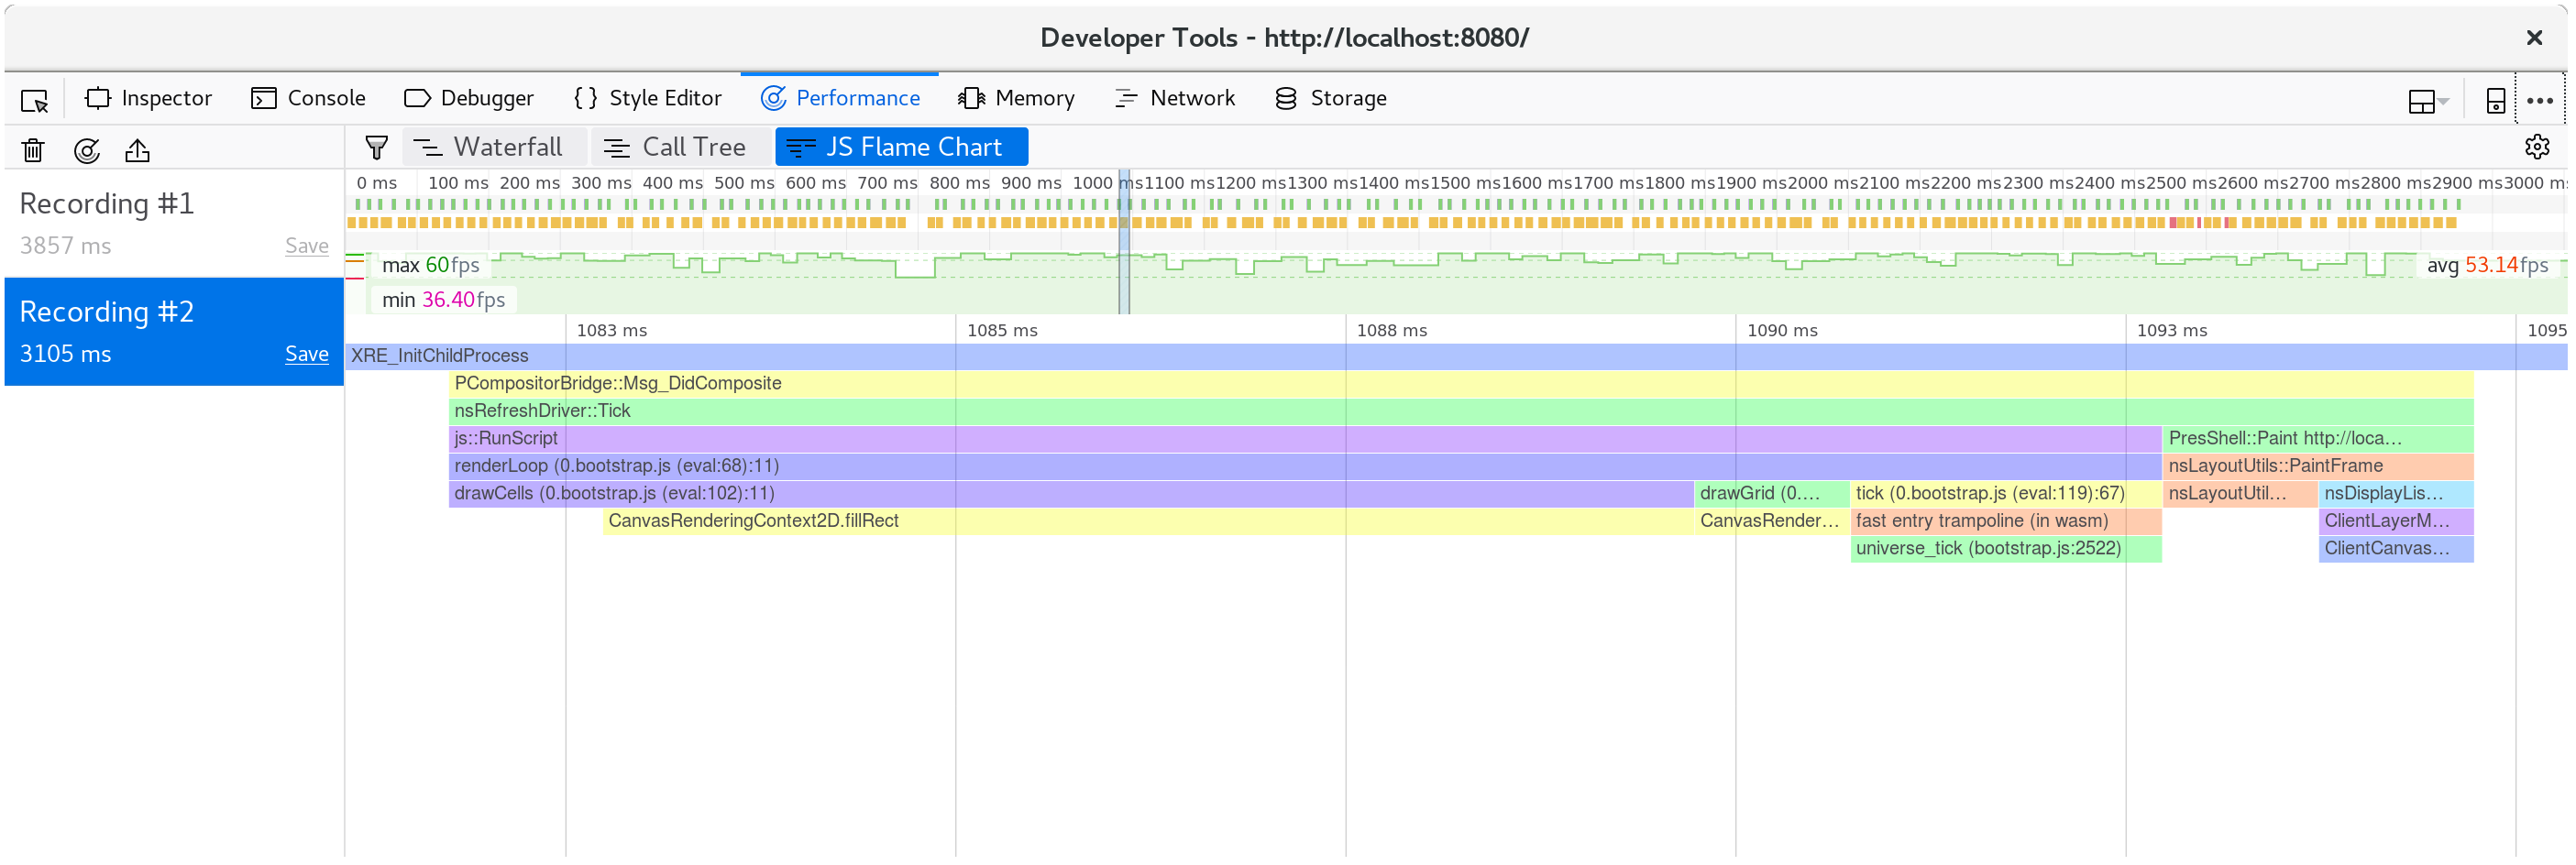
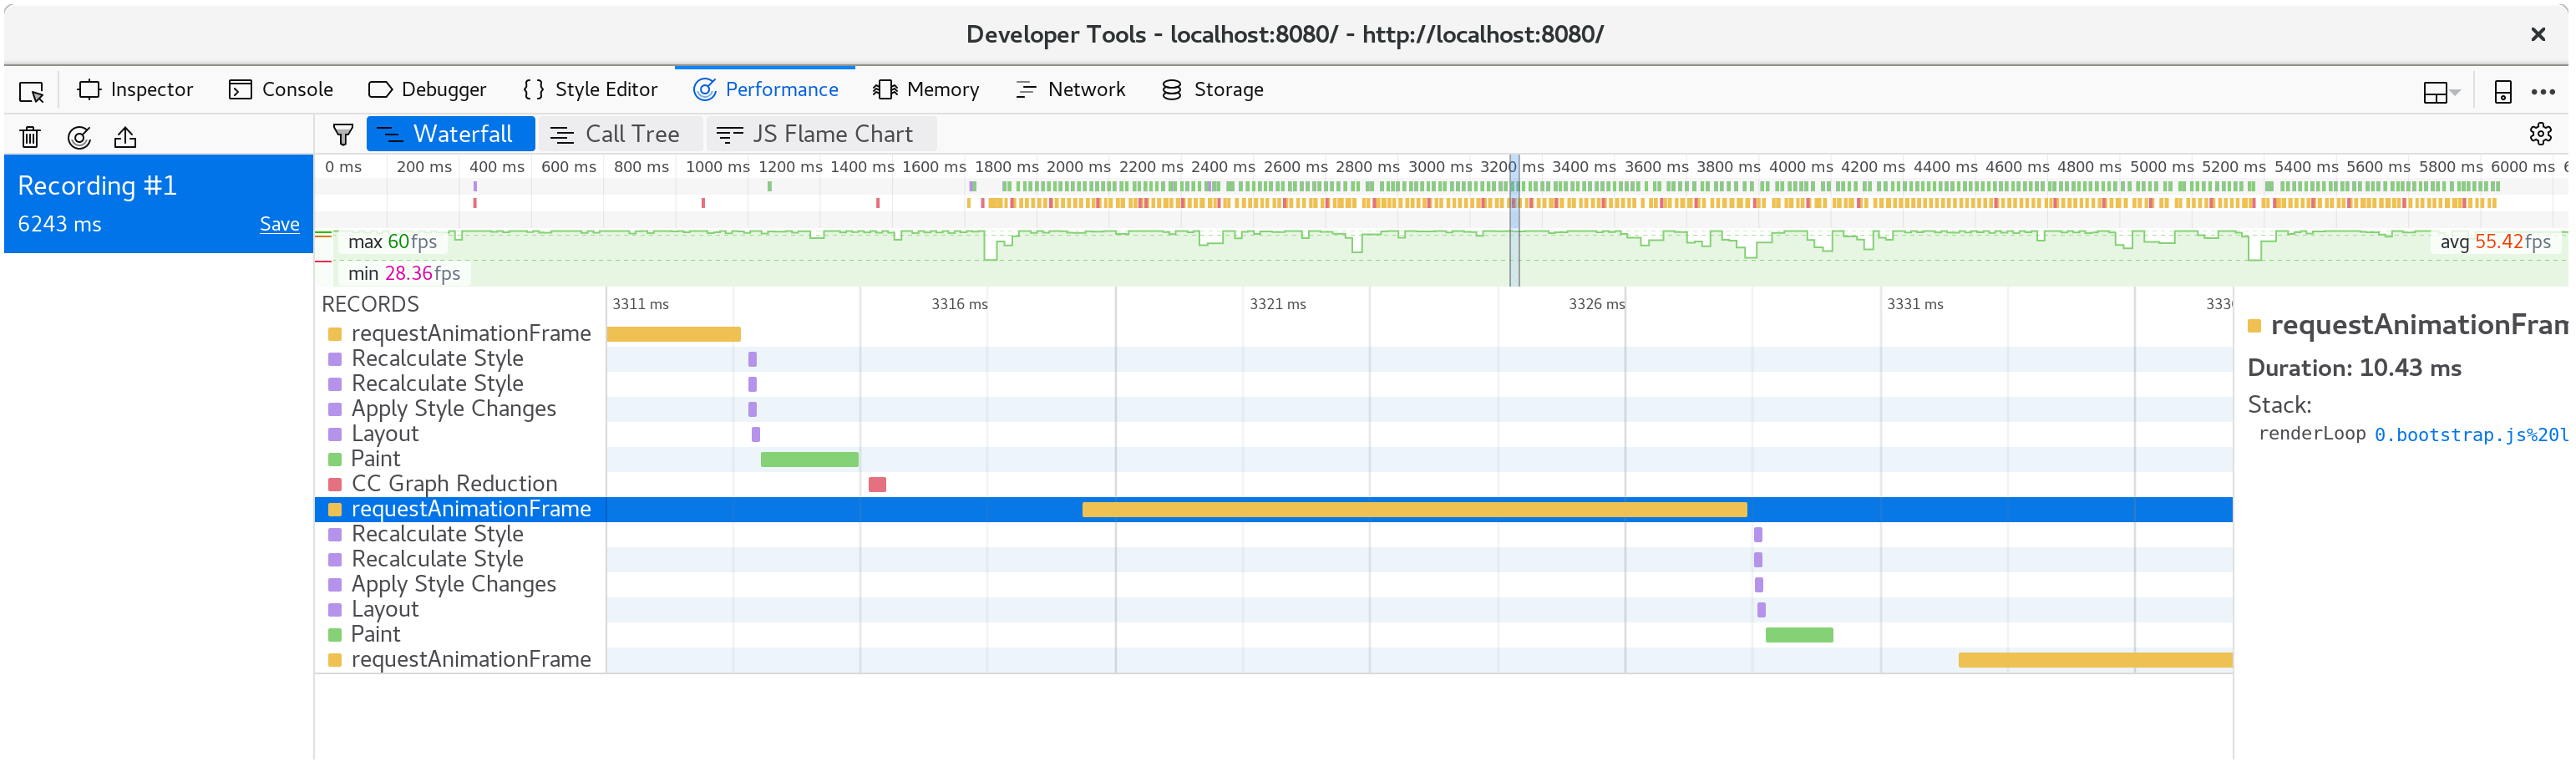
如果我们采用另一个配置文件,我们可以看到现在每个动画帧只花费大约 10 毫秒。
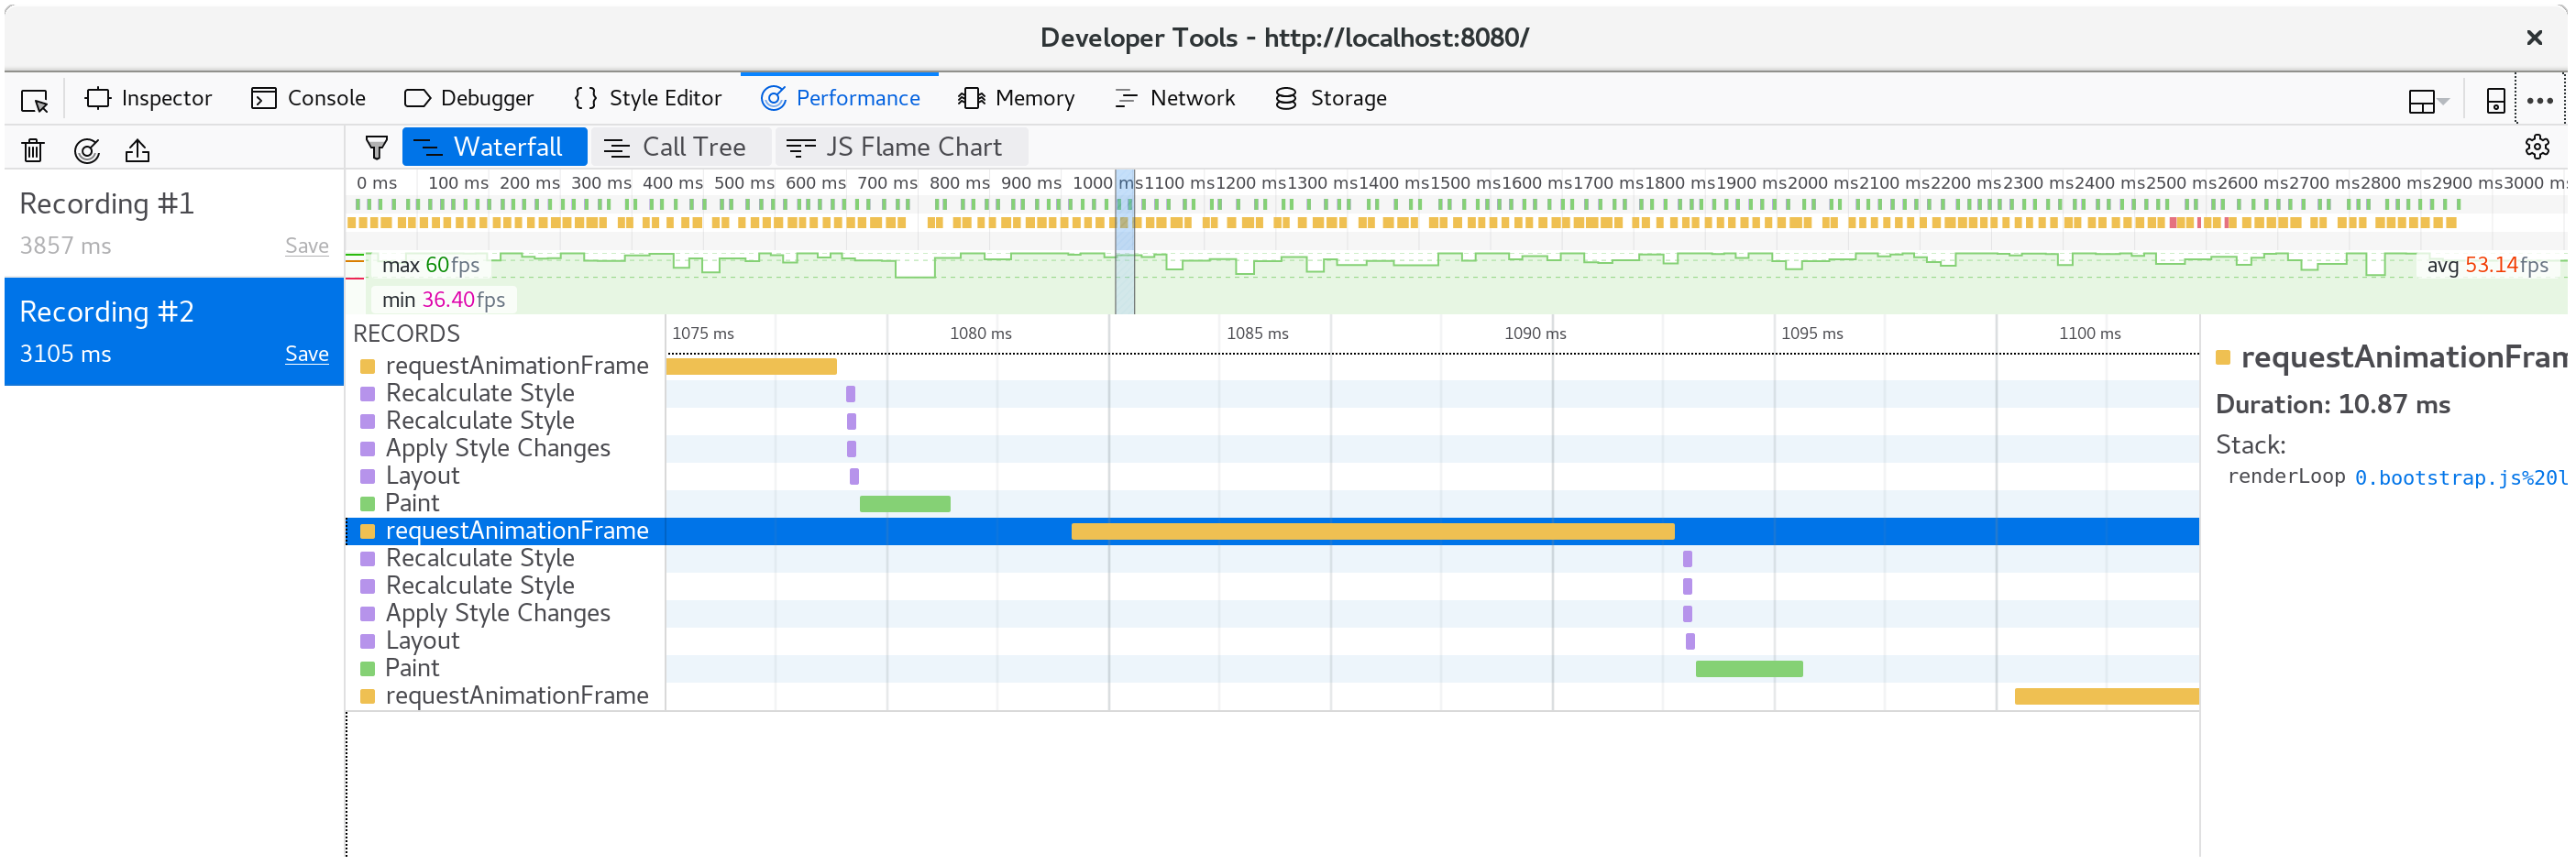
击败罪魁祸首,我们看到了 fillStyle 成本已经消失,我们的大部分时间花在了内部的fillRect,其是绘制每个单元格的矩形。
运动得更快
有些人不喜欢等待,他们更喜欢的是,如果不是每个动画帧发生一次宇宙的 tick,而是九次 tick。
for (let i = 0; i < 9; i++) {universe.tick();}
这使我的机器上回到每秒只有 35 帧。不行。我们要黄油般流畅的 60帧!
现在我们知道时间花在了 Universe::tick,所以让我们添加一些 Timer,用 console.time 和 console.timeEnd 调用来包装它的各个部分,然后,看看它引导我们的地方。
我假设啊,是分配一个新的单元格向量(vector),后在每次 tick,就要释放旧向量是昂贵的,占用了我们时间预算的很大一部分。
pub fn tick(&mut self) {let _timer = Timer::new("Universe::tick");let mut next = {let _timer = Timer::new("allocate next cells");self.cells.clone()};{let _timer = Timer::new("new generation");for row in 0..self.height {for col in 0..self.width {let idx = self.get_index(row, col);let cell = self.cells[idx];let live_neighbors = self.live_neighbor_count(row, col);let next_cell = match (cell, live_neighbors) {// 规则 1: 任何少于两个邻居的活细胞死亡,就好像是由于人口不足造成的一样。.(Cell::Alive, x) if x < 2 => Cell::Dead,// 规则 2: 任何一个有两个或三个邻居的活体细胞都能传到下一代。.(Cell::Alive, 2) | (Cell::Alive, 3) => Cell::Alive,// 规则 3: 任何居住着三个以上邻居的活细胞都会死亡,就好像是由于人口过剩。.(Cell::Alive, x) if x > 3 => Cell::Dead,// 规则 4:任何一个只有三个相邻的活细胞的死细胞都会变成活细胞,就像通过繁殖一样。.(Cell::Dead, 3) => Cell::Alive,// 所有其他单元格保持相同状态。(otherwise, _) => otherwise,};next[idx] = next_cell;}}}let _timer = Timer::new("free old cells");self.cells = next;}
看看时间,很明显我的假设是不正确的:绝大部分时间,实际花在计算下一代单元格上。
令人惊讶的是,在每次 tick 上分配和释放向量,似乎具有可忽略的成本。
分析记录是始终指导我们工作的提醒!
下一节需要 nightly 编译器。它是必需的,因为 测试 feature(特性) 我们准备用于基准测试。我们将安装的另一个工具是 Cargo benchcmp 。
它是一个小实用程序,用于比较 cargo bench 生成的微基准测试。
一个 #[bench] 原生代码,就做了我们 WebAssembly 正在做的事情,但我们可以使用更成熟的分析工具。
这是新的 wasm-game-of-life/benches/bench.rs:
#![feature(test)]extern crate test;extern crate wasm_game_of_life;#[bench]fn universe_ticks(b: &mut test::Bencher) {let mut universe = wasm_game_of_life::Universe::new();b.iter(|| {universe.tick();});}
我们还要注释所有的 #[wasm_bindgen] 标示,和来自 Cargo.toml 的 "cdylib",不然,构建本机代码将失败并出现链接错误。
有了这一切,我们就可以运行了 cargo bench | tee before.txt 编译并运行我们的基准测试!| tee before.txt 部分将从 cargo bench 中获取输出,并放入一个名为 before.txt 的文件。
$ cargo bench | tee before.txtFinished release [optimized + debuginfo] target(s) in 0.0 secsRunning target/release/deps/wasm_game_of_life-91574dfbe2b5a124running 0 teststest result: ok. 0 passed; 0 failed; 0 ignored; 0 measured; 0 filtered outRunning target/release/deps/bench-8474091a05cfa2d9running 1 testtest universe_ticks ... bench: 664,421 ns/iter (+/- 51,926)test result: ok. 0 passed; 0 failed; 0 ignored; 1 measured; 0 filtered out
这也告诉我们二进制文件的位置,我们可以再次运行基准测试,但这次是在我们的操作系统的分析器下。
就我而言,我正在运行 Linux,所以 perf 是我将使用的探查分析器:
$ perf record -g target/release/deps/bench-8474091a05cfa2d9 --benchrunning 1 testtest universe_ticks ... bench: 635,061 ns/iter (+/- 38,764)test result: ok. 0 passed; 0 failed; 0 ignored; 1 measured; 0 filtered out[ perf record: Woken up 1 times to write data ][ perf record: Captured and wrote 0.178 MB perf.data (2349 samples) ]
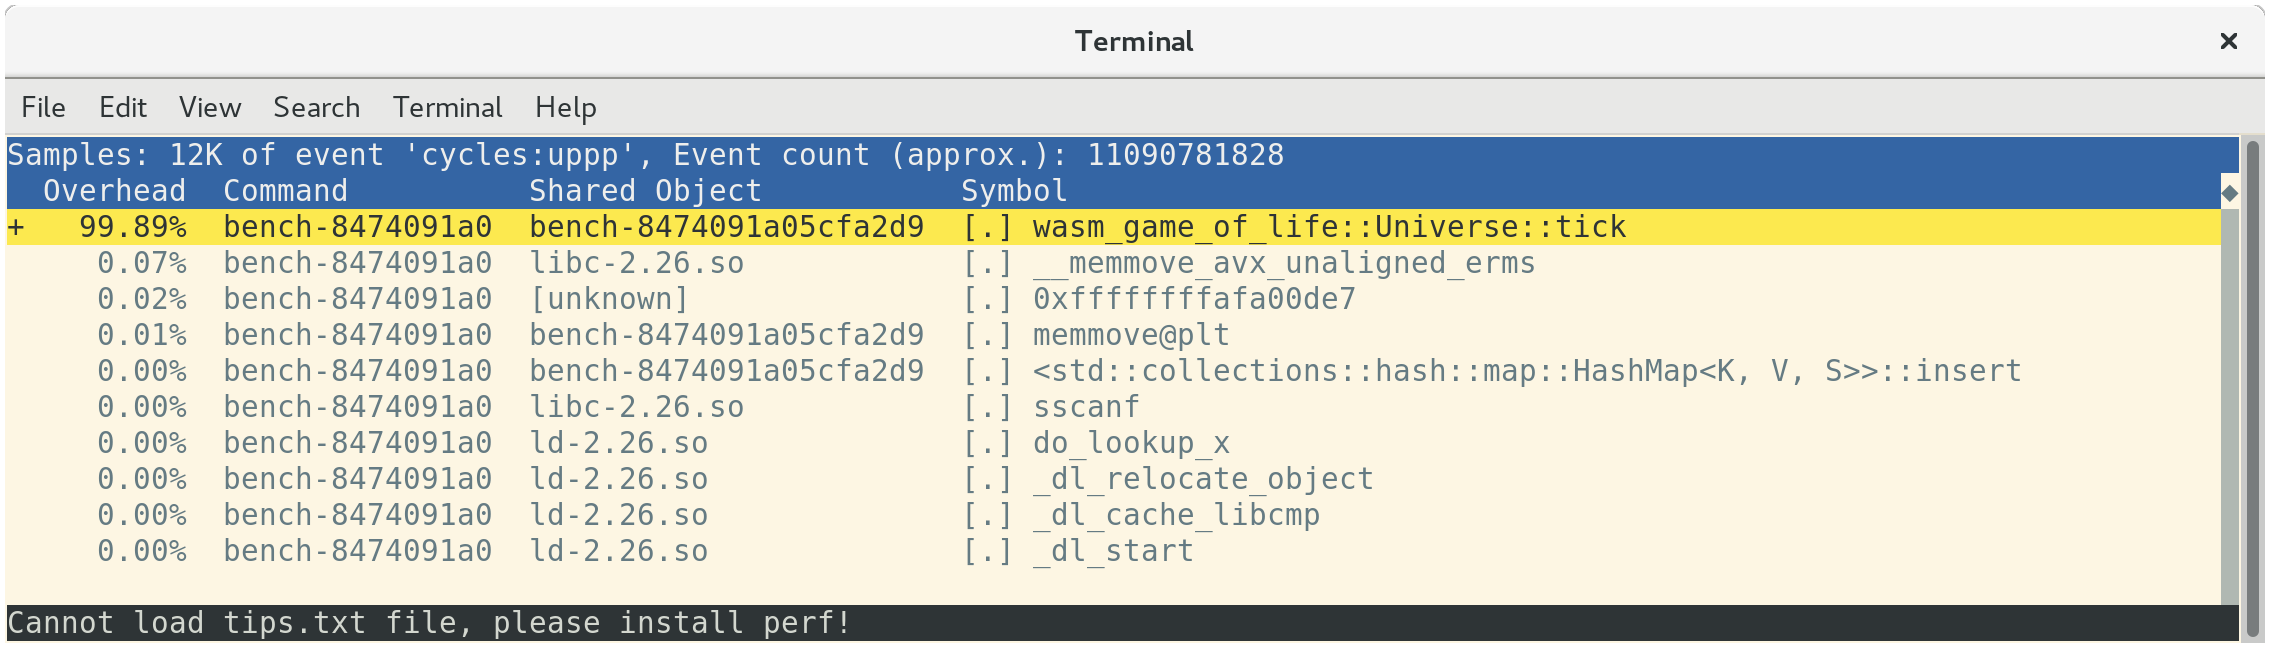
用 perf report 加载配置文件,表明我们所有的时间都花在了 Universe::tick,如预期的那样:
如果你按 a,工具 perf 将注释一个函数时间中的哪些命令的花费:
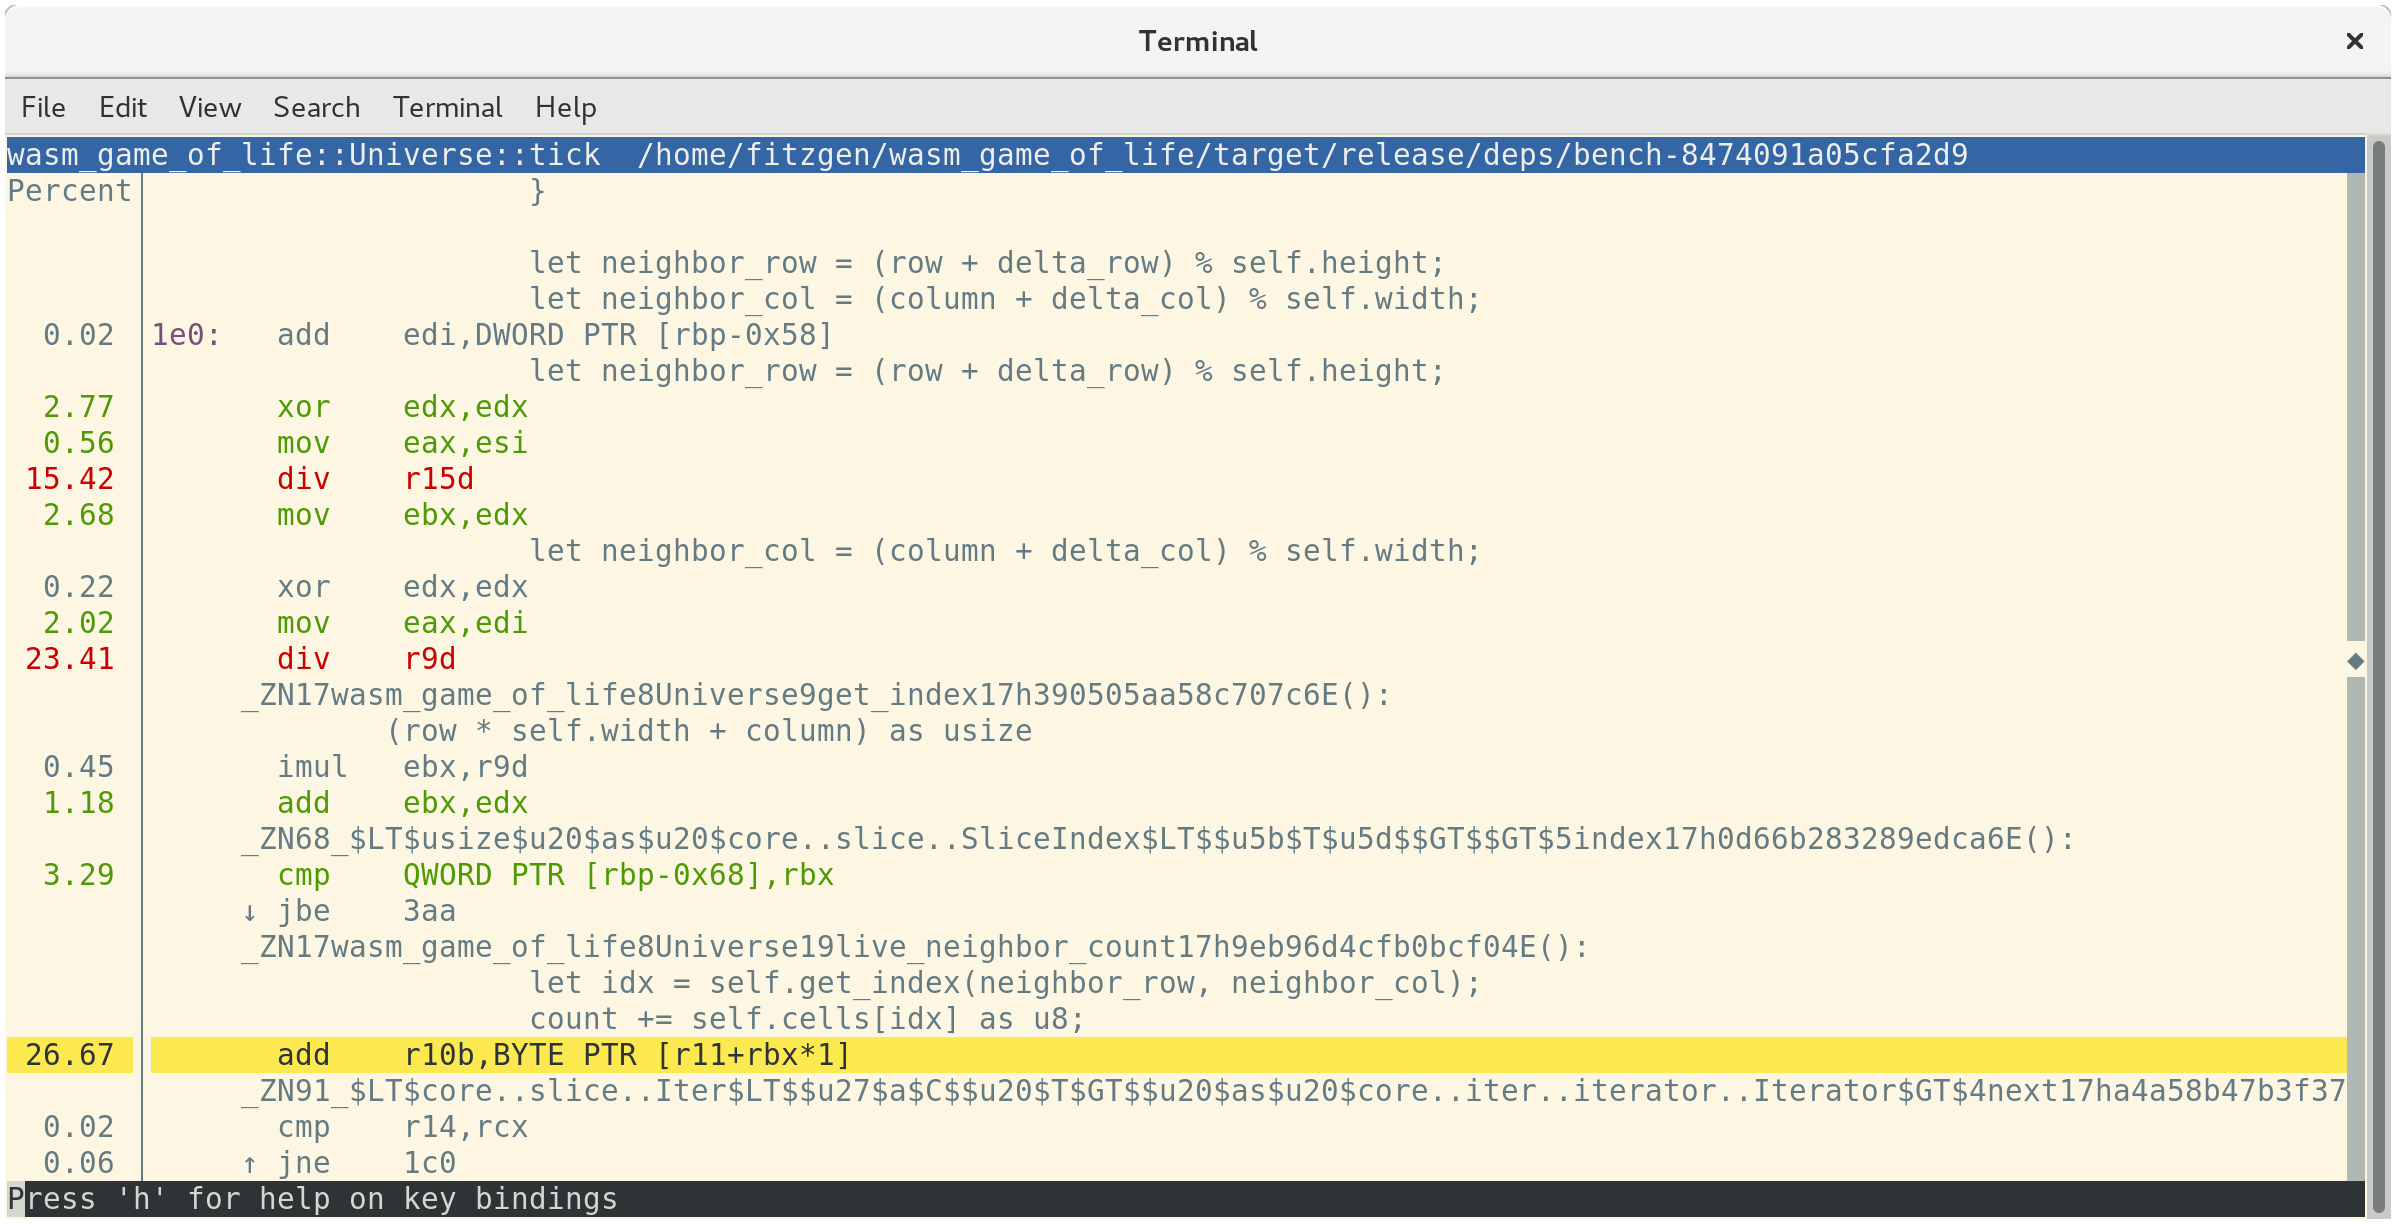
这告诉我们 26.67%的时间用于求和相邻单元格的值,23.41%的时间用于获取邻居的列索引,另外 15.42%的时间用于获取邻居的行索引。
在这三大最昂贵的命令中,第二和第三命令都让 div 很昂贵。这些 div 在 Universe::live_neighbor_count 实现 modulo 索引逻辑。
回想一下 wasm-game-of-life/src/lib.rs 里面的 live_neighbor_count 定义:
fn live_neighbor_count(&self, row: u32, column: u32) -> u8 {let mut count = 0;for delta_row in [self.height - 1, 0, 1].iter().cloned() {for delta_col in [self.width - 1, 0, 1].iter().cloned() {if delta_row == 0 && delta_col == 0 {continue;}let neighbor_row = (row + delta_row) % self.height;let neighbor_col = (column + delta_col) % self.width;let idx = self.get_index(neighbor_row, neighbor_col);count += self.cells[idx] as u8;}}count}
我们使用 modulo 的原因是为了避免使代码混乱,if 出第一行或最后一行/列的边缘情况分支。
但,当我们不在宇宙的边缘 row 或 column 的时候,不需要 modulo 包裹处理,会为此最常见情况的div命令付出代价。
相反,如果我们使用 if 出边缘情况,并展开此循环,CPU 的分支预测器应该可以很好地预测它。
我们改写 live_neighbor_count,像这样:
fn live_neighbor_count(&self, row: u32, column: u32) -> u8 {let mut count = 0;let north = if row == 0 {self.height - 1} else {row - 1};let south = if row == self.height - 1 {0} else {row + 1};let west = if column == 0 {self.width - 1} else {column - 1};let east = if column == self.width - 1 {0} else {column + 1};let nw = self.get_index(north, west);count += self.cells[nw] as u8;let n = self.get_index(north, column);count += self.cells[n] as u8;let ne = self.get_index(north, east);count += self.cells[ne] as u8;let w = self.get_index(row, west);count += self.cells[w] as u8;let e = self.get_index(row, east);count += self.cells[e] as u8;let sw = self.get_index(south, west);count += self.cells[sw] as u8;let s = self.get_index(south, column);count += self.cells[s] as u8;let se = self.get_index(south, east);count += self.cells[se] as u8;count}
现在让我们再次运行基准测试!这次输出到 after.txt。
$ cargo bench | tee after.txtCompiling wasm_game_of_life v0.1.0 (file:///home/fitzgen/wasm_game_of_life)Finished release [optimized + debuginfo] target(s) in 0.82 secsRunning target/release/deps/wasm_game_of_life-91574dfbe2b5a124running 0 teststest result: ok. 0 passed; 0 failed; 0 ignored; 0 measured; 0 filtered outRunning target/release/deps/bench-8474091a05cfa2d9running 1 testtest universe_ticks ... bench: 87,258 ns/iter (+/- 14,632)test result: ok. 0 passed; 0 failed; 0 ignored; 1 measured; 0 filtered out
看起来好多了!我们可以看到它有多好,通过 benchcmp 工具,和比较我们之前创建的两个文本文件:
$ cargo benchcmp before.txt after.txtname before.txt ns/iter after.txt ns/iter diff ns/iter diff % speedupuniverse_ticks 664,421 87,258 -577,163 -86.87% x 7.61
Wow!7.61 倍的加速!
WebAssembly 有意映射到常见的硬件架构,但我们确实需要确保这个本机代码加速转换为 WebAssembly,而 WebAssembly 当然也加快了速度。
让我们 wasm-pack build,重新编译 .wasm 并刷新 http://localhost:8080/ 。在我的机器上,页面再次以每秒 60 帧的速度运行,并且使用浏览器的分析器记录另一个配置文件,显示每个动画帧大约需要 10 毫秒。
成功了!
演习
在这一点上,下一个最低的强化是,
Universe::tick删除分配和释放。 实现单元格的双缓冲,其中Universe维护两个向量,从不释放它们中的任何一个,并且tick永远不会分配新的缓冲区。从“实现生命”一章,实现替代的基于 delta 的设计,其中 Rust 代码返回,将状态更改为 JavaScript 的单元格列表。 这会使渲染
<canvas>快点?你可以实现这个设计,而不在每次tick上分配一个新的增量列表吗?正如我们的分析向我们展示的那样,2D
<canvas>渲染速度不是特别快。用 一个 WebGL 的渲染器 替换 2D 画布渲染器。 WebGL 版本的速度有多快?在 WebGL 渲染成为瓶颈之前,你能在多大程度上建立宇宙?

若有收获,就点个赞吧
0 人点赞
