技巧和窍门
本节以食谱风格介绍各种技巧。
对现有集群进行基准测试
```warning:: 如果您刚开始使用Rally,但不了解其工作原理,请不要在任何生产或类似生产的集群上运行它。此外,应该在专用环境中执行基准测试,该环境不应该有流量干扰
```note:: 在此配方中,我们假设Rally已正确配置。
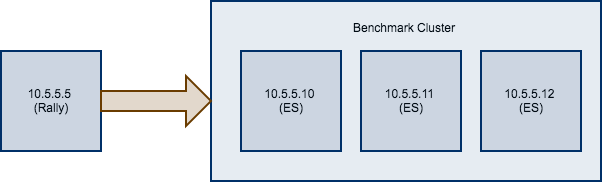
假如你现在有一个待测试的集群,由在10.5.5.10、10.5.5.11、10.5.5.12上运行的三个Elasticsearch节点组成。您已经自行设置了群集,并希望使用Rally对它进行基准测试。 Rally安装在10.5.5.5上。
首先,我们需要确定一个track。因此,我们通常运行esrally list tracks:
Name Description Documents Compressed Size Uncompressed Size Default Challenge All Challenges---------- ------------------------------------------------- ----------- ----------------- ------------------- ----------------------- ---------------------------geonames POIs from Geonames 11396505 252.4 MB 3.3 GB append-no-conflicts append-no-conflicts,appe...geopoint Point coordinates from PlanetOSM 60844404 481.9 MB 2.3 GB append-no-conflicts append-no-conflicts,appe...http_logs HTTP server log data 247249096 1.2 GB 31.1 GB append-no-conflicts append-no-conflicts,appe...nested StackOverflow Q&A stored as nested docs 11203029 663.1 MB 3.4 GB nested-search-challenge nested-search-challenge,...noaa Global daily weather measurements from NOAA 33659481 947.3 MB 9.0 GB append-no-conflicts append-no-conflicts,appe...nyc_taxis Taxi rides in New York in 2015 165346692 4.5 GB 74.3 GB append-no-conflicts append-no-conflicts,appe...percolator Percolator benchmark based on AOL queries 2000000 102.7 kB 104.9 MB append-no-conflicts append-no-conflicts,appe...pmc Full text benchmark with academic papers from PMC 574199 5.5 GB 21.7 GB append-no-conflicts append-no-conflicts,appe...
假如我们对全文基准感兴趣,我们选择pmc运行。如果您有要用于基准测试的数据,请创建自己的track,与默认track相比,您收集的指标将更具代表性和实用性。 接下来,我们需要知道要针对哪些机器,这很容易,因为从上图可以看到。
最后,我们需要检查要使用的管道。对于这种情况,benchmark-only管道是合适的,因为我们不希望Rally为我们配置集群。
现在我们可以调用Rally:
esrally --track=pmc --target-hosts=10.5.5.10:9200,10.5.5.11:9200,10.5.5.12:9200 --pipeline=benchmark-only
如果启用了X-Pack Security,则还需要指定另一个参数以使用https并传递凭据:
esrally --track=pmc --target-hosts=10.5.5.10:9243,10.5.5.11:9243,10.5.5.12:9243 --pipeline=benchmark-only --client-options="use_ssl:true,verify_certs:true,basic_auth_user:'elastic',basic_auth_password:'changeme'"
index.json的配置
{"settings": {"index.number_of_replicas": 0},"mappings": {"docs": {"dynamic": "strict","properties": {"geonameid": {"type": "long"},"name": {"type": "text"},"latitude": {"type": "double"},"longitude": {"type": "double"},"country_code": {"type": "text"},"population": {"type": "long"}}}}}
其中 settings其实就对应了es中templates的配置可以通过修改这里,对templates的优化进行测试,优化总结如下:
Elasticsearch template优化项
Translog flush间隔调整
"index.translog.sync_interval":"60s"``"index.translog.durability":"async"设置async表示tarnslog的刷盘策略按照sync_interval配置的时间周期进行。"index.translog.flush_threshold_size":"1024mb"设置flush_threshold_size表示translog达到1024mb的时候进行刷盘索引刷新间隔
"index.refresh_interval":"60s"默认情况下索引的refresh_interval的时间为1s,这意味着数据写入1s后就可以被搜索到,每次refresh会产生一个新的Lucene段,这会导致segment merge的行为,如果不需要这么高的搜索实时性可以降低索引refresh的周期段合并优化
index.merge.scheduler.max_thread_count如果只有一块硬盘且非ssd的话上值应该设置为1,index.merge.policy.segments_per_tier该属性指定了每层分段的数量,取值约小最终segment 越少,因此需要 merge 的操作更多,可以考虑适当增加此值.默认为10。index.merge.policy.max_merged_segment指定了单个segment的最大容量,默认为5G,可以适当降低此值Indexing Buffer
indices.memory.index_buffer_sizeindexing buffer在为 doc 建立索引时使用,当缓冲满时会刷入磁盘,生成一个新的 segment, 这是除refresh_interval外另外一个刷新索引,生成新 segment 的情况. 每个shard有自己的indexing buffer,默认为整个堆空间的10%。可以考虑适当增加该值。
建议的配置
settings : {"index.merge.policy.max_merged_segment":"2gb","index.merge.policy.segments_per_tier":"24","index.optimize_auto_generated_id":"true","index.translog.flush_threshold_size":"1024mb","index.translog.durability":"async","index.translog.sync_interval":"60s","index.refresh_interval":"60s"}
indices.memory.index_buffer_size : 30%index.merge.scheduler.max_thread_count: 1
这两项配置是在elasticsearch.yml中配置。
track.json的配置
track.json规定了测试的一些行为如下:
{"version": 2,"description": "Tutorial benchmark for Rally","indices": [{"name": "geonames","body": "index.json","types": [ "docs" ]}],"corpora": [{"name": "rally-tutorial","documents": [{"source-file": "documents.json","document-count": 11658903,"uncompressed-bytes": 1544799789}]}],"schedule": [{"operation": {"operation-type": "delete-index"}},{"operation": {"operation-type": "create-index"}},{"operation": {"operation-type": "cluster-health","request-params": {"wait_for_status": "green"}}},{"operation": {"operation-type": "bulk","bulk-size": 5000},"warmup-time-period": 120,"clients": 8},{"operation": {"operation-type": "force-merge"}},{"operation": {"name": "query-match-all","operation-type": "search","body": {"query": {"match_all": {}}}},"clients": 8,"warmup-iterations": 1000,"iterations": 1000,"target-throughput": 100}]}
其中我最关心es的写入性能,所以下面的测试着重测试es的写入:
{"operation": {"operation-type": "bulk","bulk-size": 5000},"warmup-time-period": 120,"clients": 8}
这里的几个值我们简单介绍一下,bulk不用多提,就是es的批量操作,bulk-size的值就是一次请求写入的数据条数,warmup-time-period是热身时间,意思就是让es把cpu和内存都调度起来,机器热了才开始测试,clients就是模拟客户端的数量。这个地方如果数据盘是机械盘的话,这个数字太大的话请求生成可能成为瓶颈。

若有收获,就点个赞吧
0 人点赞
