最终访问域名:
https://yinji.gaoshan.co/grafana
docker-compose 部署
version: "2"services:grafana:container_name: grafanaimage: grafana/grafana:latestvolumes:- ./grafana/grafana.ini:/etc/grafana/grafana.iniports:- 3000:3000restart: on-failure
修改 grafana.ini 配置文件
#################################### Server ####################################
[server]
# Protocol (http, https, h2, socket)
;protocol = http

# The ip address to bind to, empty will bind to all interfaces
;http_addr =

# The http port  to use
;http_port = 3000

# The public facing domain name used to access grafana from a browser
domain = yinji.gaoshan.co

# Redirect to correct domain if host header does not match domain
# Prevents DNS rebinding attacks
enforce_domain = true

# The full public facing url you use in browser, used for redirects and emails
# If you use reverse proxy and sub path specify full url (with sub path)
root_url = %(protocol)s://%(domain)s/grafana

# Serve Grafana from subpath specified in `root_url` setting. By default it is set to `false` for compatibility reasons.
;serve_from_sub_path = false

# Log web requests
;router_logging = false

# the path relative working path
;static_root_path = public

# enable gzip
;enable_gzip = false

# https certs & key file
;cert_file =
;cert_key =

# Unix socket path
;socket =

#################################### Database ####################################
域名、重定向、域名格式 注意: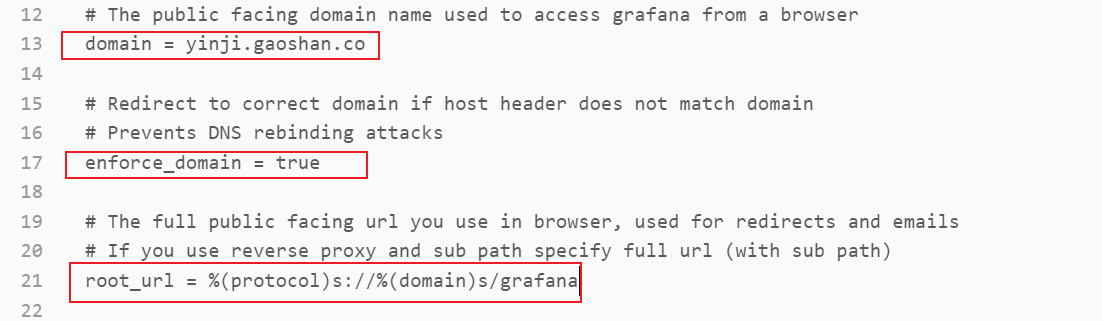
Nginx 代理配置
location /grafana {
    add_header 'Access-Control-Allow-Origin' '*';
    add_header Access-Control-Allow-Methods GET,POST,OPTIONS,DELETE;
    add_header 'Access-Control-Allow-Headers' 'userId,DNT,X-CustomHeader,Keep-Alive,User-Agent,X-Requested-With,If-Modified-Since,Cache-Control,Content-Type';
    proxy_pass http://10.206.0.4:3000;
    rewrite ^/grafana/(.*) /$1 break;
    proxy_set_header   Host $host;
}
Nacos 监控模板导入
https://github.com/nacos-group/nacos-template
注意数据源的名称 promethues 首字母小写

若有收获,就点个赞吧
0 人点赞
