Setting Up IntelliJ
Prerequisites
- Java 14 - You finished Lab 1 setup.
- You have successfully created your local repo for the class on your own machine. This is the
fa20-s**directory you created and set up in Lab 1. - You have pulled from skeleton master, and you have a
lab2setupdirectory in the same directory as yourlab1folder. Be mentally prepared to use a real world software development package. It will seem very complicated for a while, but we’ll lead you down the narrow path to success. Ask for help if you are stuck! It can be very hard to guess the right thing to do in IntelliJ.
Install IntelliJ on Your Computer
You’ll need to install the Community Edition of IntelliJ from the JetBrains website.
- After selecting the appropriate version for your OS (Windows), click download and wait a few minutes for the file to finish downloading.
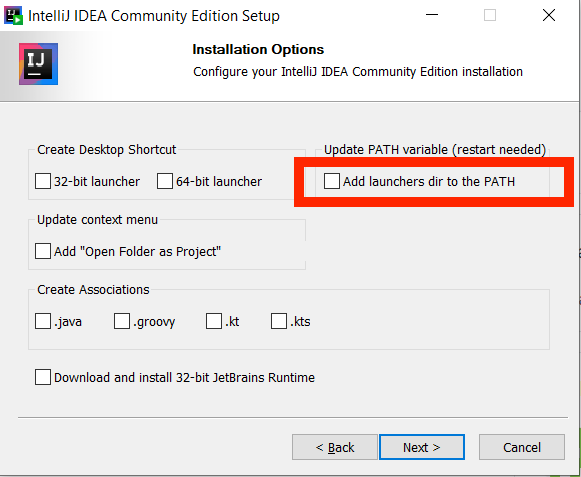
- Run the installer. If you have an older version of IntelliJ, you should uninstall it at this time and replace it with this newer version. You can use all of the default installation options, with one exception, if you are on Windows, make sure you check the box “Add launchers dir to the PATH”. If you accidentally missed it, the easiest fix is to uninstall intelliJ, and running the installer again, making sure you check that box the second time around. The image below only applies to Windows.
Installing the IntelliJ CS 61B Plugins
Begin the setup process by starting up IntelliJ. Then follow the steps below.
Make sure you’re running IntelliJ Version 2020.2.1 or later before continuing. Older versions may also work but we haven’t tried them ourselves.
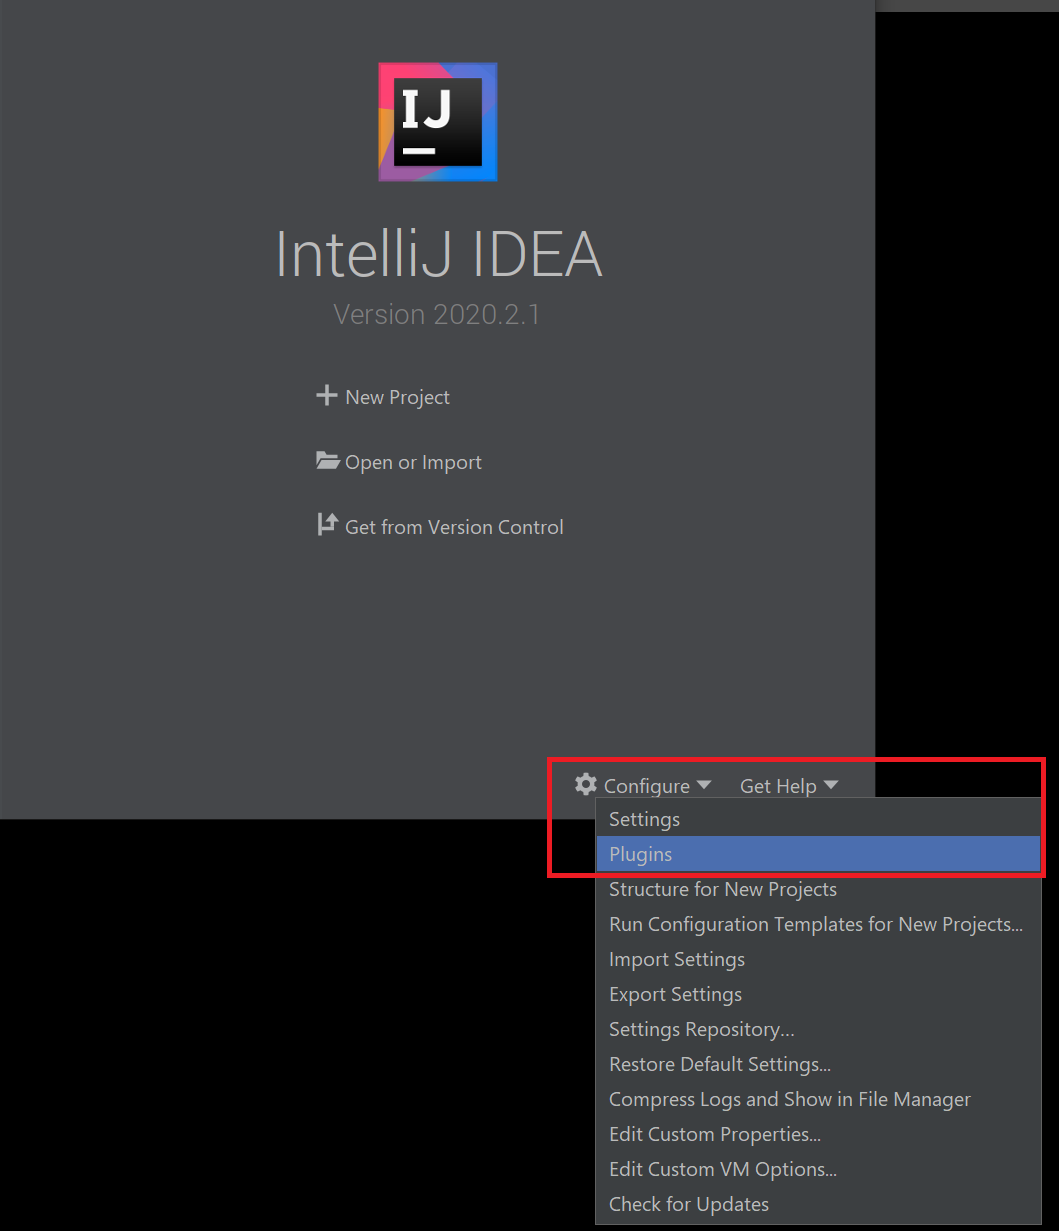
- In the Welcome window, click the “Configure” → “Plugins” button on the bottom right of the window.
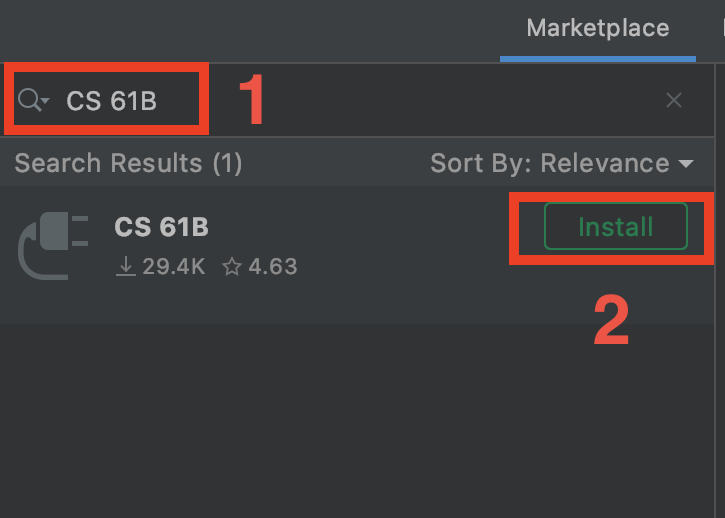
- On the window that appears, click “Marketplace” and enter “CS 61B” in the search bar at the top. The CS 61B plugin entry should appear. If you click the autocomplete suggestion, a slightly different window from what is shown below may appear – this is okay.
- Click the green Install button, and wait for the plugin to download and install.
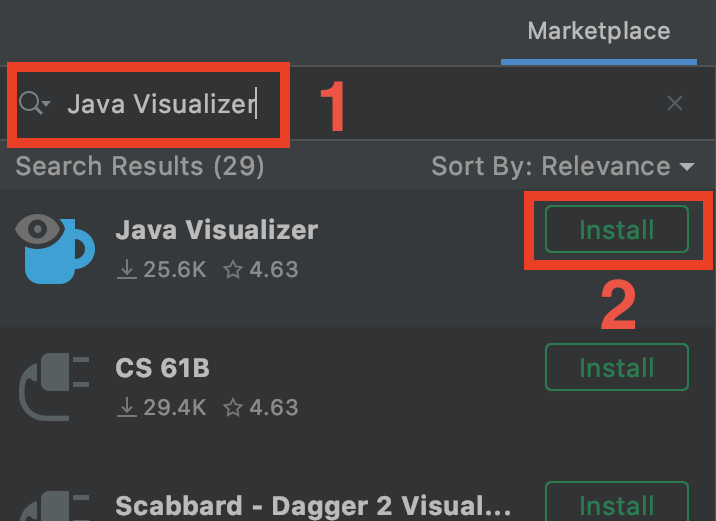
- Now, search for “Java Visualizer”, and click the green Install button to install the plugin.
- If it appears, click the green Restart IDE button to finalize the installation. If you don’t see a Restart IDE button, just continue.
For more information on using the plugins, read the plugin guide. You don’t have to read this right now.
Only move on once you have installed both plugins.
Project Setup
IntelliJ is an IDE (Integrated Development Environment). It includes a text editor as well as a whole lot of extra features to make writing code easier. Let’s try it out first on our lab1 folder.
- Upon opening IntelliJ, click on the “open or import” option.
- Find and choose your lab1 directory, then press the OK button. Once you’ve pressed finish, you should see something really similar to the following image. You may need to click the little triangle next to
lab1in the top left to get the source files (HelloWorld.java,HelloNumbers.javaandLeapYear.java) to show up. If you don’t see the sidebar, go to View → Tool Windows → Project, or select “Project” on the left toolbar.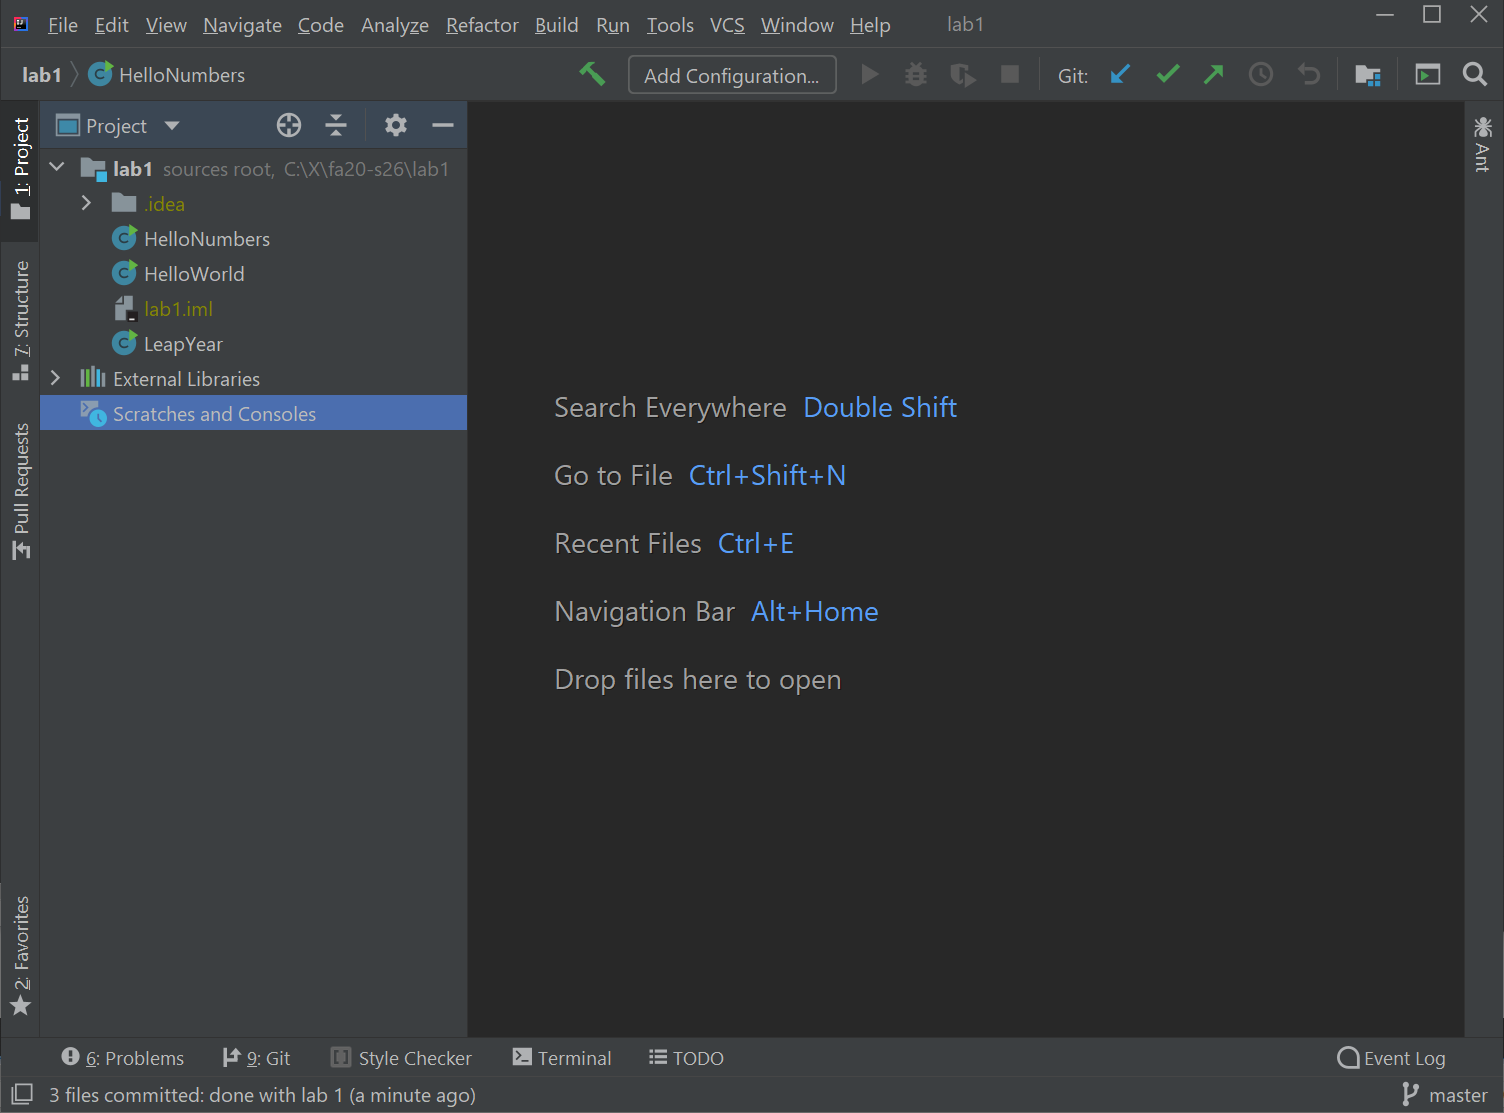
Note: The first time you start up IntelliJ it might take some time indexing files. This may take a few minutes. There should be a little progress bar in the bottom right. Some steps might not work until this is done.
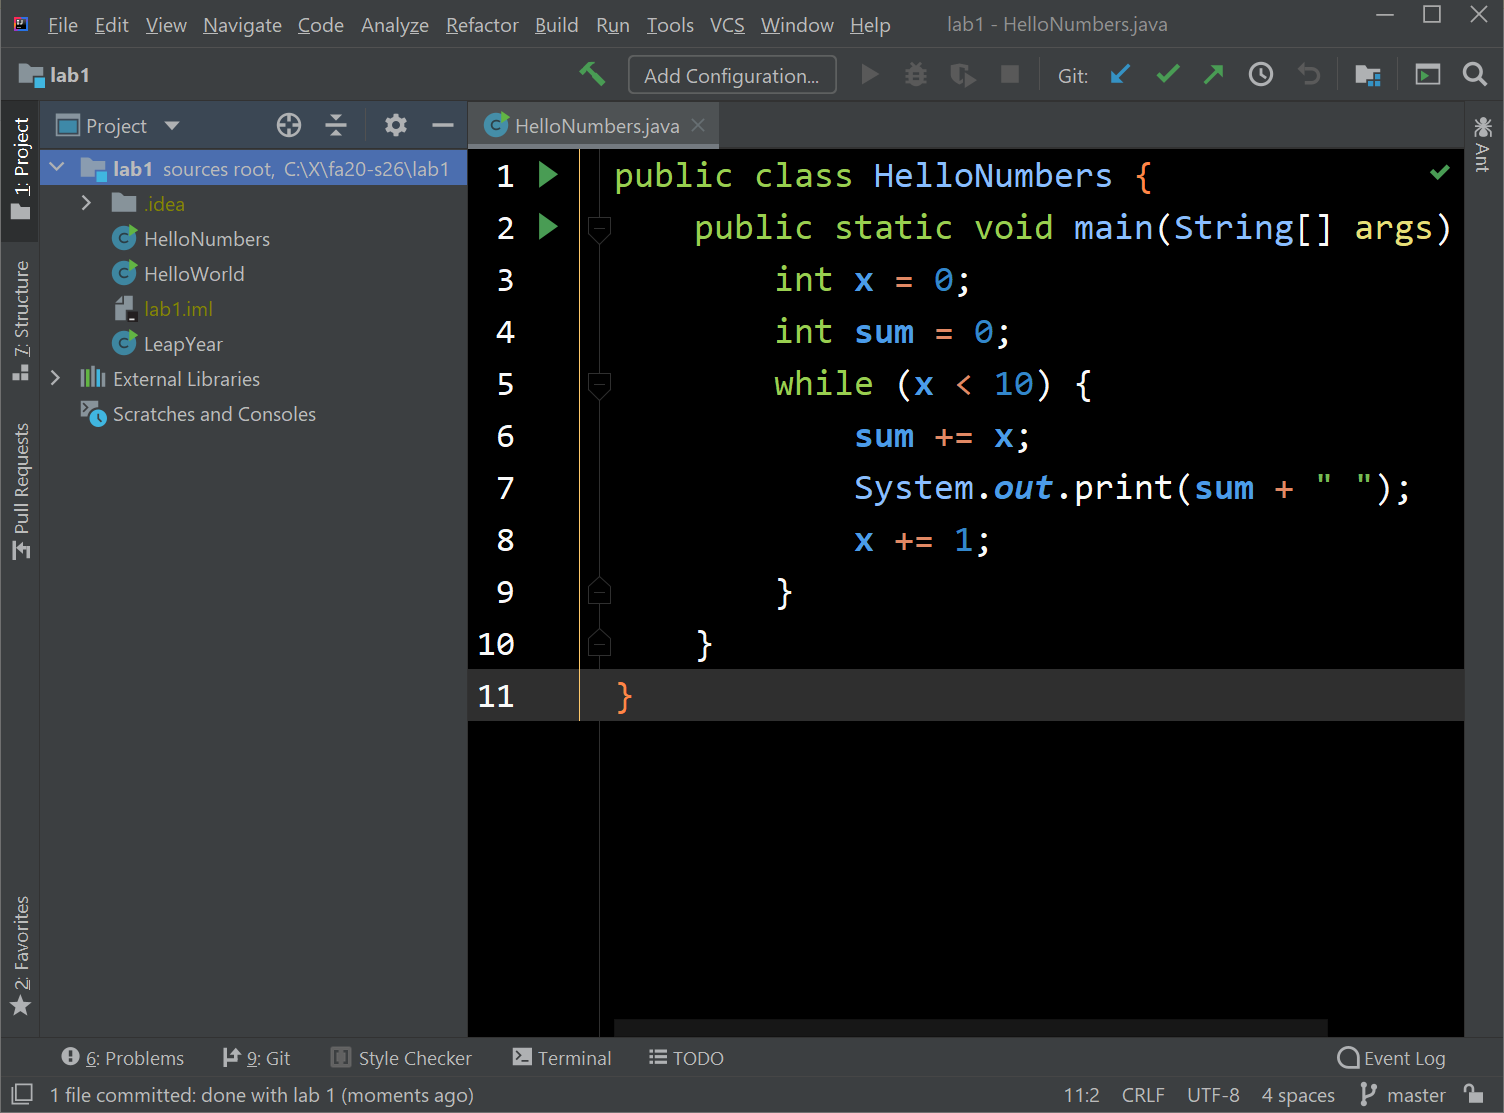
- Double click on HelloNumbers and you’ll see your HelloNumbers code appear. Your color scheme won’t look like what is shown in the picture below (which is the official Josh Hug approved color scheme, called Sunburst). If you think you’d like to use Sunburst instead, see the very end of this lab for an optional setup. There should be no errors (code highlighted in red). If you see any errors, please post to Ed or ask your lab TA.
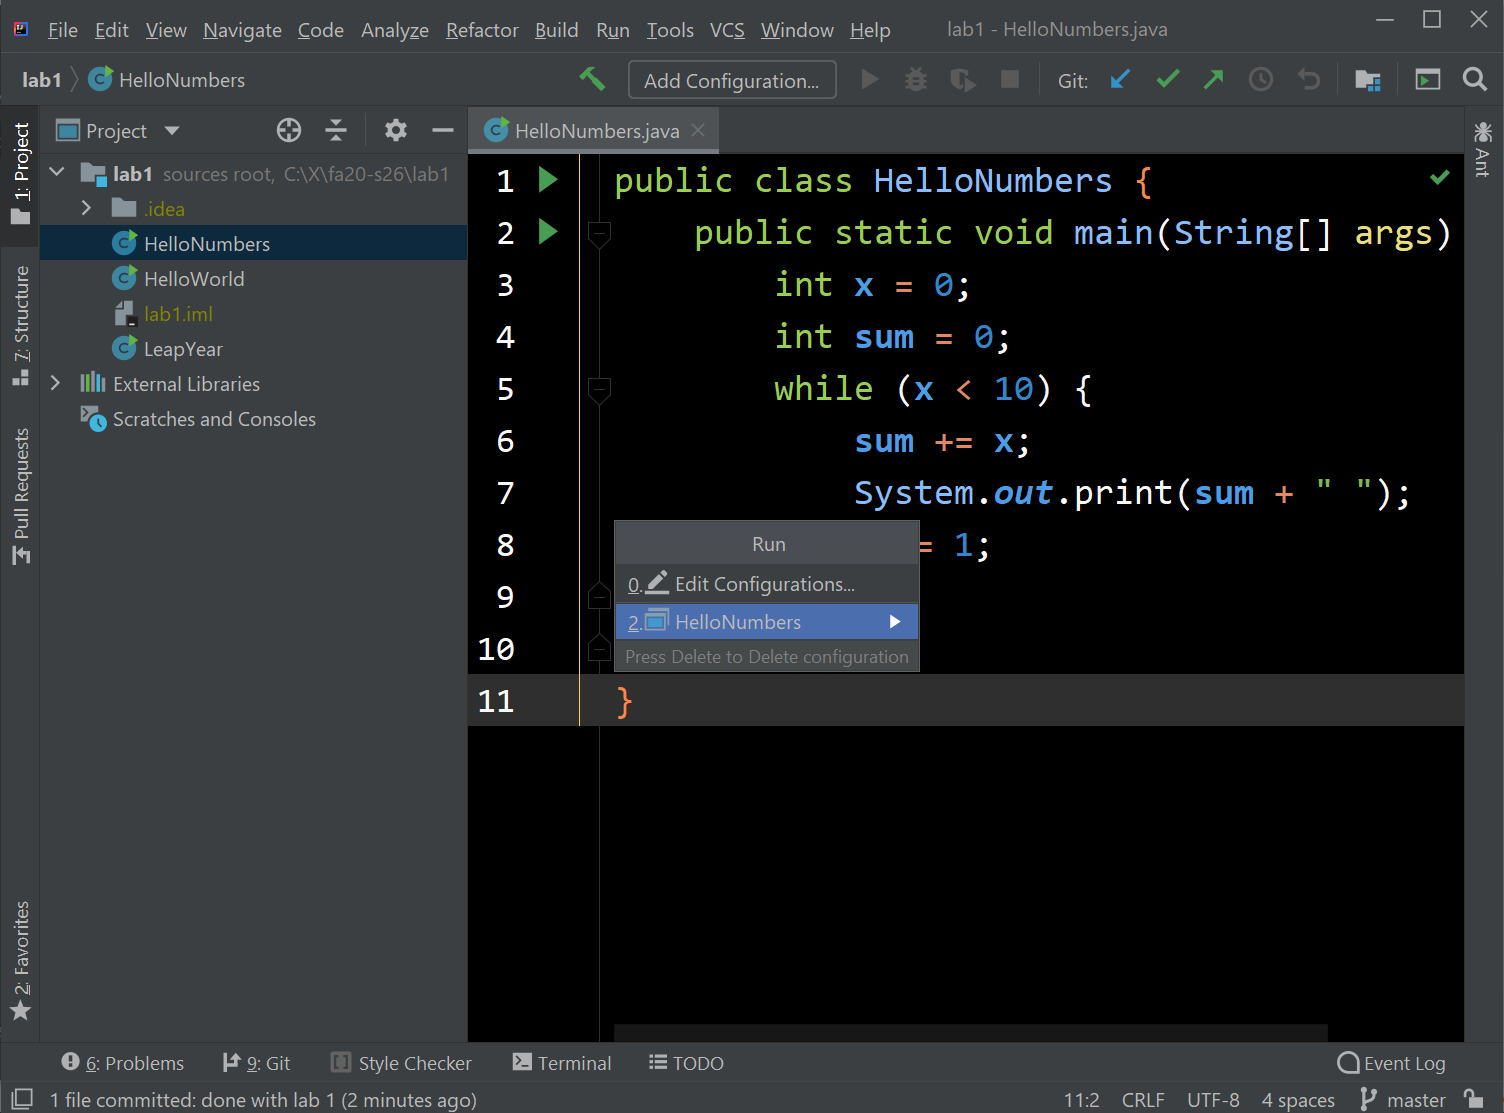
- Next, let’s run your HelloNumbers. To do this, click “Run”, then click the “Run…” option.
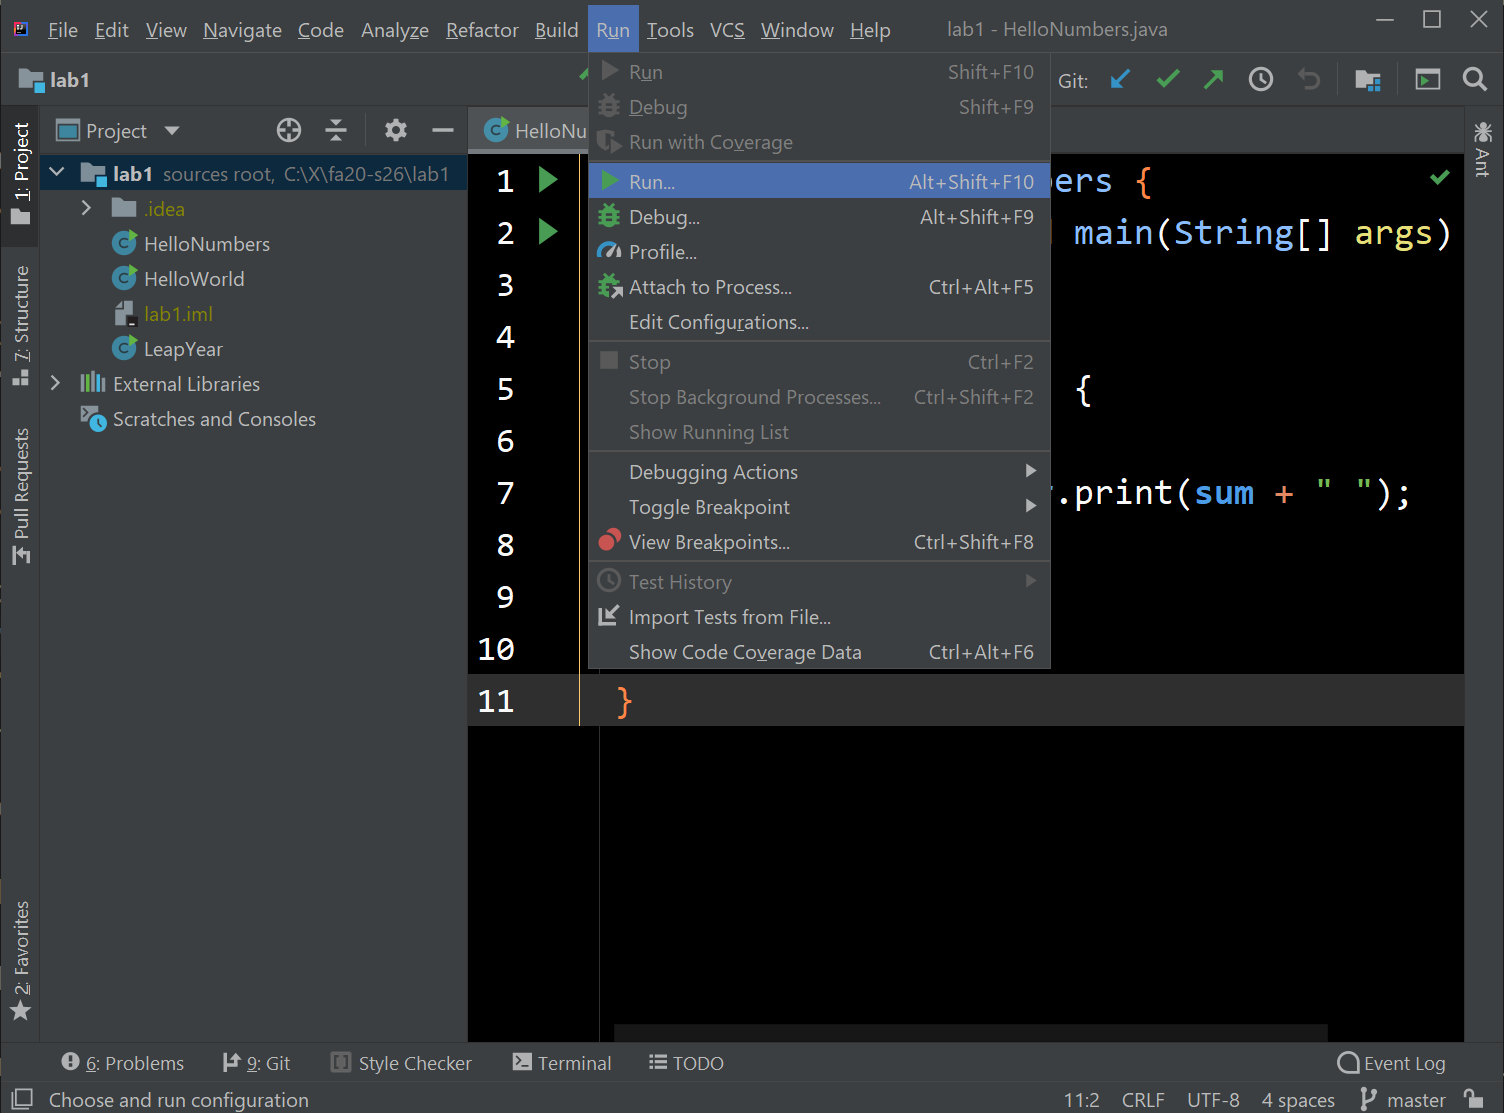
- This will bring up two choices, one called “Edit Configuration”, and one called “HelloNumbers”. IntelliJ supports all sorts of complicated configuration options for running Java programs, but we’re happy with the default here, so let’s just click on the one that says “HelloNumbers”.
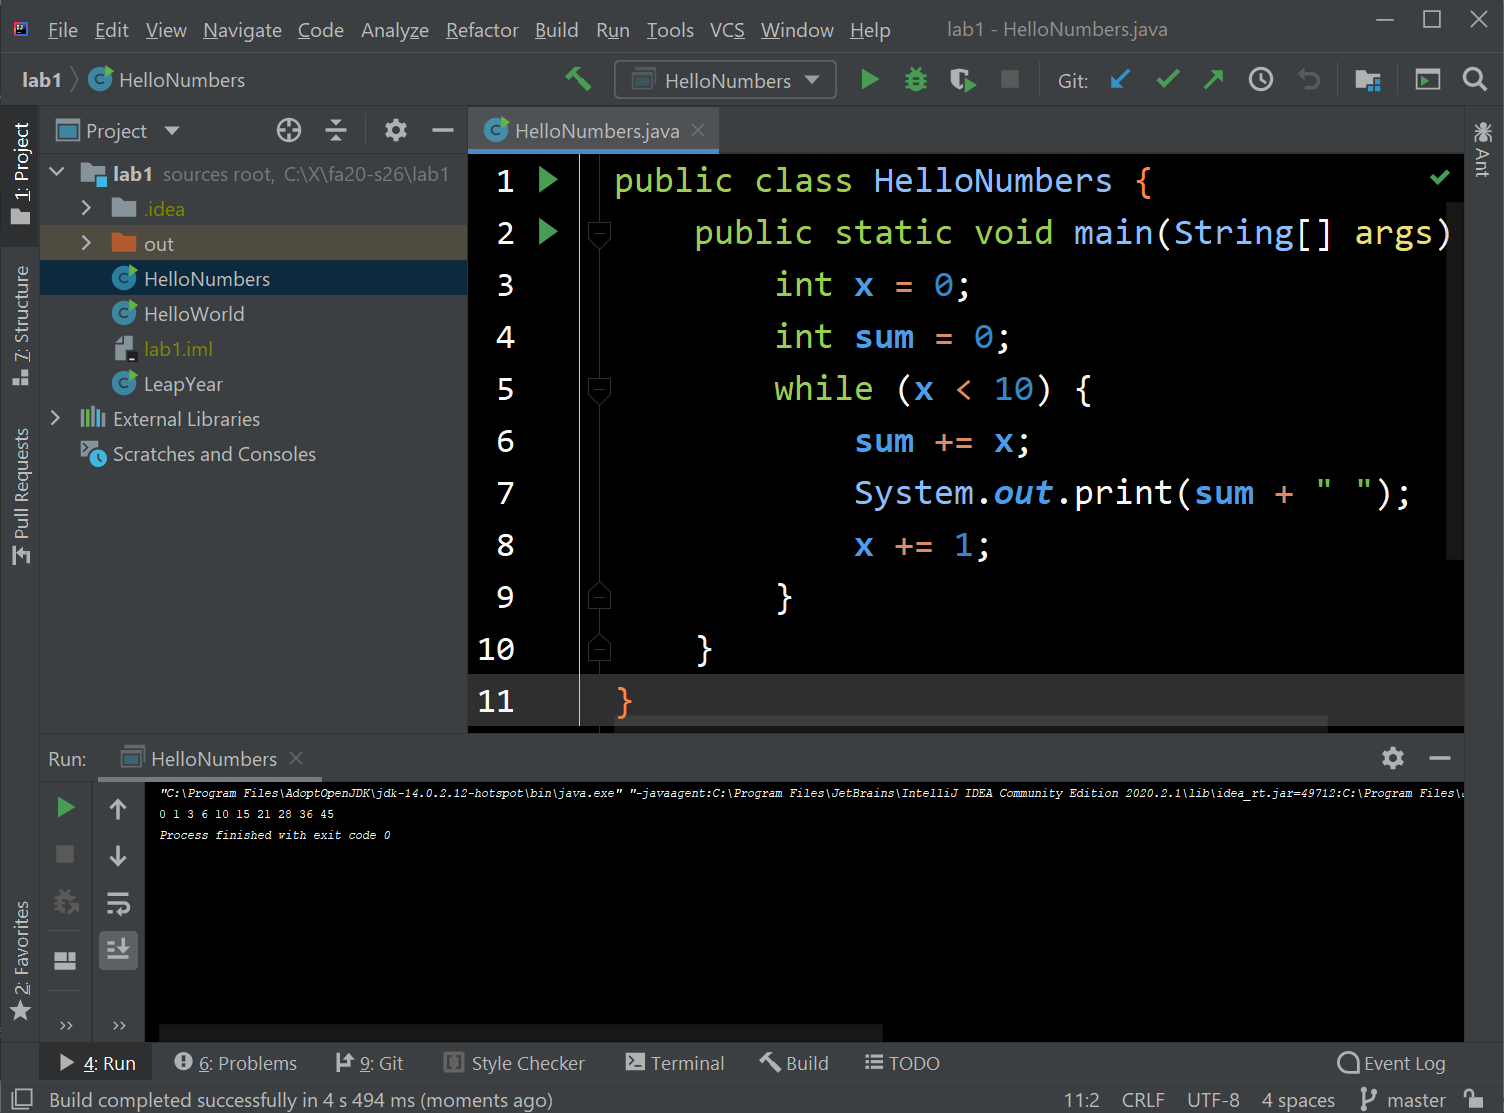
- After clicking, you’ll see your code run, as shown below. Notice the output of your program is given in the little black and white window at the bottom of the screen.
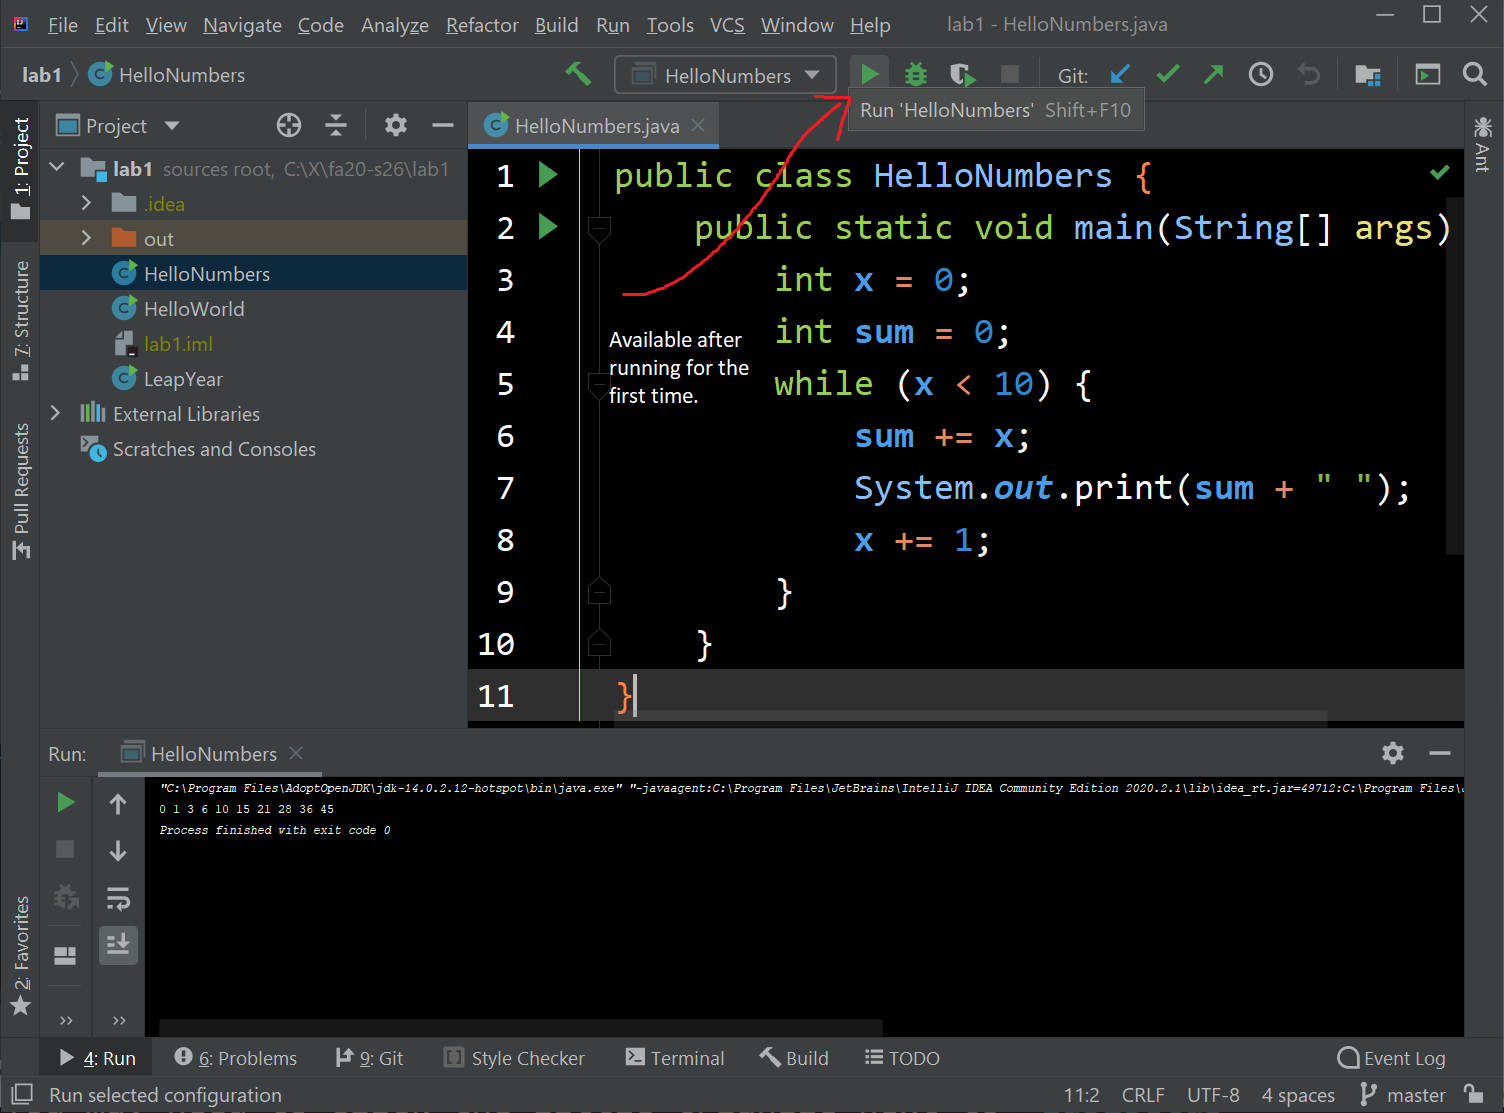
- From now on, you can also just run the green triangle button next to the class name. This is because Java has created a default run configuration for this class. Note that you’ll need to do the Run → Run… thing for any new class that you create or import.
- Now click “File → Close Project”, and you should find yourself back at the main IntelliJ screen. This time use “Open or Import” and choose your lab2setup directory, then press the OK button. Once you’ve pressed finish, you should see something really similar to the following image. Again, you may need to click the little triangle next to
lab2setupin the top left to get the source files (Dog.javaandDogTest.java) forlab2setupto show up. If you don’t see the sidebar, go to View → Tool Windows → Project, or select “Project” on the left toolbar.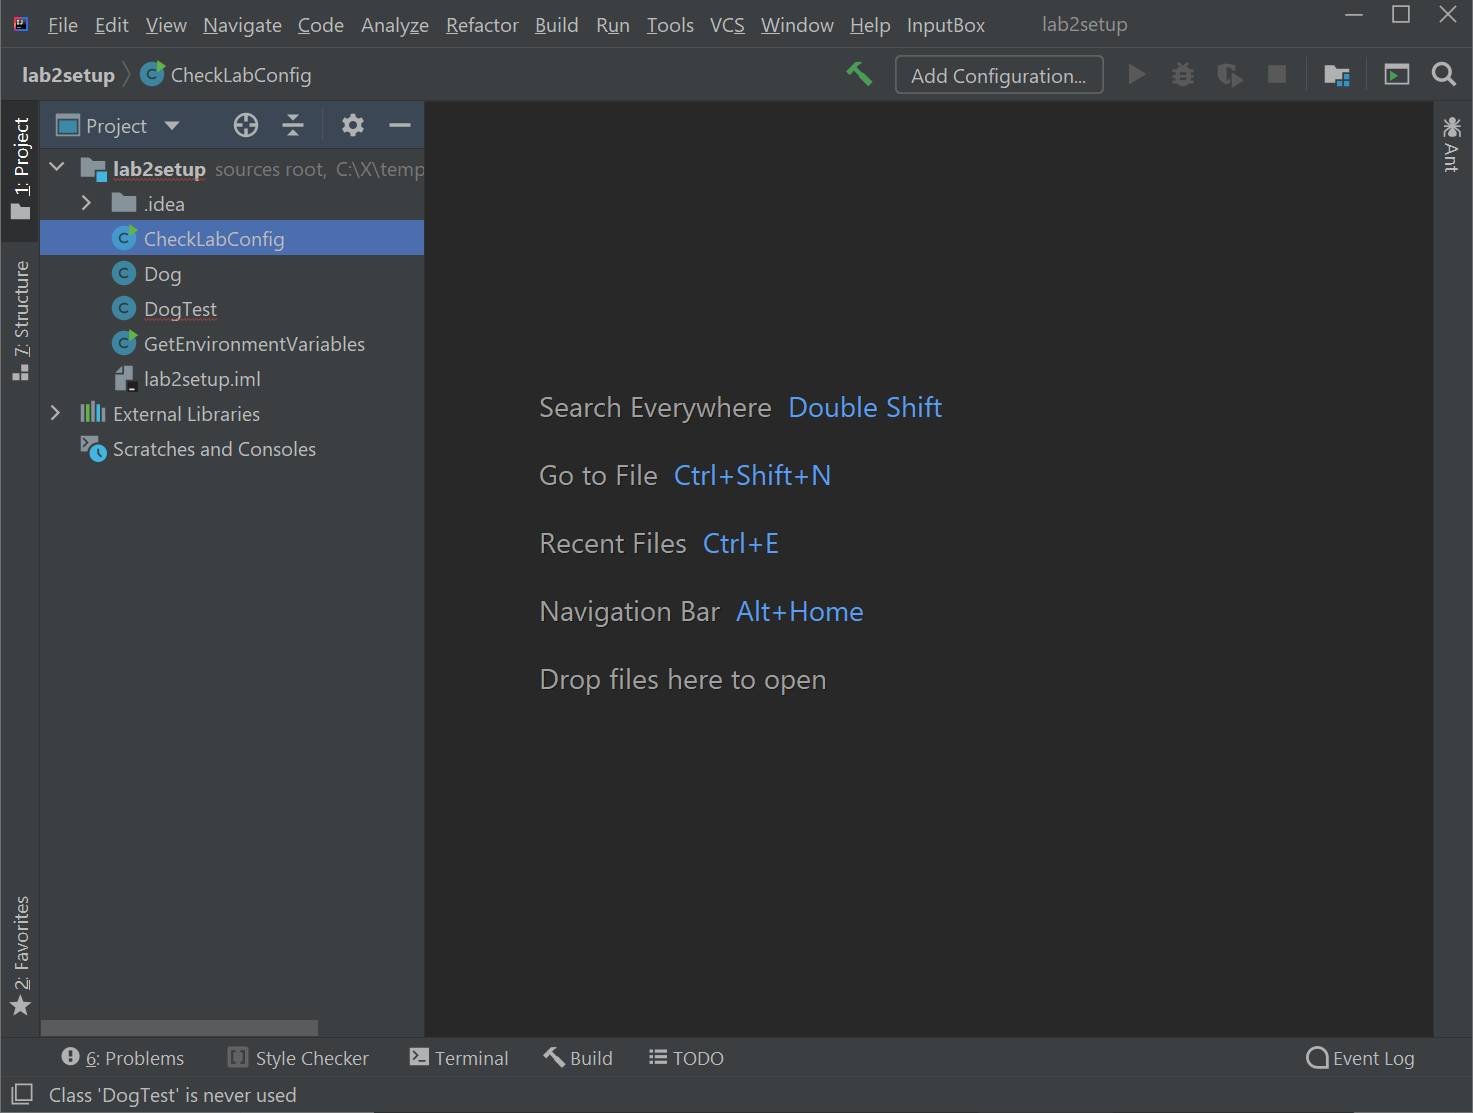
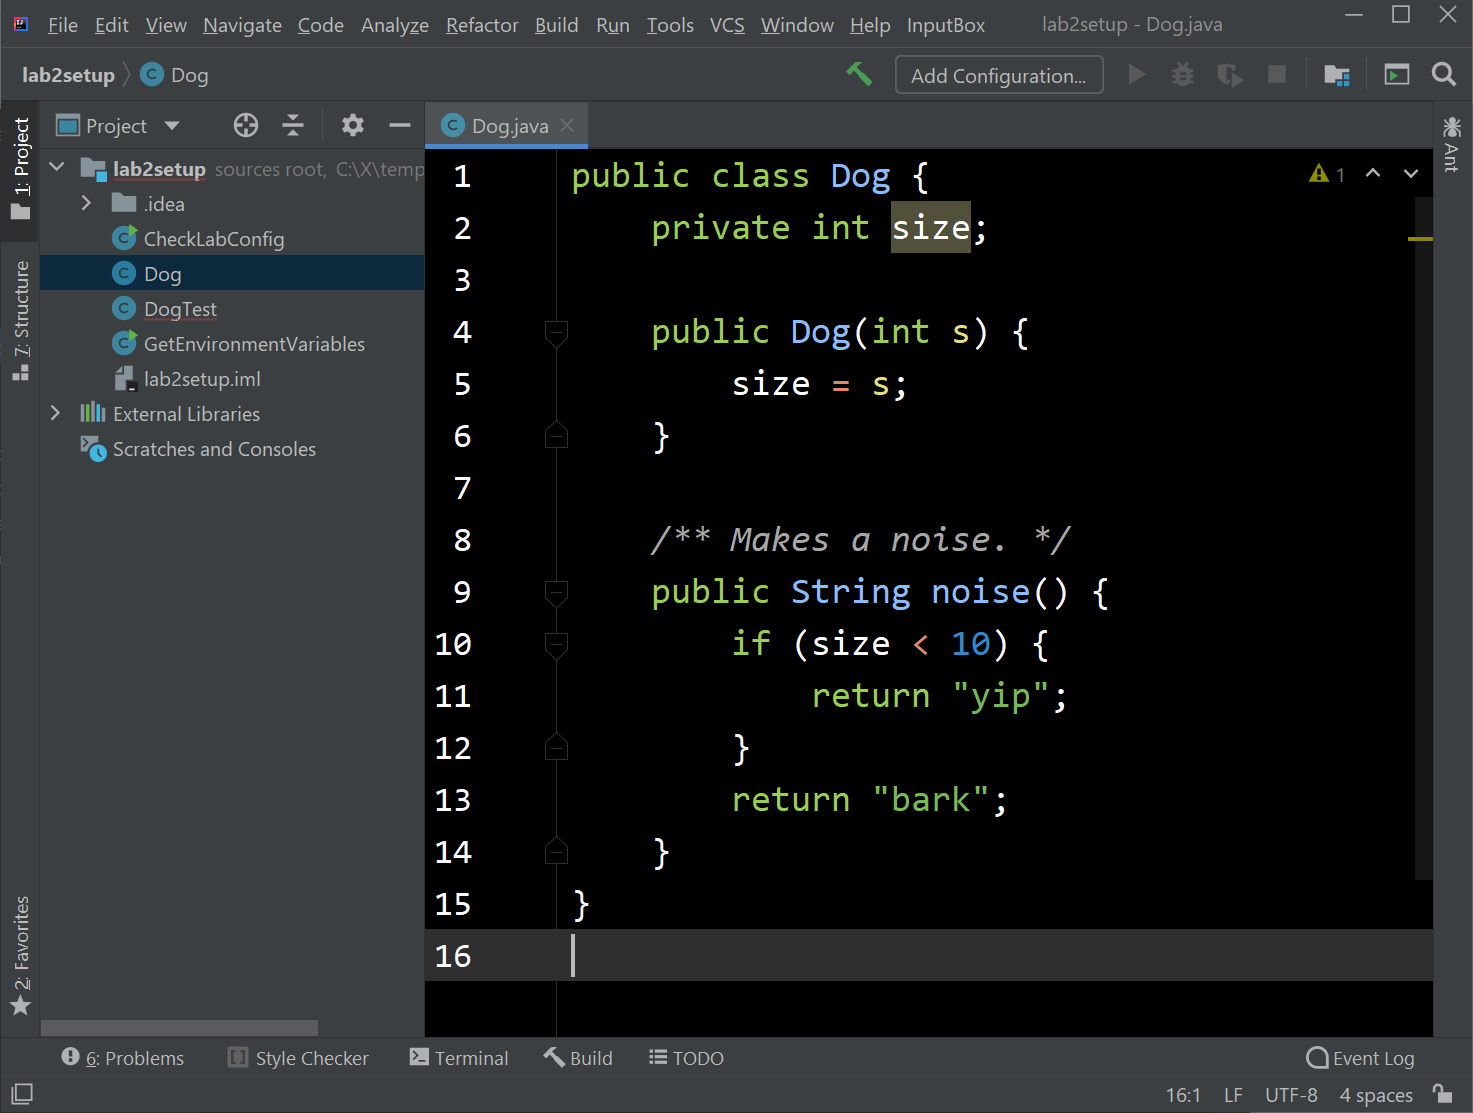
- Double click on Dog.java, and you should see something like the screen below. There should be no errors (given in red). If you see any errors, please post to Ed or ask your lab TA.
- Now double click on DogTest.java, and you should see something like the screen below. Notice that there are now lots of errors, shown in red.
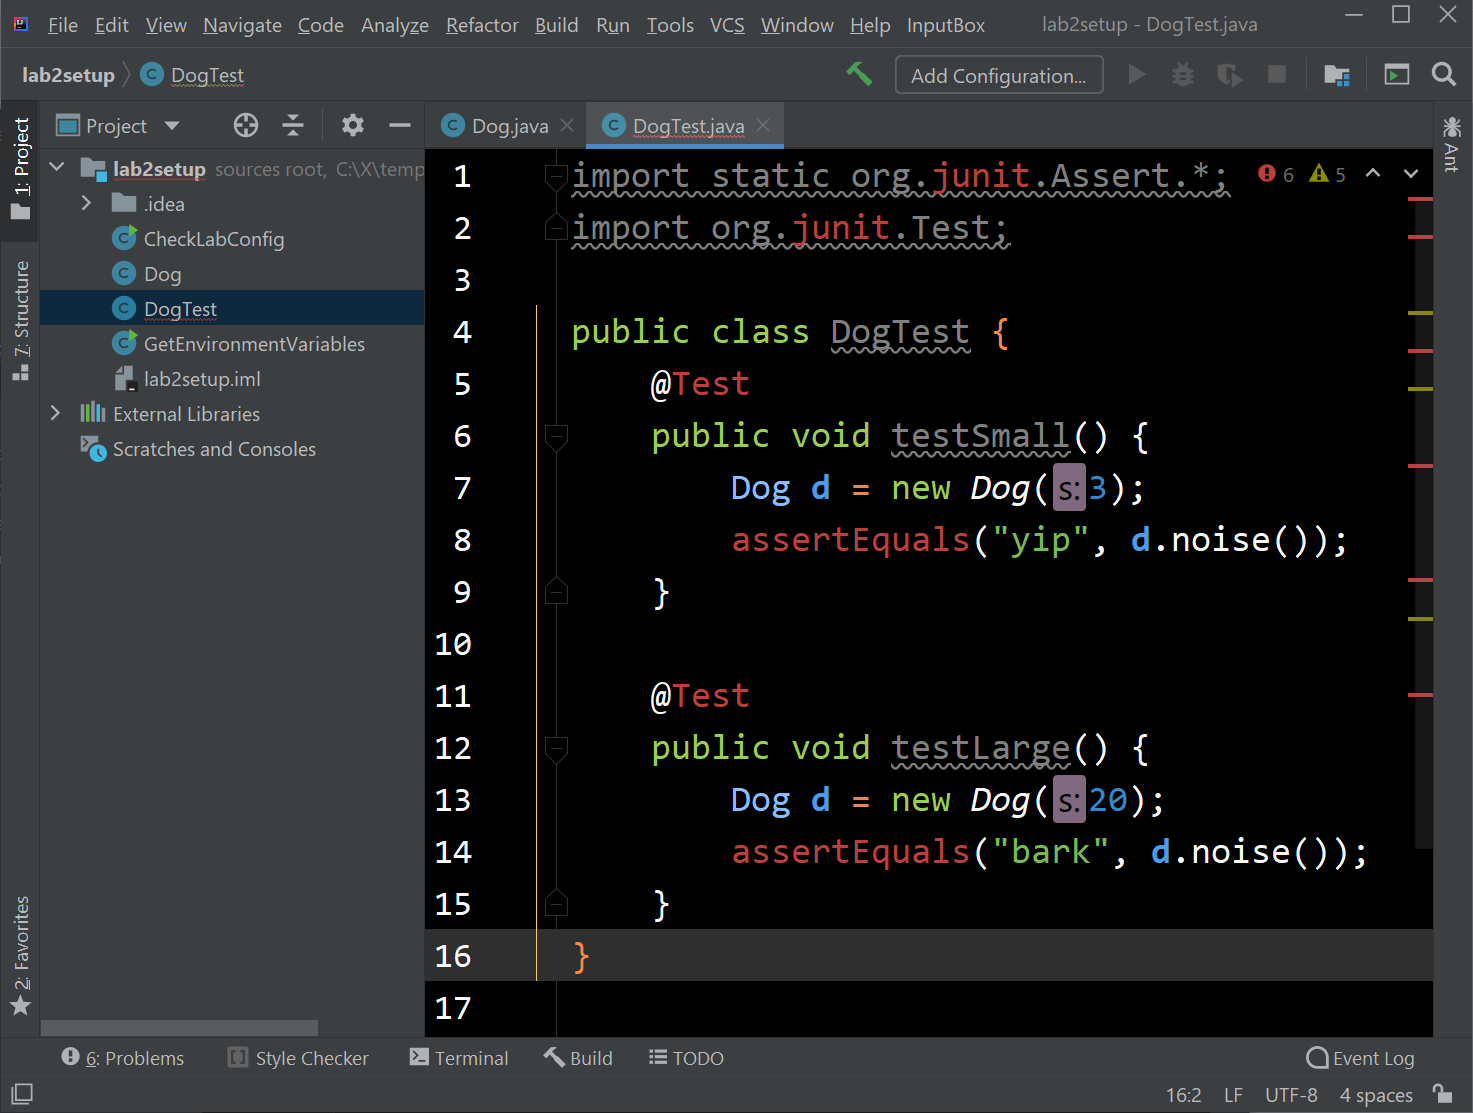
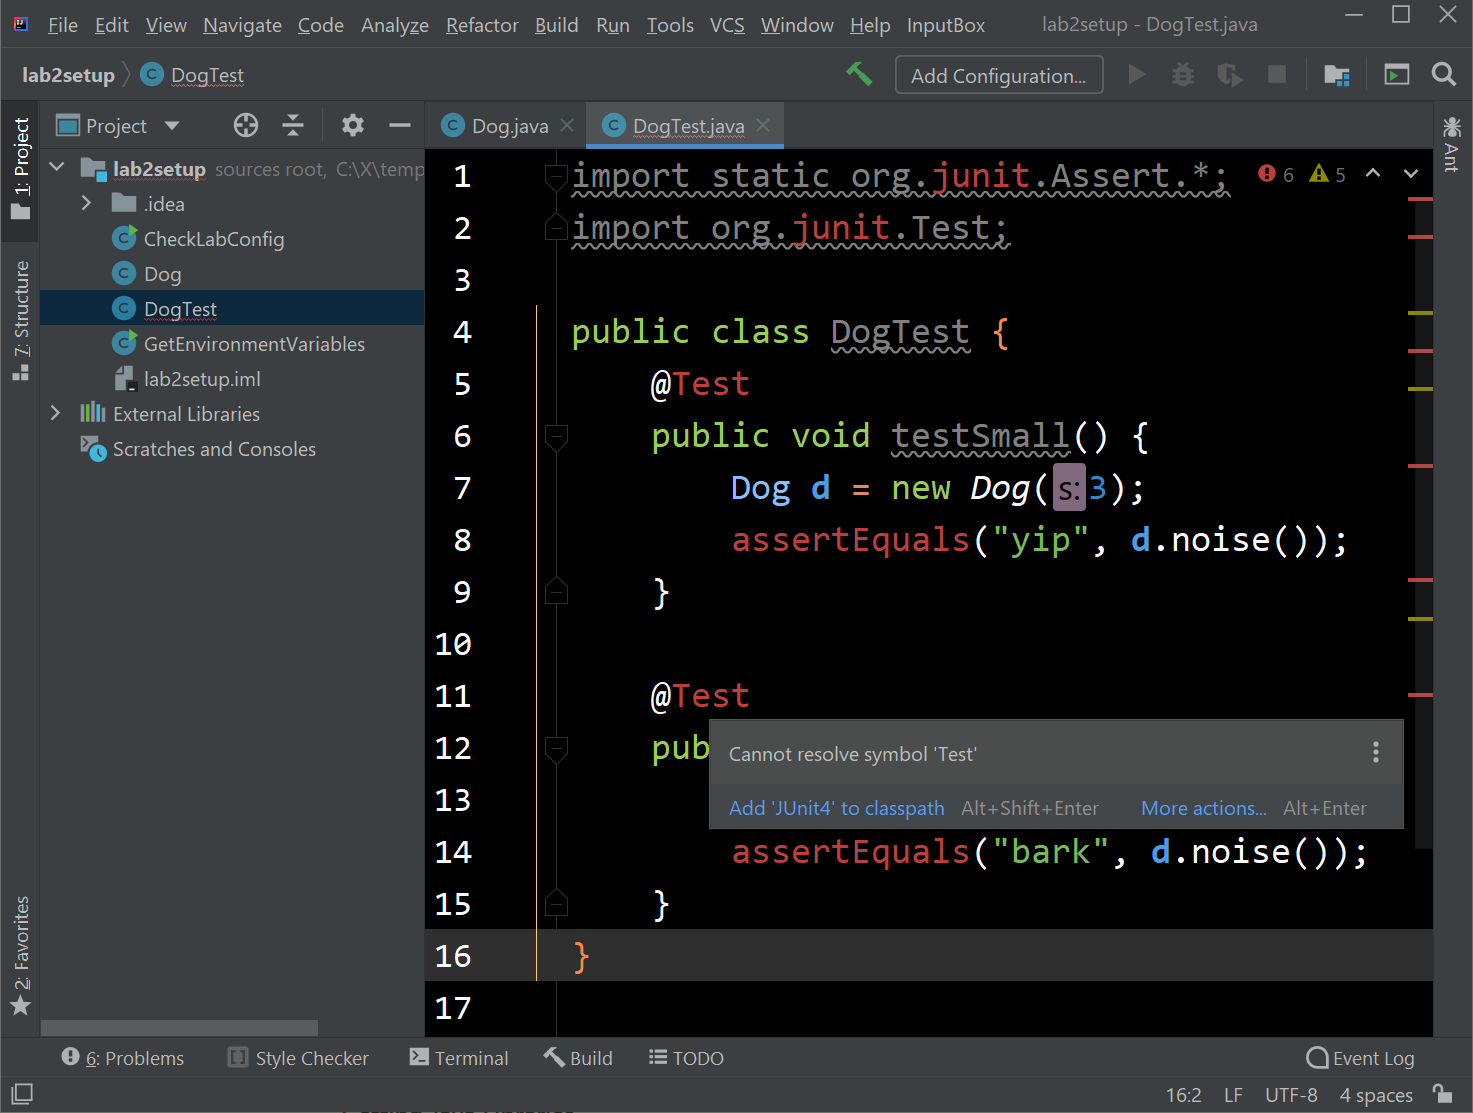
Hover over one of the red pieces of code. You’ll see that the problem is that Java cannot “resolve” something. This is because we haven’t downloaded the official 61B libraries. We’ll be doing this in the next section of this lab.
Getting Java Libraries
We are now going to download some Java libraries that you’ll need to complete future assignments (including this one).
First, open up a terminal window and
cdinto yourfa20-s**repository.Run
git submodule update --init
You should get output like this:
Submodule 'library-fa20' (https://github.com/Berkeley-CS61B/library-fa20) registered for path './'
Cloning into '/Users/Connor/Downloads/fa20-s1/library-fa20'...
Submodule path './': checked out '1fbc26d69f044b48346849989aeeff9761b00abf'
Ta-da! You now have libraries!
$ ls library-fa20/
data/
javalib/
Below is shown the directory structure of
library-fa20. Look inside the folder and make sure you see the seven .jar files listed below. If you’re using your operating system’s file explorer the ‘jar’ part might not show up in the filenames, and that’s OK.library-fa20/ └── javalib ├── algs4.jar ├── hamcrest-core-1.3.jar ├── jh61b.jar ├── junit-4.12.jar ├── stdlib-package.jar ├── stdlib.jar └── xchart-3.5.1.jarImporting Libraries and Running Code
Now it’s time to get rid of the errors in DogTest.java.
Click “File” → “Project Structure” in the top left of IntelliJ. A window should pop up, and you should click Libraries on the left panel of this window. Then click the plus sign at the top left of the window and you should see an option pop up that says “Java”, “From Maven”, and “Kotlin/JS” as shown below.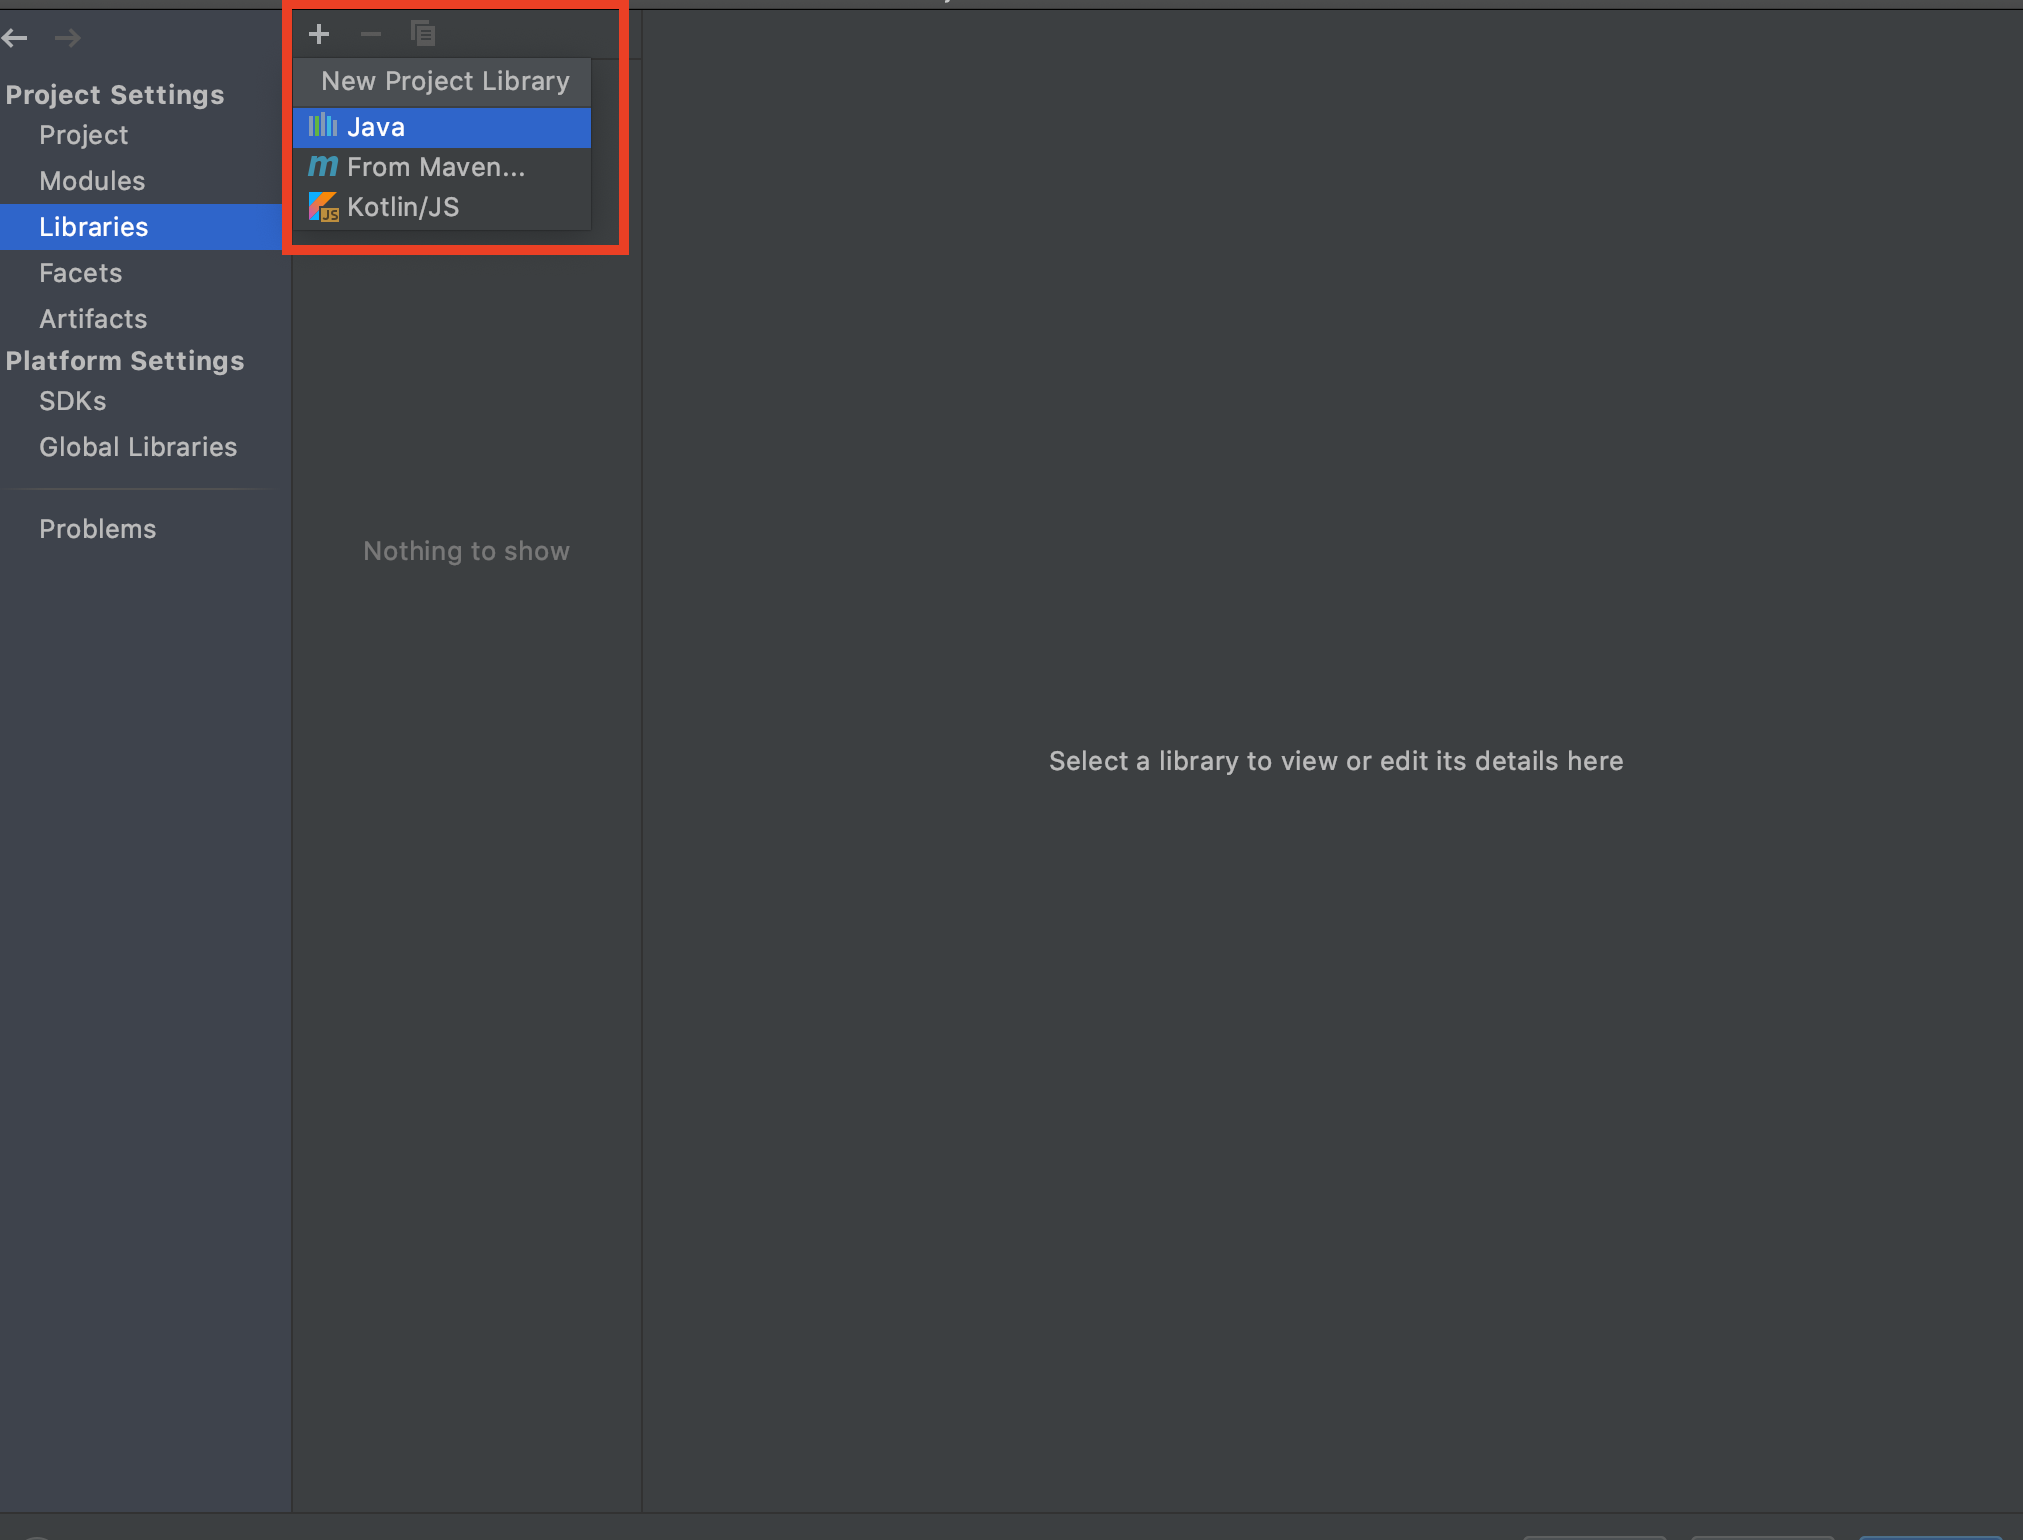
Click on the word Java, and navigate to thejavalibfolder (which is inlibrary-fa20). With the library-fa20 fold highlighted, press OK. Then press OK at the next window again.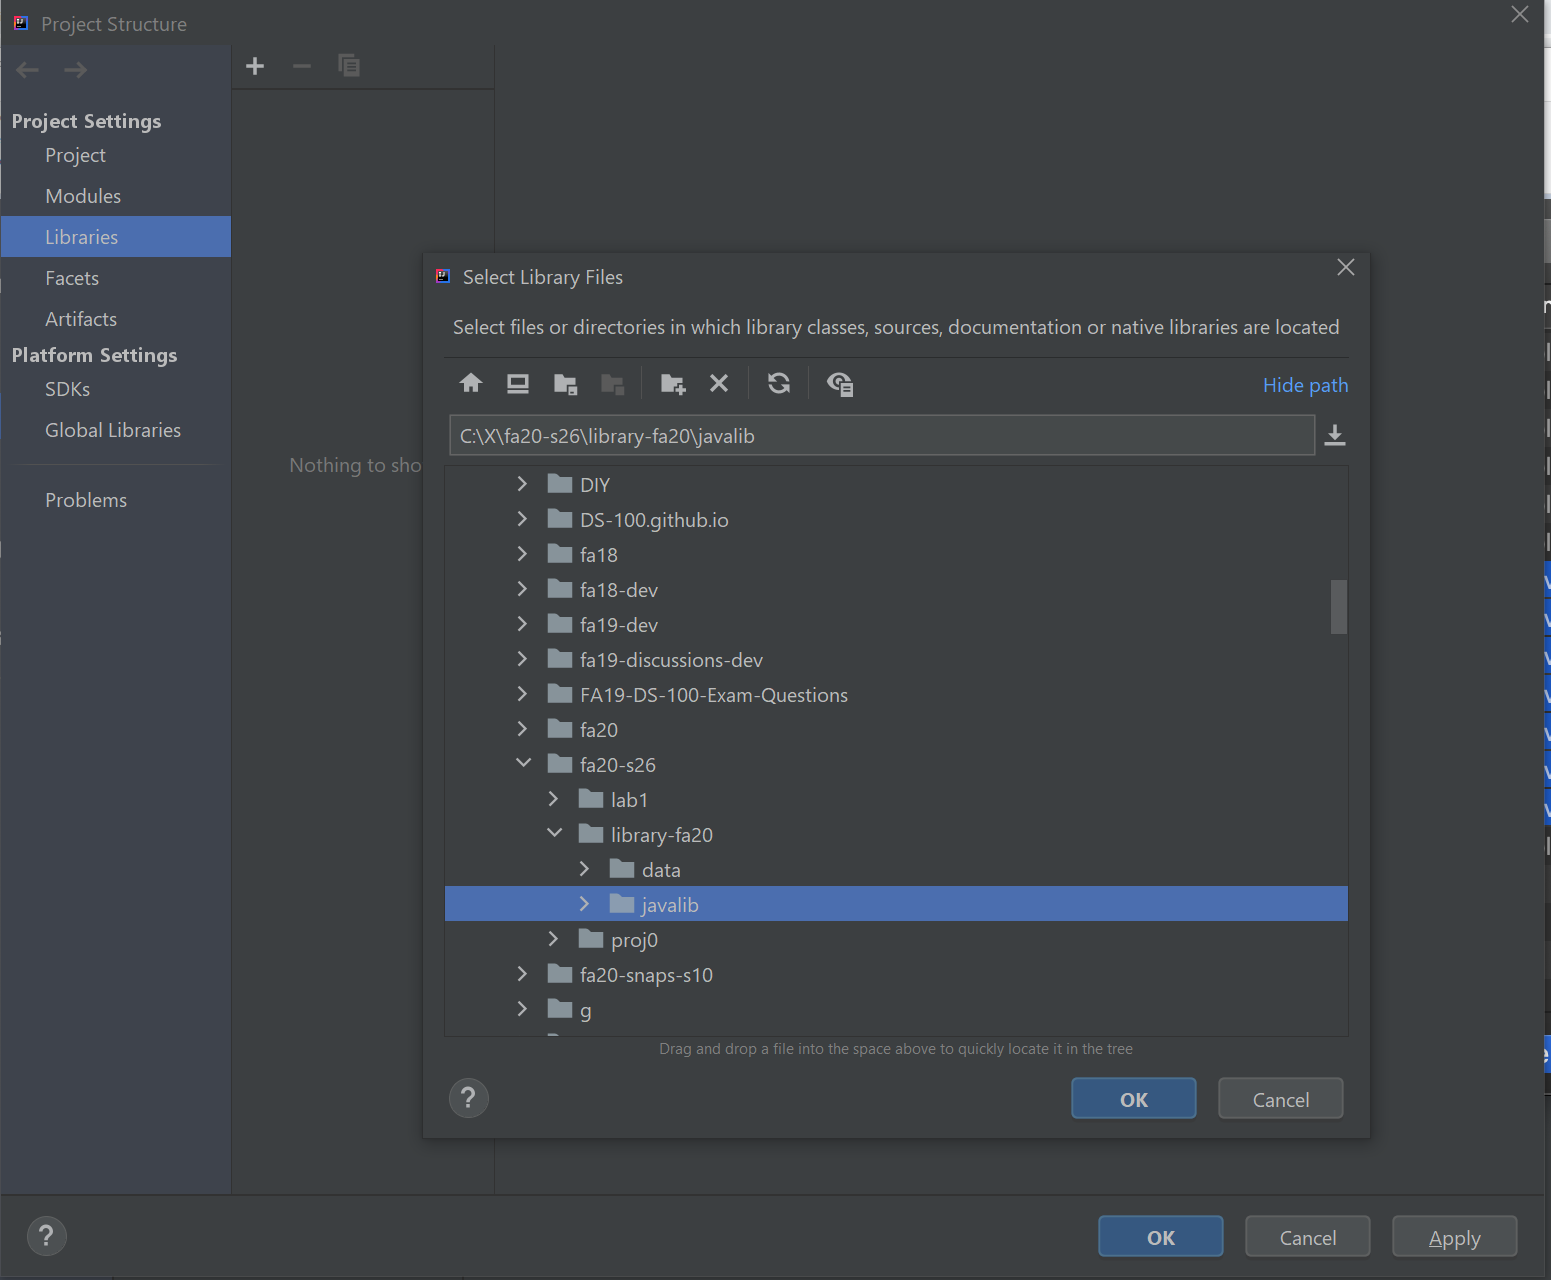
If you did everything correctly, you should see something similar to the screen below.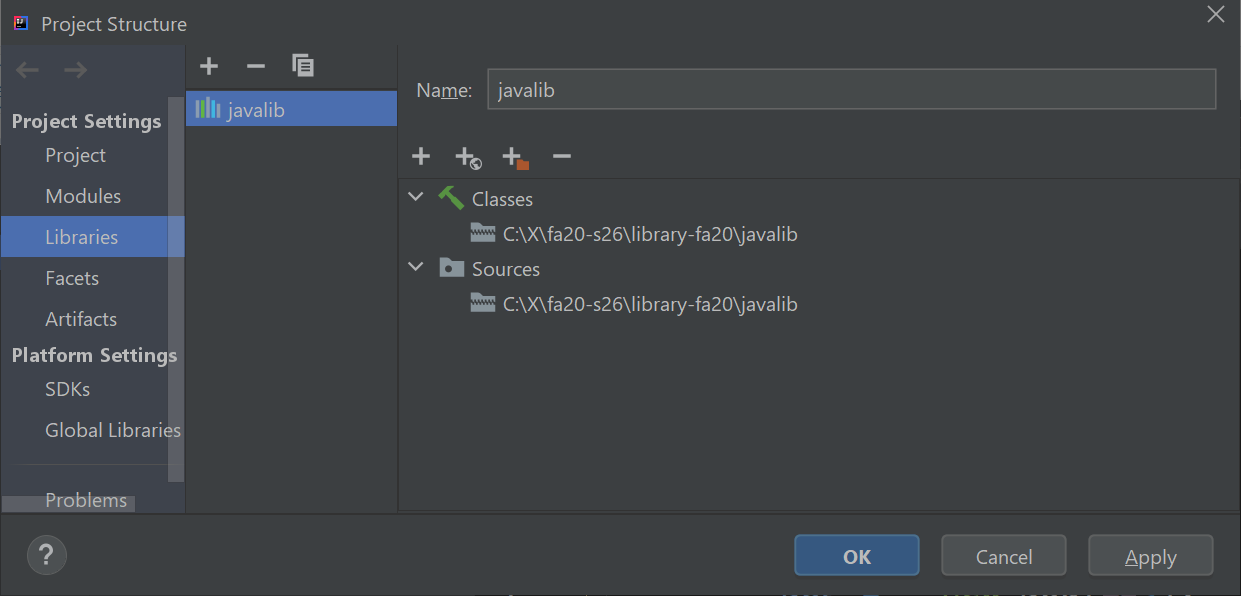
Press OK one more time, and you’ll find yourself looking at DogTest.java again. This time, the red text should be gone. Note: You’ll need to import the library-fa20 folder every time you open a new hw, lab, or project in 61B!
Try running the code by clicking “Run” → “Run…“, as shown below.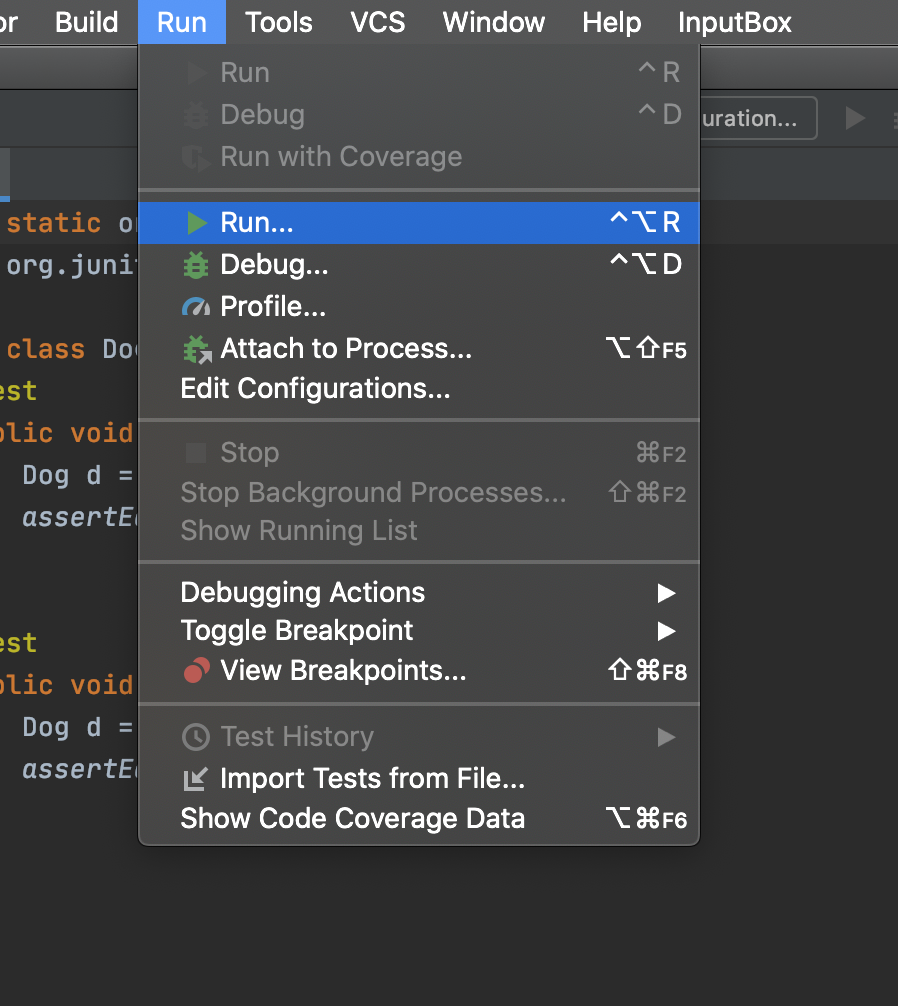
This will probably pop up a very small dialog window like the one shown. Basically IntelliJ is saying that it isn’t quite sure what you mean by running the program and is giving you three choices (yours may look slightly different).
- Option 0 is to edit the configuration before running the program (which we won’t do).
- Option 2 is to run the tests in the DogTest class.
- Option 3 is ALSO to run the tests in the DogTest class.
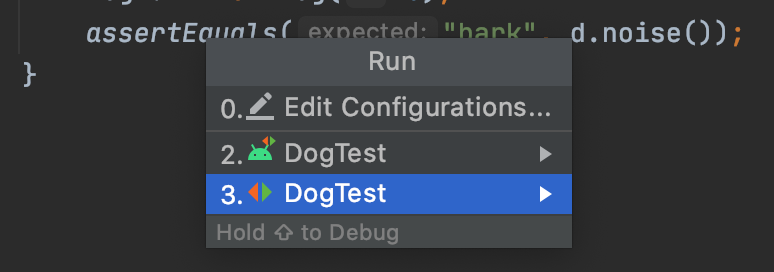
Click on either of the DogTest options and a green bar should appear with the message “Tests passed: 2 of 2 tests” as shown below.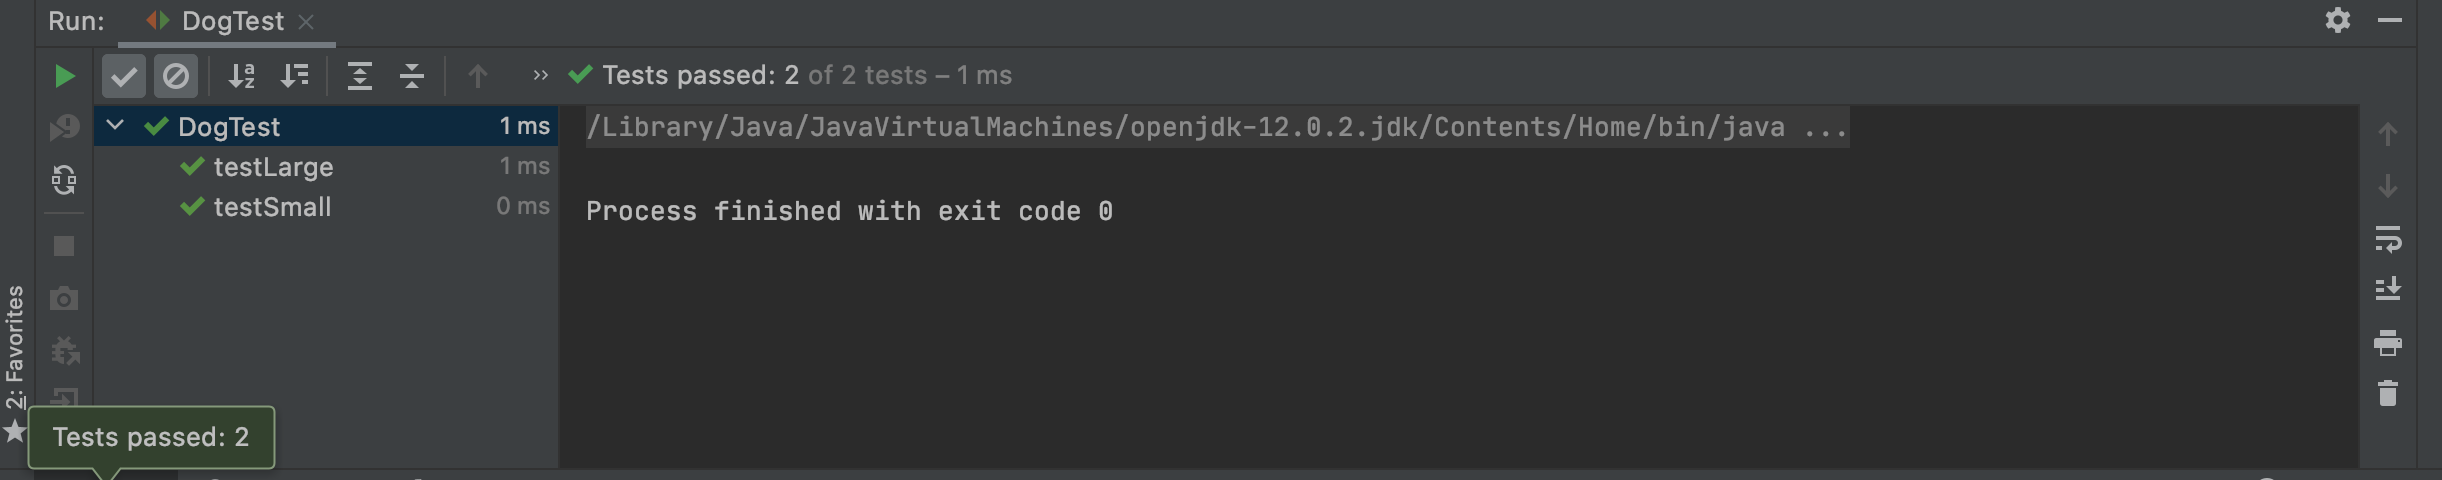
As happened earlier with HelloNumbers, You’ll notice after running your code that the green play and green bug icons in the upper right are now green; this is because when you clicked “2.”, IntelliJ memorized what you meant by Run for this project and you can now click this button to run your program. You’ll learn more about this over time as we use more advanced features of IntelliJ.
In case you’re curious why there were two DogTest icons above, it’s because one of them runs the tests as if it is designed for the Android operating system (the little alien) and the other (red and green triangles) runs the test as if it is just plain old Java. For our class, these two choices will always do the exact same thing.
CS 61B Snaps
The Snaps plugin keeps frequent snapshots of your work and saves them to a repository. This will act as a safe backup of your work. The plugin will also provide a record of how you arrived at your solution. With your explicit written permission (details later), we will later be conducting a research project to study the various paths taken by students to solve problems, and to understand how the total time spent varies with respect to demographic factors like prior programing experience.
Getting the Snaps Repo
In lab1, you should have gotten and accepted an invitation to collaborate on a snaps-fa20-s*** repo. If you have not accepted it, please do not proceed until you do. If you can’t find the invitation in your email inbox, please post on Ed or come to lab, so we can help you.
NOTE: You may have accidentally received an invite for a repo that looks like fa20-snaps-s*** (note the ‘fa20’ in the front) - you can just ignore this repo, but please make sure you have access to your snaps-fa20-s*** repo
First, we will clone the snaps repo to your computer. In your terminal (Git Bash on Windows), navigate to your home directory: cd ~. Then, run the following command, replacing * with your repo number:
git clone https://github.com/Berkeley-CS61B-Student/snaps-fa20-s***
If you run ls, you should now see the snaps-fa20-s*** folder.
IMPORTANT: Never complete assignments in this folder. Gradescope tests will always fail if you submit code from the snaps folder. You should only interact with your fa20-s* folder.
Setting Up Environment Variables
Next you’ll need to set up some environment variables. The precise steps to take depend on your operating system.
If you are a Mac user, verify what Mac OS version you are running. Click on the Apple logo at the top left corner of your screen. Then, click on “About This Mac”. If you are running Mac OS Catalina, choose that option below.
Once you’ve completed the steps in the appropriate instructions above, then continue on to “Test Your Environment Variables” below.
Test Your Environment Variables
After setting up the environment variables above, restart IntelliJ, and all terminal windows (close them and open a new one), so the variables can take effect.
After reopening IntelliJ, make sure the lab2setup folder is open in IntelliJ. Verify that you set the environment variables correctly by opening CheckLabConfig. Then click Run and go down to the option that says “Run…”.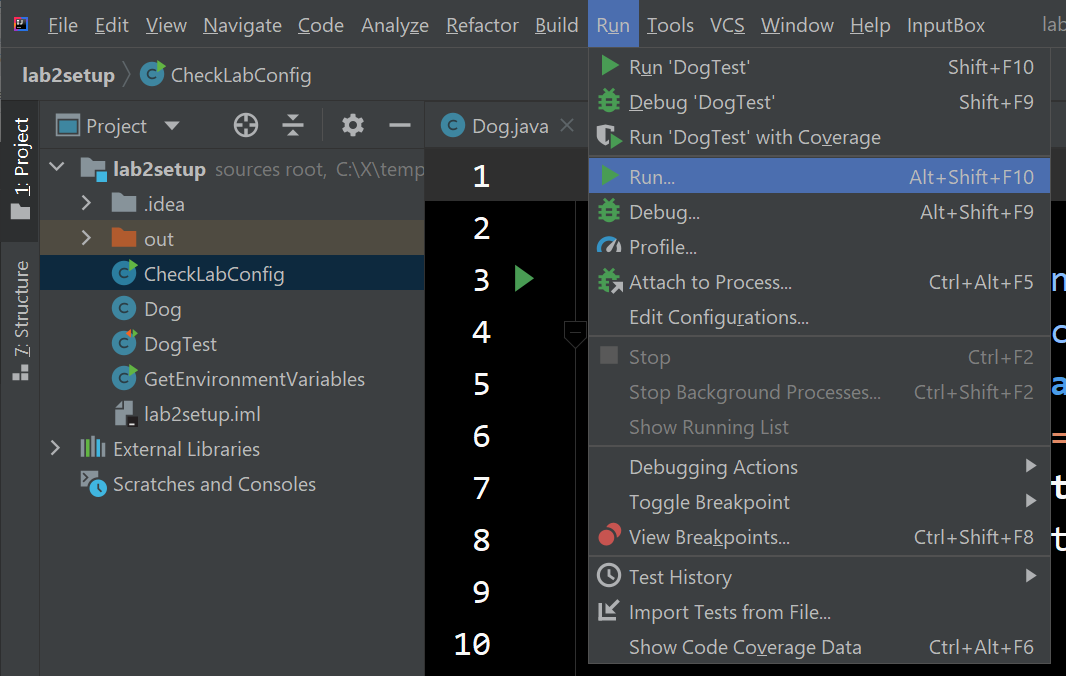
Now click on the option that contains CheckLabConfig: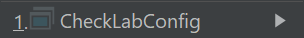
This should run the main method of our CheckLabConfig class. If everything is working, you should see something like the image shown below: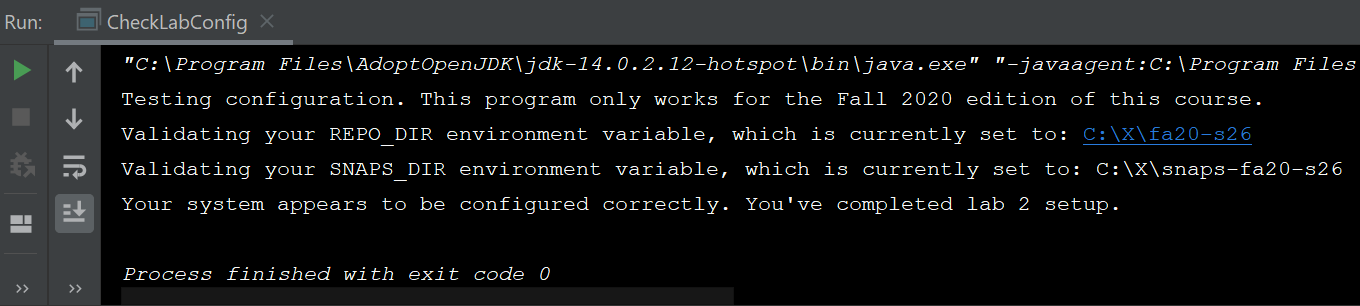
You’re now done with lab 2 setup!
Josh Hug’s Color Scheme (Optional)
I’m not a big fan of the default IntelliJ colors, so I made my own color scheme, which is a very close imitation of the extremely good Sunburst theme for Sublime. To use my theme, download hug_sunburst, and import it using the “File→Manage IDE Settings→Import Settings” option in IntelliJ. You might end up with large text, which I use for recording videos. To adjust the size of the font in Intellij to your liking, see this link.
Unit Testing with JUnit and IntLists
Pre-lab
- Lab 2 Setup
- Run
git pull skeleton masterin your repo. You should get alab2/folder.Introduction
In this lab, you will learn about basic IntelliJ features, destructive vs. non-destructive methods, and IntLists.
Your job for this assignment is to run through the debugging exercises and to create methods forIntList.java.Lab 2 Check-Off
In the mandatory check-off for this lab, a TA or an Academic Intern will verify that you set up your computer correctly, and will walk you through the installation of the CS 61B Snaps plugin for IntelliJ. To get checked-off, add yourself to the Office Hours queue and put in your ticket description your virtual location and “Lab 2 Checkoff” in the description. You can also get checked off next week in office hours and lab. Upon completion of the lab checkoff, we will tell you what to put into the magic word file in order to pass the autograder. If there’s a long wait, feel free to continue working on the lab until your name is called. In other words, you can complete this mandatory checkoff in any lab or office hours from now until 9/11 (when this lab is due) - you do not have to get checked off in the lab section you normally attend.
Note that there may be a longer wait than usual as each checkoff takes about 5-10 minutes to complete. We will do our best to check you off as soon as possible! Some TAs may have their own queue policy in their lab to optimize checkoff times.Debugger Basics
Repeat the “Project Setup” process from lab 2 setup. However, this time, you should “open or import” yourlab2directory instead of yourlab2setupdirectory.
After importing, your IntelliJ should look something like the following: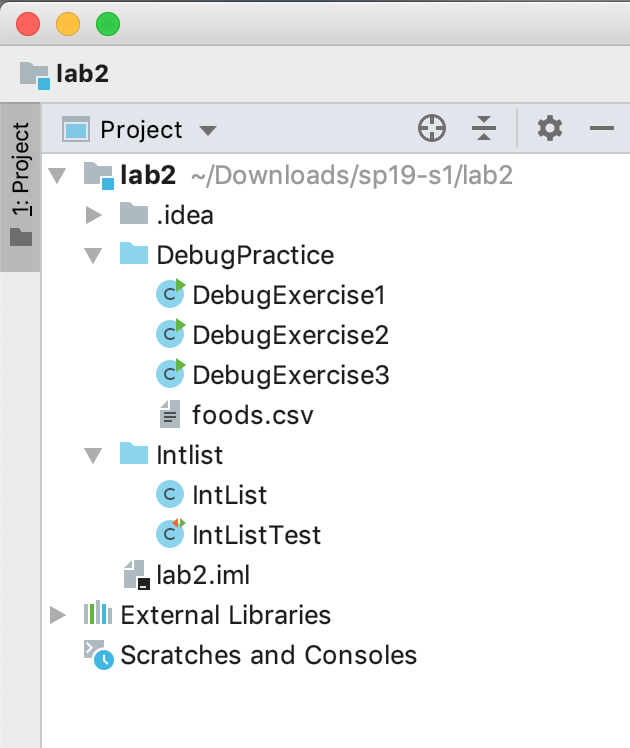
Next, you’ll need to use “File” → “Project Structure” to import the 61b libraries, just like in lab2setup. See the section titled “Importing Libraries and Running Code” in lab2setup.Breakpoints and Step Into
We’ll start by running the main method inDebugExercise1. Open up this file in IntelliJ and click the run button. You should see three statements printed to the console, one of which should strike you as incorrect. If you’re not sure how to runDebugExercise1, right click on it in the list of files and click theRun DebugExercise1.mainbutton as shown below: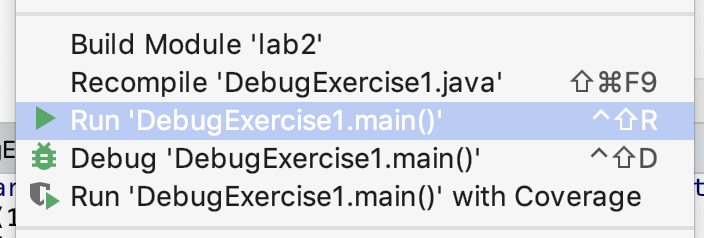
Somewhere in our code there is a bug, but don’t go carefully reading the code for it! While you might be able to spot this particular bug, often bugs are nearly impossible to see without actually trying to run the code and probe what’s going on as it executes.
Many of you have had lots of experience with using print statements to probe what a program is thinking as it runs. While print statements can be very useful for debugging, they have a few disadvantages:
- They require you to modify your code (to add print statements).
- They require you to explicitly state what you want to know (since you have to say precisely what you want to print).
- And they provide their results in a format that can be hard to read, since it’s just a big blob of text in the execution window.
Often (but not always) it takes less time and mental effort to find a bug if you use a debugger. The IntelliJ debugger allows you to pause the code in the middle of execution, step the code line by line, and even visualize the organization of complex data structures like linked lists.
While they are powerful, debuggers have to be used properly to gain any advantage. We encourage you to do what one might call “scientific debugging”, that is, debugging by using something quite similar to the scientific method!
Generally speaking, you should formulate hypotheses about how segments of your code should behave, and then use the debugger to resolve whether those hypotheses are true. With each new piece of evidence, you will refine your hypotheses, until finally, you cannot help but stumble right into the bug.
Our first exercise introduces us to two of our core tools, the breakpoint and the step over button. In the left-hand Project view, right click (or two finger click) on the DebugExercise1 file and this time select the Debug option rather than the Run option. If the Debug option doesn’t appear, it’s because you didn’t properly import your lab2 project (see steps 1-10 of lab2setup).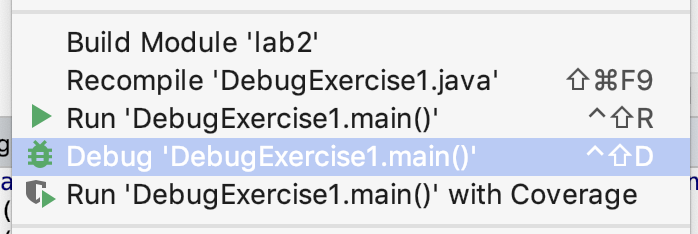
You’ll see that the program simply runs again, with no apparent difference! That’s because we haven’t give the debugger anything interesting to do. Let’s fix that by “setting a breakpoint”. To do so, scroll to the line that says int t3 = 3;, then click just to the right of the line number. You should see a red dot appear that vaguely resembles a stop sign, which means we have now set a breakpoint. If we run the program in debug mode again it’ll stop at that line. If you’d prefer to avoid right-clicking to run your program again, you can click the bug icon in the top right of the screen instead. An animated gif showing off the steps in this paragraph is available at this link.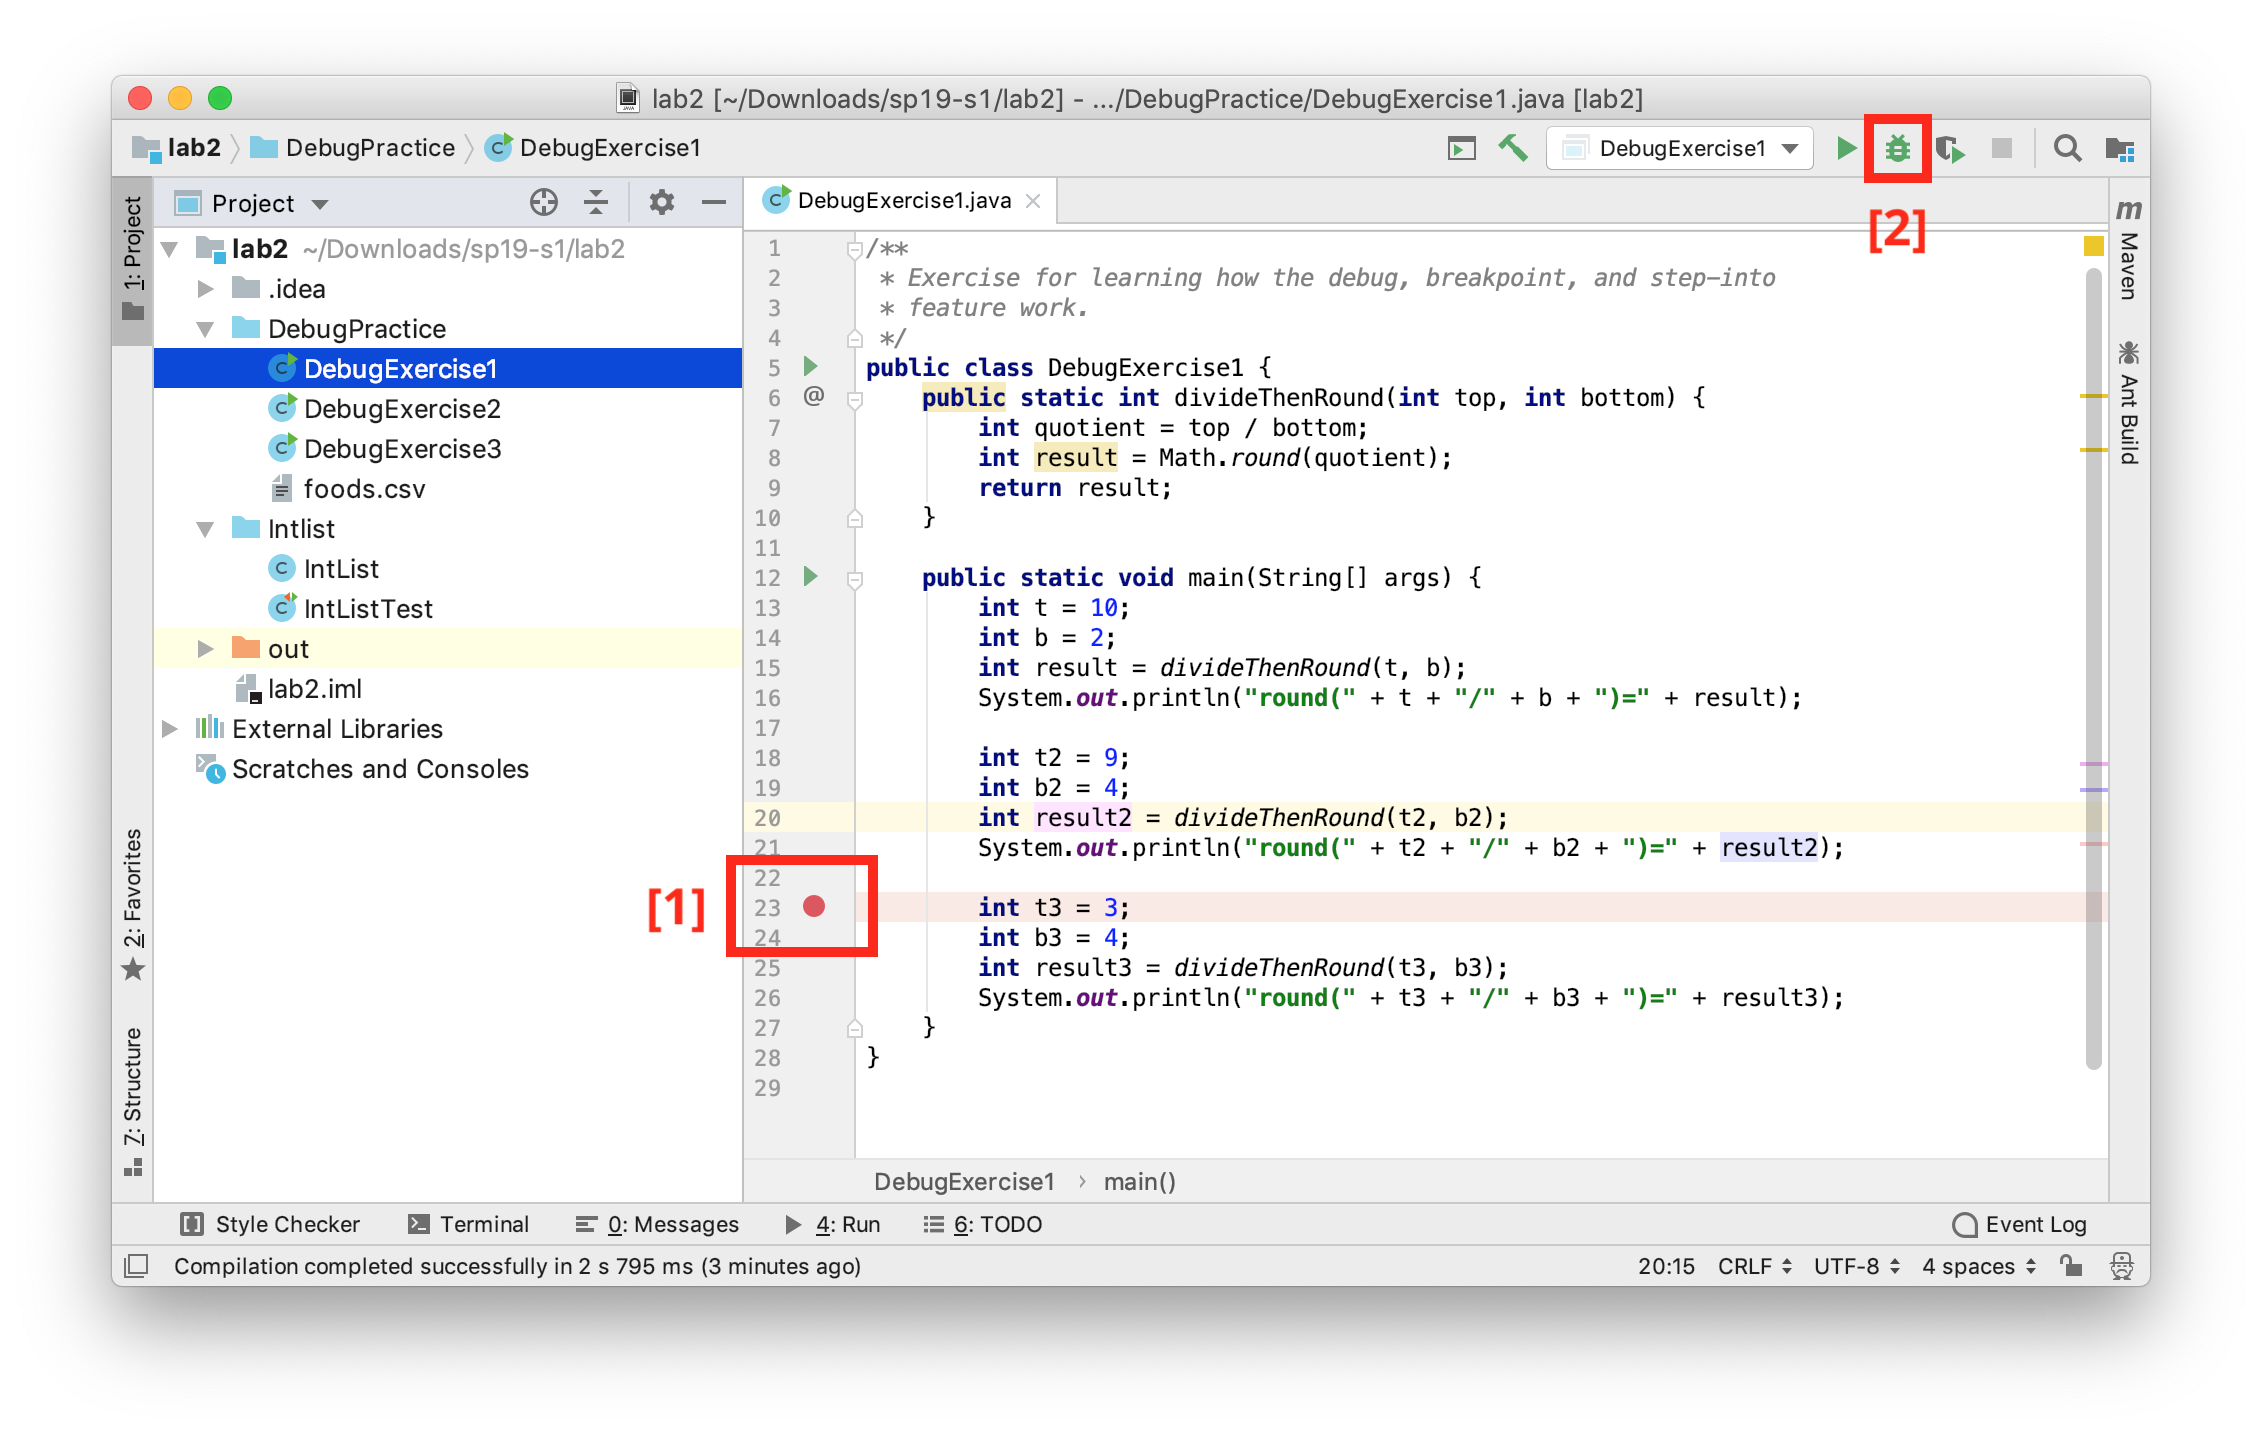
If the text console (that says things like “round(10/2)”) does not appear when you click the debug button, you may need to perform one additional step before proceeding. At the top left of the information window in the bottom panel, you should see tabs labeled “Debugger” and “Console” (and “Java Visualizer”). Click and drag the “Console” window to the far right of the bottom panel. This will allow you to show both the debugger and the console at the same time. An animated gif showing off this process is available at this link.
Once you’ve clicked the debug button (and made your console window visible if necessary), you should see that the program has paused at the line at which you set a breakpoint, and you should also see a list of all the variables at the bottom, including t, b, result, t2, b2, and result2. We can advance the program one step by clicking on the “step into” button, which is an arrow that points down as shown on the next line:
We’ll discuss the other buttons later in this lab. Make sure you’re pressing ‘step into’ rather than ‘step over’. Step-into points straight down, whereas step-over points up to the right and then down to the right.
Each time you click this button, the program will advance one step. Before you click each time, formulate a hypothesis about how the variables should change.
Note that the currently highlighted line is the line that is about to execute, not the line that has just executed.
Repeat this process until you find a line where the result does not match your expectations or the expectations of the person who wrote the code. Try and figure out why the line doesn’t do what you expect. If you miss the bug the first time, click the stop button (red square), and then the debug button to start back over. Optionally, you may fix the bug once you’ve found it.
Step Over and Step Out
Just as we rely on layering abstractions to construct and compose programs, we should also rely on abstraction to debug our programs. The “step over” button in IntelliJ makes this possible. Whereas the “step into” from the previous exercise shows the literal next step of the program, the “step over” button allows us to complete a function call without showing the function executing.
The main method in DebugExercise2 is supposed to take two arrays, compute the element-wise max of those two arrays, and then sum the resulting maxes. For example, suppose the two arrays are {2, 0, 10, 14} and {-5, 5, 20, 30}. The element-wise max is {2, 5, 20, 30}, e.g. in the second position, the larger of “0” and “5” is 5. The sum of this element-wise max is 2 + 5 + 20 + 30 = 57.
There are two different bugs in the provided code. Your job for this exercise is to fix the two bugs, with one special rule: You should NOT step into the max or add functions or even try to understand them. These are very strange functions that use syntax (and bad style) to do easy tasks in an incredibly obtuse way. If you find yourself accidentally stepping into one of these two functions, use the “step out” button (an upwards pointing arrow) to escape.
Even without stepping INTO these functions, you should be able to tell whether they have a bug or not. That’s the glory of abstraction! Even if I don’t know how a fish works at a molecular level, there are some cases where I can clearly tell that a fish is dead.
If you find that one of these functions has a bug, you should completely rewrite it rather than trying to fix it.
Now that we’ve told you what “step over” does, try exploring how it works exactly and try to find the two bugs. If you’re having the issue that the using run (or debug) button in the top right keeps running DebugExercise1, right click on DebugExercise2 to run it instead.
If you get stuck or just want more guidance, read the directions below.
Further Guidance (for those who want it)
To start, try running the program. The main method will compute and print an answer to the console. Try manually computing the answer, and you’ll see that the printed answer is incorrect. If you don’t know how to manually compute the answer, reread the description of what the function is supposed to do above, or read the comments in the provided code.
Next, set a breakpoint to the line in main that calls sumOfElementwiseMaxes. Then use the debug button, followed by the step-into function to reach the first line of sumOfElementWiseMaxes. Then use the “step over” button on the line that calls arrayMax. What is wrong with the output (if anything), i.e. how does it fail to match your expectations? Note that to see the contents of an array, you may need to click the rightward pointing triangle next to the variable name in the variables tab of the debugger window in the bottom panel.
If you feel that there is a bug, step into arrayMax (instead of over it) and try to find the bug. Reminder: do not step into max. You should be able to tell if max has a bug using step over. If max has a bug, replace it completely.
Repeat the same process with arraySum and add. Once you’ve fixed both bugs, double check that the sumOfElementwiseMaxes method works correctly for the provided inputs. Note: This is not proof that sumOfElementwiseMaxes is correct, but it’s not necessary to write any additional tests to help verify this fact (that will be coming next week).
Conditional Breakpoints and Resume
Sometimes it’s handy to be able to set a breakpoint and return to it over and over. In this final debugging exercise, we’ll see how to do this and why it is useful.
Try running DebugExercise3, which attempts to count the number of turnips available from all grocery stores nearby. It does this by reading in foods.csv, which provides information about foods available, where each line of the file corresponds to a single product available at a single store. Feel free to open the file to see what it looks like. Strangely, the number of turnips seems to be negative.
Set a breakpoint on the line where totalTurnips = newTotal occurs, and you’ll see that if you “step over”, the total number of turnips is incremented as you’d expect. One approach to debugging would be to keep clicking “step over” repeatedly until finally something goes wrong. However, this is too slow. One way we can speed things up is to click on the “resume” button (just down and to the left from the step-over button), which looks like a green triangle pointing to the right. Repeat this and you’ll see the turnip count incrementing repeatedly until something finally goes wrong.
An even faster approach is to make our breakpoint conditional. To do this, right (or two-finger) click on the red breakpoint dot. Here, you can set a condition for when you want to stop. In the condition box, enter “newTotal < 0”, stop your program, and try clicking “debug” again. You’ll see that you land right where you want to be.
See if you can figure out the problem (don’t worry about making any changes to the code; just identify the problem). If you can’t figure it out, talk to other people in your Discord or a TA or an academic intern.
Recap: Debugging
By this point you should understand the following tools:
- Breakpoints
- Stepping over
- Stepping into
- Stepping out (though you might not have actually used this feature for this lab)
- Conditional breakpoints
- Resuming
However, this is simply scratching the surface of the features of the debugger! Feel free to experiment. Did you see the “Watches” tab? Why not read into what that does? Or the “Evaluate Expression” button (one of the last buttons on the row of step into/over/out buttons – it looks like a calculator)? In Lab 3, we will give some more hands on experience with the debugger. Be sure to also check out our Debugging Guide!
Application: IntLists
Introduction/Review of IntLists
As discussed in Monday’s lecture, an IntList is our CS61B implementation for a naked recursive linked list of integers. Each IntList has a first and rest variable. The first is the int element contained by the node, and the rest is the next chain in the list (another IntList!).
In the IntList directory for this lab, we’ve provided a much larger IntList.java than the one we created in class. It has five important new static methods, two of which you’ll fill in:
void dSquareList(IntList L): modifies the list so that all of its elements are squared.IntList squareListIterative(IntList L): returns a version of the list with all elements squared, using iteration. The list is not modified.IntList squareListRecursive(IntList L): returns a version of the list with all elements squared, using recursion. The list is not modified.dcatenate(IntList A, IntList B): returns a list consisting of all elements of A, followed by all elements of B. May modify A. To be completed by you.catenate(IntList A, IntList B): returns a list consisting of all elements of A, followed by all elements of B. May not modify A. To be completed by you.
The class also includes additional methods that you are not supposed to read or understand. They are omitted from being described in this lab.
Destructive vs. Non-Destructive
For a given piece of desired functionality, there are often many ways to write the same function. For example, consider the task of squaring every item in a list of numbers. In the provided IntList java.
Let’s consider a method dSquareList that will “destructively” square every item in a list (similar to the extra problem from discussion in week 2.
IntList origL = IntList.of(1, 2, 3)
dSquareList(origL);
// origL is now (1, 4, 9)
By destructive, we mean that the original list changes. The term “mutative” is also sometimes used (as in discussion from week 2). By contrast a non-destructive method like squareListIterative does not affect the original list, e.g.
IntList origL = IntList.of(1, 2, 3)
IntList squaredList = squareListIterative(origL);
// origL is still (1, 2, 3)
// squaredList is (1, 4, 9)
dSquareList Implementation
Here is one possible implementation of dSquareList(), along with a call to dSquareList:
public static void dSquareList(IntList L) {
    while (L != null) {
        L.first = L.first * L.first;
        L = L.rest;
    }
}
IntList origL = IntList.of(1, 2, 3)
dSquareList(origL);
// origL is now (1, 4, 9)
The reason that dSquareList is destructive is because we change the values of the original input IntList. As we go along, we square each value, and the action of changing the internal data persists.
It is also important to observe that the bits in the origL box do not change, i.e. the variable still points to exactly the same object in memory when dSquareList completes.
To ensure that these ideas all make sense, set a breakpoint in dSquareList and run the IntListTest class in debug mode. Use the Java Visualizer (which you installed in lab2setup) to visualize the IntList as you step through with the debugger. The visualizer is an icon of a blue coffee cup with an eye, and is the tab next to the “Console” tab in the debugger panel). See the CS 61B plugin guide if you can’t figure out how to get the visualizer to show.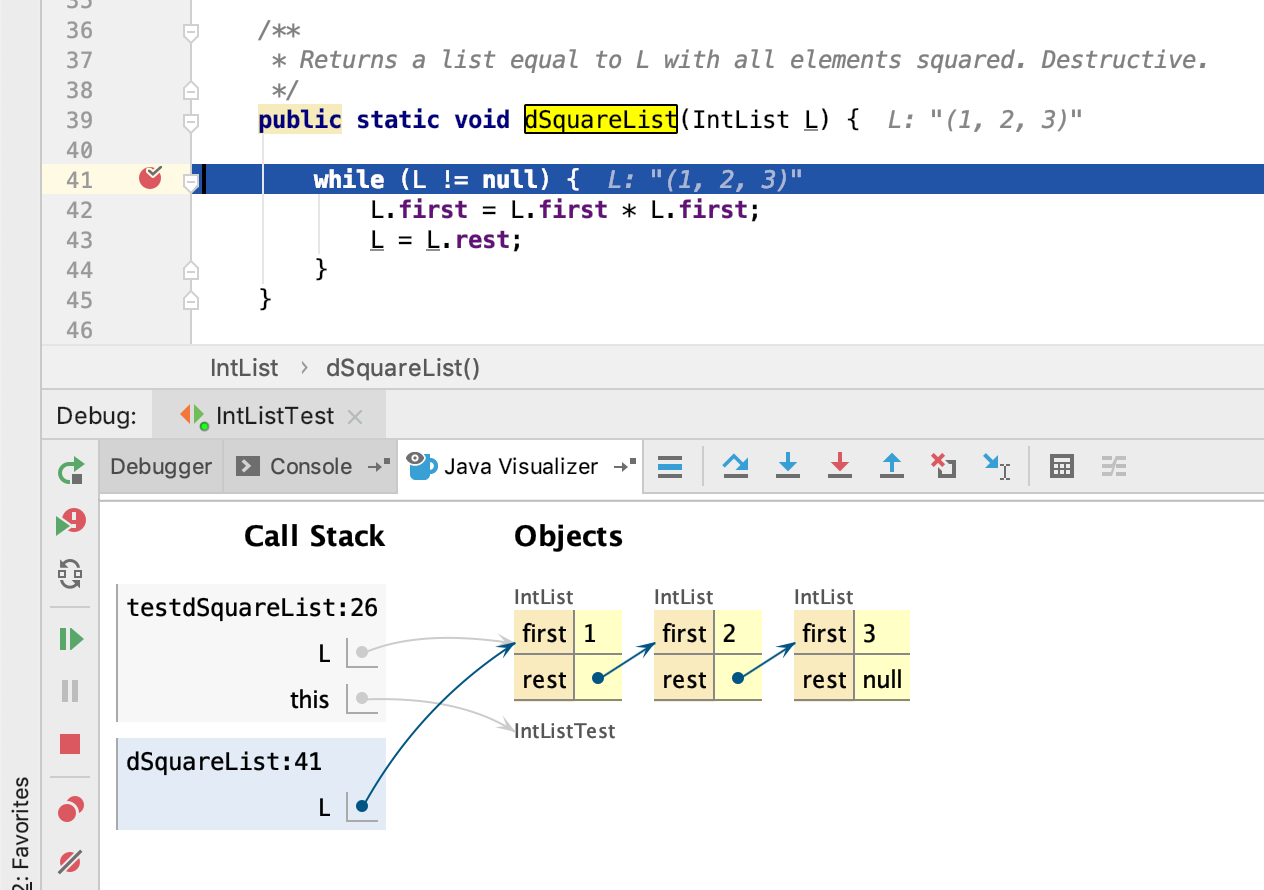
If you don’t understand how the dSquareList method works, ask a TA or academic intern for help. They are here to help you! Pointers and IntLists might seem confusing at first, but it’s important that you understand these concepts!
NOTE: The choice to return void rather than a pointer to L was an arbitrary decision. Different languages and libraries use different conventions (and people get quite grumpy about which is the “right” one).
Non-destructive Squaring
The provided squareListIterative() and squareListRecursive() methods are both non-destructive. That is, the underlying IntList passed into the methods does not get modified, and instead a fresh new copy is modified and returned.
Look at squareListIterative and squareListRecursive. Ideally, you should spend some time trying to really understand them, including possibly using the visualizer. However, if you don’t have time, this iterative version is much messier.
The iterative version of a non-destructive method is often (but not always) quite a bit messier than the recursive version, since it takes some careful pointer action to create a new IntList, build it up, and return it.
Test Code
Optionally, look at the test method testDSquareList in IntListTest.java. This gives you a feeling for how tests will be written in this course moving forwards, and we’ll be requiring you to write tests starting in next week’s lab. You might also find them handy when writing your project 1A next week.
One major difference that the tests rely upon is that we’ve added a method to our IntList class called of that makes it easier to create IntLists. For example, to create an IntList containing the numbers 0, 1, 2, and 3, we could use the method as follows:
IntList myList = IntList.of(0, 1, 2, 3);
// Creates the IntList 0 -> 1 -> 2 -> 3 -> null
myList.firstreturns 0myList.restreturns 1 -> 2 -> 3 -> nullmyList.rest.rest.restreturns 3 -> nullmyList.rest.rest.rest.restreturns null- Pop quiz: what happens for
myList.rest.rest.rest.rest.rest? (Hint: it doesn’t successfully return something)
Observe that the IntList.of() method makes it much easier to create IntLists compared to the brute force approach.
IntList myList = new IntList(0, null);
myList.rest = new IntList(1, null);
myList.rest.rest = new IntList(2, null);
myList.rest.rest.rest = new IntList(3, null);
// One line of using IntList.of() can do the job of four lines!
Implementing Destructive vs. Non-destructive Methods
To complete the lab, you should write methods dcatenate and catenate as described below. You may find the squaring methods from above to be useful as you write your code.
Both methods take in two IntLists, and concatenate them together. So catenate(IntList A, IntList B) and dcatenate(IntList A, IntList B) both result in an IntList which contains the elements of A followed by the elements of B.
The only difference between these two methods is that dcatenate modifies the original IntList A (i.e. it’s destructive) and catenate does not.
To complete the lab:
- Fill in one of
dcatenate()orcatenate(), and run them against our tests. Revise your code until it passes our tests. - Repeat for the method you haven’t yet completed. (We recommend you do one first and finish it before you start the next, because then you’ll be able to take advantage of the similar logic).
IntList problems can be tricky to think about, and there are always several approaches which can work. Don’t be afraid to pull out pen and paper or go to the whiteboard and work out some examples! If you get stuck, drawing out the pointers can probably stimulate you back onto the path of progress. And, as always, the debugger (and visualizer) is a great option!
Feel free to use either recursion or iteration. For extra practice, try both!
It’s also often useful to first think about base cases (when A is null, for example) - this works especially well for building up a recursive solution. In other words, write up a solution that would work for the base case, then stop and think about how to expand this solution into something that works for other bigger cases.
Complete and Submit Lab 2
To complete this lab, you will submit IntList.java (make sure it’s still within the Intlist folder). Follow the submission instructions at the bottom of Lab 1.
Full Recap
In this lab, we went over:
- Stepping into, over, and out inside the IntelliJ debugger (this will be handy for projects!)
- Non-destructive vs. destructive methods
- IntLists and pointers
- Writing
IntListmethods destructively, non-destructively, recursively, and iterativelyFAQ and Common Issues
Things like String or String.equals() are red!
This is a JDK issue, go to File > Project Structure > Project > Project SDK to troubleshoot. If your Java version is 14.0, then you should have a 14.0 SDK and a Level 14 “Project Language Level”.Things like @Test are red!
You forgot to import your libraries. You have to add your libraries every time you start a new project! See the lab2 setup instructions.Console button isn’t showing up!
That’s because you didn’t compile successfully. Usually, it’s because you did not add your libraries.Java files have a red circle, with a J inside the circle, next to the file icon
Did you make sure to import thelab2folder, rather than open thelab2folder? That’s usually the cause of this sort of problem.
If you imported correctly, however, try right-clicking the folder containing that Java file, and click Mark As → Sources Root.

若有收获,就点个赞吧
0 人点赞
