1、折线 zoom缩放 time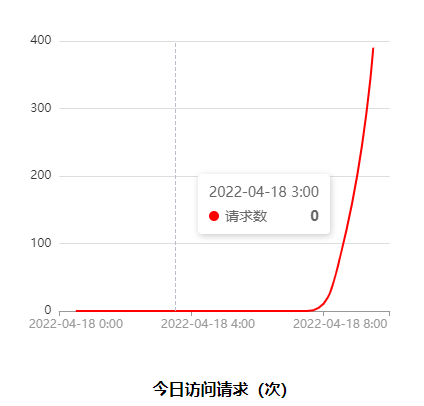
if (this.echartsLeftDome != null) {this.echartsLeftDome.dispose();}this.echartsLeftDome = this.$echarts.init(document.getElementById('echartsLeft'));todayget().then((res) => {// res.datalet title = [];let val = [];res.data.forEach((item) => {title.push(item[0]);val.push(item[1]);});let option = {tooltip: {trigger: 'axis',},xAxis: [{type: 'category',data: title,axisLine: {lineStyle: {color: '#999',},},}, ],yAxis: [{type: 'value',// splitNumber: 1,splitLine: {lineStyle: {color: '#DDD',},},axisLine: {show: false,lineStyle: {color: '#333',},},nameTextStyle: {color: '#999',},}, ],dataZoom: [{type: 'inside',show: false,start: 0,end: 100}, ],series: [{name: '请求数',type: 'line',data: val,color: 'red', // 100% 处的颜色lineStyle: {normal: {width: 2,},},symbol: 'none',smooth: true,}, ],};this.echartsLeftDome.setOption(option);});
2、折线 time zoom缩放 面积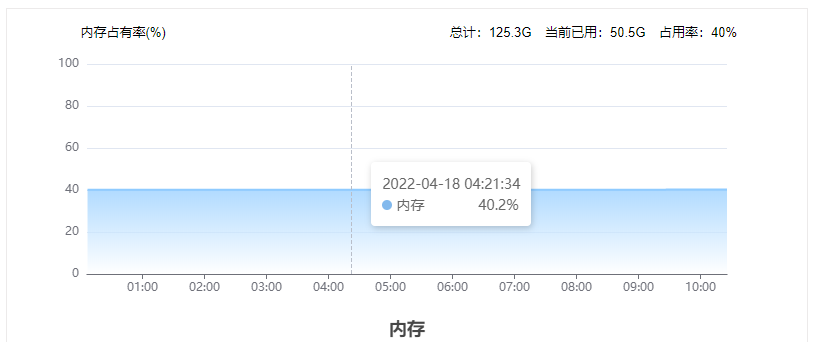
if (this.echartsLeftBottomDome != null) {this.echartsLeftBottomDome.dispose();}this.echartsLeftBottomDome = this.$echarts.init(document.getElementById('echartsLeftBottom'));let option = {tooltip: {trigger: "axis",formatter: function (parms) {var str =parms[0].data[0] +"</br>" +parms[0].marker +"内存" + '             ' +parms[0].data[1] + "%""</br>"return str;},},title: {top: "bottom",left: "center",text: "内存",},grid: [{top: '8%',}, ],xAxis: {type: "time",boundaryGap: false,axisLabel: {formatter: '{HH}:{mm}'}},yAxis: {type: "value",max: 100,},dataZoom: [{type: 'inside',show: false,start: 1,end: 100}, ],series: [{name: "内存",type: "line",smooth: true,symbol: "none",sampling: "average",itemStyle: {normal: {color: "#82B9ED",},},areaStyle: {normal: {color: this.$echarts.graphic.LinearGradient(0, 0, 0, 1, [{offset: 0,color: "#82B9ED",},{offset: 1,color: "#F8FBFE",},]),},},data: this.CpData,}, ],};this.echartsLeftBottomDome.setOption(option)

若有收获,就点个赞吧
0 人点赞
