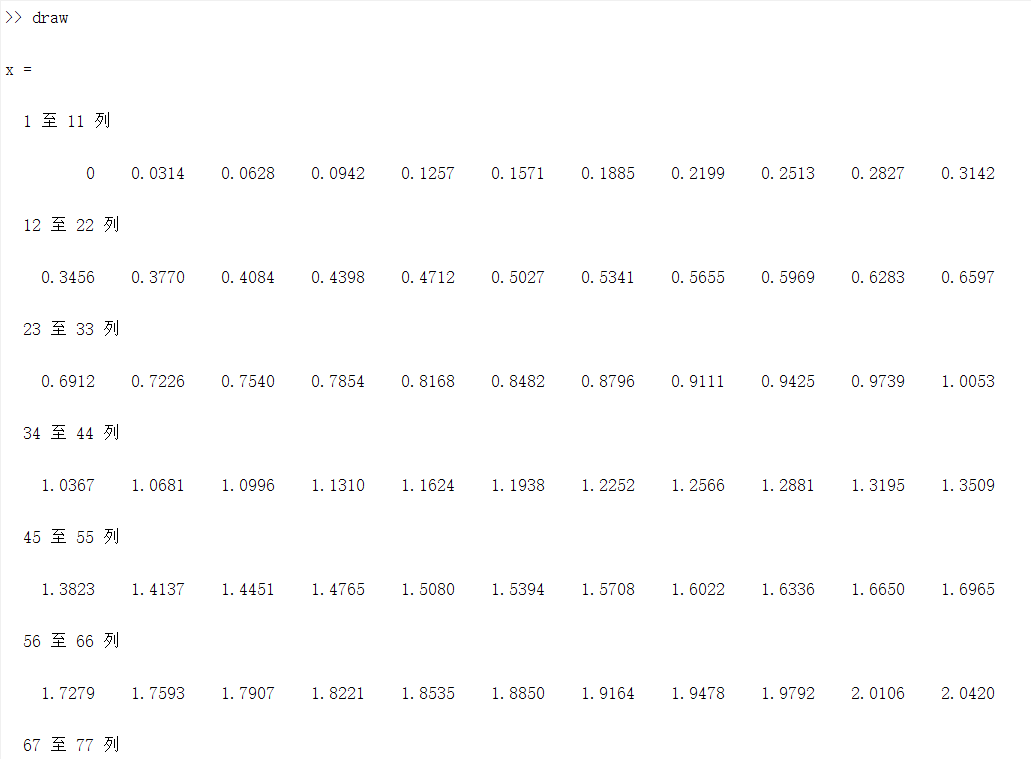
1.plot(描点画图)
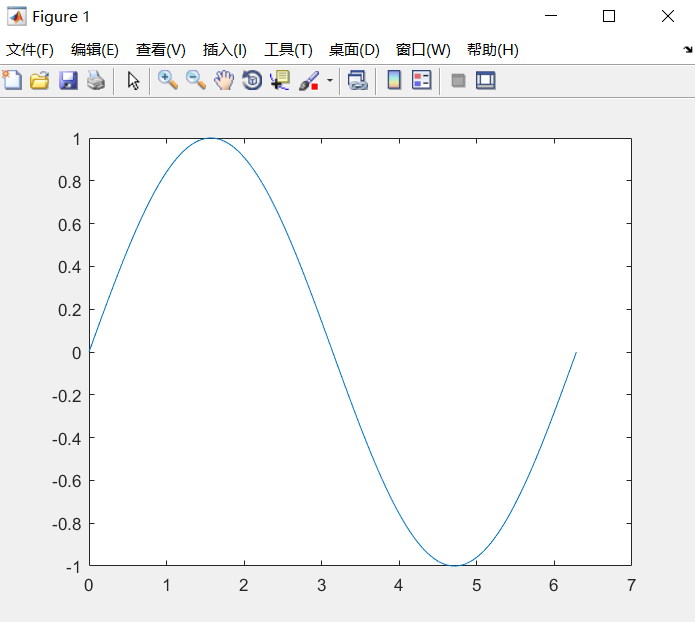
x = 0:pi/100:2*pi%x为一个公差为pi/100的等差数列y = sin(x)plot(x,y)%画出正弦图像
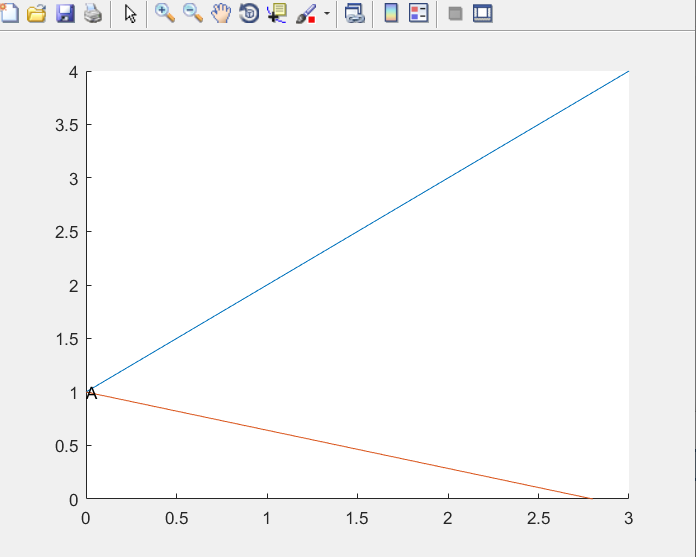
clear;clc;close all;hold on%两条线画在一张图上plot([0,3],[1,4]);plot([0,2.8],[1,0]);text(0,1,'A');%为图中标点
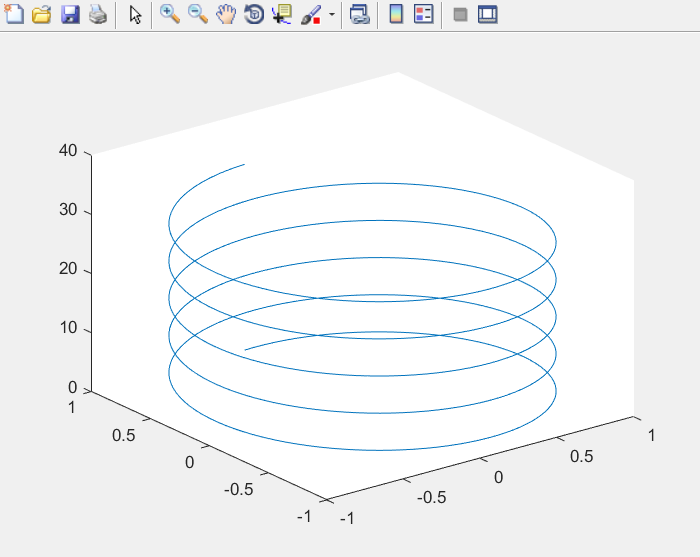
2.plot3
clear;clc;close all;t = 0:pi/50:10*pi;st = sin(t)ct = cos(t)figure;%控制窗口数量plot3(st,ct,t)
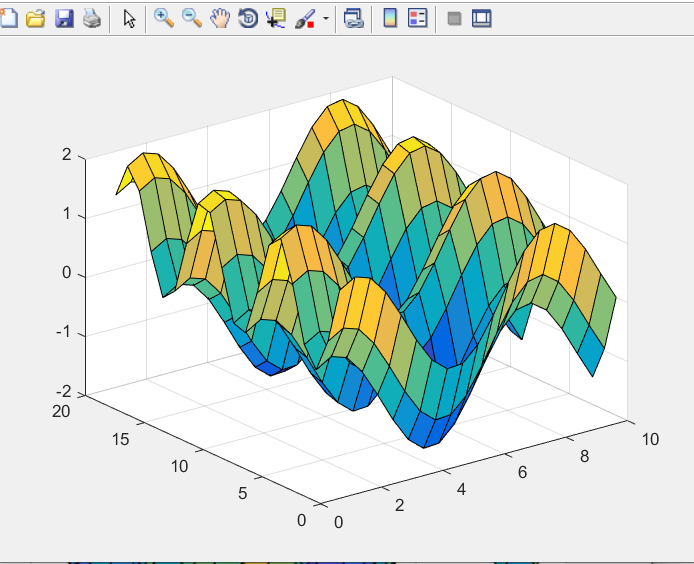
3.surf
%%clear;clc;close all;[X,Y] = meshgrid(1:0.5:10,1:20);%X,Y共同决定了范围内的网格点,x在1:0.5:10的范围内,y在1:20的范围内Z = sin(X)+cos(Y);surf(X,Y,Z)%画曲面
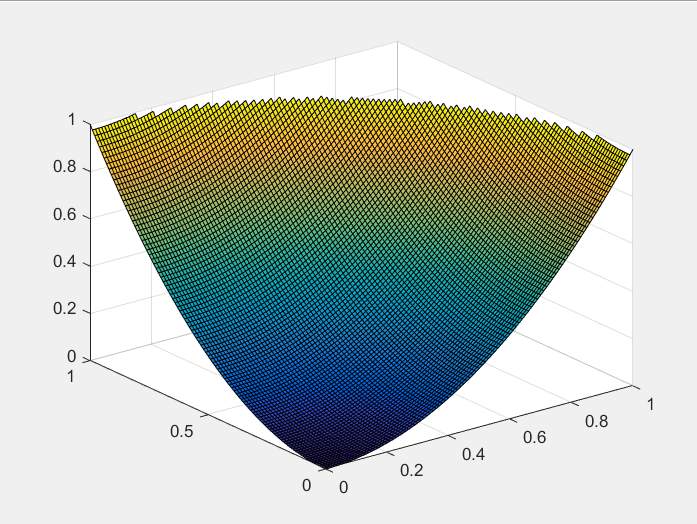
4.NaN的处理技巧
clear;clc;close all;x = 0:0.01:1;[X,Y] = meshgrid(x);Z = X.^2+Y.^2;Z(Z>1) = NaN;surf(X,Y,Z);
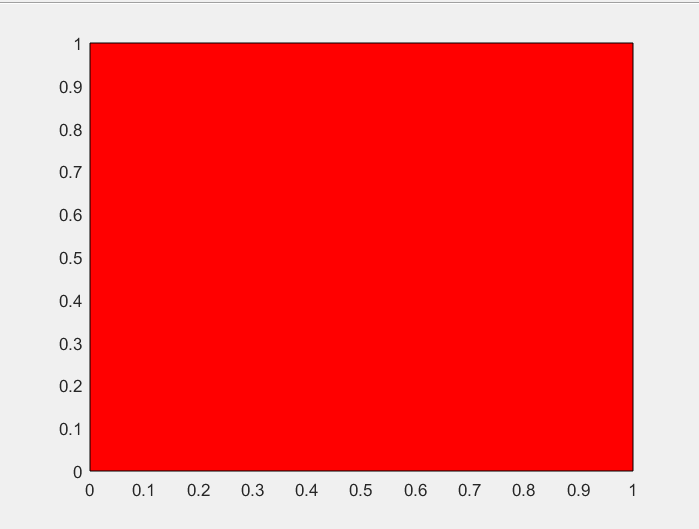
5.fill
%%clear;clc;close all;x = [0 1 1 0];y = [0 0 1 1];fill(x,y,'r')

若有收获,就点个赞吧
0 人点赞
