consul
cm-consul-config
{"acl": {"enabled": true,"default_policy": "deny","enable_token_persistence": true,"tokens": {"master": "XlPxO1ei7E4BjAen"}}}
cm-consul-services
{"services": [{"id": "腾讯云-重庆","name": "node_exporter","tags": ["prometheus"],"address": "129.28.176.131","port": 9745,"meta": {"group": "services","env": "prod"},"token": "XlPxO1ei7E4BjAen"},{"id": "阿里云-演示","name": "node_exporter","tags": ["prometheus"],"address": "8.130.25.139","port": 9100,"meta": {"group": "services","env": "prod"},"token": "XlPxO1ei7E4BjAen"},{"id": "阿里云-张家口-devops","name": "node_exporter","tags": ["prometheus"],"address": "39.100.198.227","port": 8253,"meta": {"group": "services","env": "prod"},"token": "XlPxO1ei7E4BjAen"}]}
deployment
kind: DeploymentapiVersion: apps/v1metadata:name: consulnamespace: monitorlabels:app: consulannotations:deployment.kubernetes.io/revision: '14'kubesphere.io/alias-name: ''kubesphere.io/creator: zhaoweispec:replicas: 1selector:matchLabels:app: consultemplate:metadata:creationTimestamp: nulllabels:app: consulannotations:kubesphere.io/restartedAt: '2022-02-07T06:38:59.797Z'logging.kubesphere.io/logsidecar-config: '{}'spec:volumes:- name: host-timehostPath:path: /etc/localtimetype: ''- name: volume-92fcfwconfigMap:name: cm-consul-configdefaultMode: 420- name: volume-escwevconfigMap:name: cm-consul-servicesdefaultMode: 420containers:- name: container-consulimage: consulports:- name: tcp-8500containerPort: 8500protocol: TCPresources: {}volumeMounts:- name: host-timereadOnly: truemountPath: /etc/localtime- name: volume-92fcfwreadOnly: truemountPath: /consul/config/acl.jsonsubPath: acl.json- name: volume-escwevreadOnly: truemountPath: /consul/config/services.jsonsubPath: services.jsonterminationMessagePath: /dev/termination-logterminationMessagePolicy: FileimagePullPolicy: IfNotPresentrestartPolicy: AlwaysterminationGracePeriodSeconds: 30dnsPolicy: ClusterFirstserviceAccountName: defaultserviceAccount: defaultsecurityContext: {}affinity: {}schedulerName: default-schedulerstrategy:type: RollingUpdaterollingUpdate:maxUnavailable: 25%maxSurge: 25%revisionHistoryLimit: 10progressDeadlineSeconds: 600
prometheus
cm-prometheus
对象采集改为为 consul 服务发现
# my global configglobal:scrape_interval: 15s # Set the scrape interval to every 15 seconds. Default is every 1 minute.evaluation_interval: 15s # Evaluate rules every 15 seconds. The default is every 1 minute.# scrape_timeout is set to the global default (10s).# Alertmanager configurationalerting:alertmanagers:- static_configs:- targets: ['svc-alertmanager.monitor:9093']basic_auth:username: prometheuspassword: XlPxO1ei7E4BjAen# Load rules once and periodically evaluate them according to the global 'evaluation_interval'.rule_files:- /etc/prometheus/rules/*.yml# A scrape configuration containing exactly one endpoint to scrape:# 这里表示抓取对象的配置# Here it's Prometheus itself.# 这里是抓取promethues自身的配置scrape_configs:# The job name is added as a label `job=<job_name>` to any timeseries scraped from this config.# 这个配置是表示在这个配置内的时间序例,每一条都会自动添加上这个{job_name:"prometheus"}的标签。# - job_name: "腾讯云-重庆"# scrape_interval: 15s# static_configs:# - targets: ["129.28.176.131:9745"]# basic_auth:# username: prometheus# password: XlPxO1ei7E4BjAen# - job_name: "阿里云-演示"# scrape_interval: 15s# static_configs:# - targets: ["8.130.25.139:9100"]# basic_auth:# username: prometheus# password: XlPxO1ei7E4BjAen# - job_name: "阿里云-张家口-devops"# scrape_interval: 15s# static_configs:# - targets: ["39.100.198.227:8253"]# basic_auth:# username: prometheus# password: XlPxO1ei7E4BjAen- job_name: 'osvlab服务器'consul_sd_configs:- server: 'svc-consul.monitor:8500'token: 'XlPxO1ei7E4BjAen'services: ['node_exporter']relabel_configs:- regex: __meta_consul_service_metadata_(.+)action: labelmap- regex: __meta_consul_(service_id)action: labelmap- source_labels:- "__meta_consul_service_id"regex: "(.*)"target_label: "nodename"action: replacereplacement: "$1"basic_auth:username: prometheuspassword: XlPxO1ei7E4BjAen
cm-prometheus-rules
包含了几个规则
kind: ConfigMapapiVersion: v1metadata:name: cm-prometheus-rulesnamespace: monitorannotations:kubesphere.io/creator: mafeidata:cpu_over.yml: |groups:- name: CPU报警规则rules:- alert: CPU使用率告警 # 警告名# 触发规则expr: 100 - (avg by(instance) (irate(node_cpu_seconds_total{mode="idle", service_id!="阿里云-张家口-devops"}[1m]))) * 100 > 80# 规则触发持续多长时间发送告警for: 30m# 告警附加标签labels:severity: warning# 告警附加注释annotations:summary: "CPU使用率正在飙升。"description: "CPU使用率超过80%(当前值:{{ humanize $value }}%)"cpu_over_aliyun-zhangjiakou-devops.yml: |groups:- name: CPU报警规则rules:- alert: CPU使用率告警 # 警告名# 触发规则expr: 100 - (avg by(instance) (irate(node_cpu_seconds_total{mode="idle", service_id="阿里云-张家口-devops"}[1m]))) * 100 > 90# 规则触发持续多长时间发送告警for: 30m# 告警附加标签labels:severity: warning# 告警附加注释annotations:summary: "CPU使用率正在飙升。"description: "CPU使用率超过90%(当前值:{{ humanize $value }}%)"disk_over.yml: |groups:- name: 磁盘使用率报警规则rules:- alert: 磁盘使用率告警expr: 100 - node_filesystem_free_bytes{fstype=~"xfs|ext4"} / node_filesystem_size_bytes{fstype=~"xfs|ext4"} * 100 > 80# 规则触发持续多长时间发送告警for: 30mlabels:severity: warningannotations:summary: "硬盘分区使用率过高"description: "分区使用大于80%(当前值:{{ humanize $value }}%)"memory_over.yml: |groups:- name: 内存报警规则rules:- alert: 内存使用率告警expr: (1 - (node_memory_MemAvailable_bytes{service_id!="阿里云-张家口-devops"} / (node_memory_MemTotal_bytes{service_id!="阿里云-张家口-devops"}))) * 100 > 80for: 30mlabels:severity: warningannotations:summary: "服务器可用内存不足。"description: "内存使用率已超过80%(当前值:{{ humanize $value }}%)"memory_over_aliyun-zhangjiakou-devops.yml: |groups:- name: 内存报警规则rules:- alert: 内存使用率告警expr: (1 - (node_memory_MemAvailable_bytes{service_id="阿里云-张家口-devops"} / (node_memory_MemTotal_bytes{service_id="阿里云-张家口-devops"}))) * 100 > 90for: 30mlabels:severity: warningannotations:summary: "服务器可用内存不足。"description: "内存使用率已超过90%(当前值:{{ humanize $value }}%)"node_alived.yml: |groups:- name: 实例存活告警规则rules:- alert: 实例存活告警expr: up == 0for: 1mlabels:user: prometheusseverity: criticalannotations:summary: "主机宕机 !!!"description: "该实例主机已经宕机超过一分钟了。"
deployment
kind: DeploymentapiVersion: apps/v1metadata:name: prometheusnamespace: monitorlabels:app: prometheusannotations:deployment.kubernetes.io/revision: '13'kubesphere.io/creator: mafeispec:replicas: 1selector:matchLabels:app: prometheustemplate:metadata:creationTimestamp: nulllabels:app: prometheusannotations:kubesphere.io/restartedAt: '2022-02-07T06:41:00.436Z'logging.kubesphere.io/logsidecar-config: '{}'spec:volumes:- name: host-timehostPath:path: /etc/localtimetype: ''- name: volume-main-configconfigMap:name: cm-prometheusdefaultMode: 420- name: volume-rulesconfigMap:name: cm-prometheus-rulesdefaultMode: 420- name: volume-datapersistentVolumeClaim:claimName: pvc-prometheus- name: volume-web-configconfigMap:name: cm-prometheus-web-configdefaultMode: 420containers:- name: container-2mxqguimage: 'prom/prometheus:v2.32.0-rc.1'command:- /bin/prometheusargs:- '--config.file=/etc/prometheus/prometheus.yml'- '--web.config.file=/etc/prometheus/web-config.yml'- '--web.external-url=http://shinetechzz.tpddns.cn:32177/'- '--web.enable-lifecycle'- '--storage.tsdb.retention.time=7d'- '--storage.tsdb.retention.size=10GB'ports:- name: tcp-9090containerPort: 9090protocol: TCPresources: {}volumeMounts:- name: host-timereadOnly: truemountPath: /etc/localtime- name: volume-main-configreadOnly: truemountPath: /etc/prometheus/prometheus.ymlsubPath: prometheus.yml- name: volume-rulesreadOnly: truemountPath: /etc/prometheus/rules- name: volume-datamountPath: /data- name: volume-web-configreadOnly: truemountPath: /etc/prometheus/web-config.ymlsubPath: web-config.ymlterminationMessagePath: /dev/termination-logterminationMessagePolicy: FileimagePullPolicy: IfNotPresentrestartPolicy: AlwaysterminationGracePeriodSeconds: 30dnsPolicy: ClusterFirstserviceAccountName: defaultserviceAccount: defaultsecurityContext: {}affinity: {}schedulerName: default-schedulerstrategy:type: RollingUpdaterollingUpdate:maxUnavailable: 25%maxSurge: 25%revisionHistoryLimit: 10progressDeadlineSeconds: 600
cm-prometheus-web-config
kind: ConfigMapapiVersion: v1metadata:name: cm-prometheus-web-confignamespace: monitorannotations:kubesphere.io/creator: mafeidata:cm-prometheus-web-config: ''web-config.yml: |-basic_auth_users:prometheus: $2y$10$Os6PjwgYFiKspBMPw5uRXu2zagy96E.dFqhZywaUphuNSEjzfN742
alertmanger
kind: ConfigMapapiVersion: v1metadata:name: cm-alertmangernamespace: monitorannotations:kubesphere.io/creator: mafeidata:alertmanager.yml: |-global:# 每一分钟检查一次是否恢复resolve_timeout: 1msmtp_from: 'mafei7@126.com'# The default hostname to identify to the SMTP server.smtp_hello: '126.com'smtp_smarthost: 'smtp.126.com:465'smtp_auth_username: 'mafei7@126.com'smtp_auth_password: 'RNPEBMEVLKMEAJUW'smtp_require_tls: false# 所有报警信息进入后的根路由,用来设置报警的分发策略route:# 进来的报警信息会带有标签,指定根据哪些标签进行分组group_by: [alertname]# 组告警等待时间。也就是告警产生后等待30s,如果有同组告警一起发出group_wait: 30s# 两组告警的间隔时间group_interval: 3m# 重复告警的间隔时间,减少相同告警的发送频率repeat_interval: 3h#设置默认接收人receiver: 'webhook'# 子路由, 用来覆盖配置routes:- receiver: webhookcontinue: truegroup_wait: 30sgroup_interval: 3mrepeat_interval: 3h- receiver: emailcontinue: truegroup_wait: 30sgroup_interval: 3mrepeat_interval: 3hmatchers:- severity = criticalreceivers:- name: 'webhook'webhook_configs:- url: http://svc-prometheus-alert.monitor:8080/prometheusalert?type=dd&tpl=prometheus-dd#警报被解决之后是否通知send_resolved: true- name: 'email'email_configs:- to: 'mafeifan@qq.com, maf@shinetechsoftware.com, zhaowe1@shinetechsoftware.com'send_resolved: true
kind: DeploymentapiVersion: apps/v1metadata:name: alertmanagernamespace: monitorlabels:app: alertmanagerannotations:deployment.kubernetes.io/revision: '6'kubesphere.io/creator: mafeispec:replicas: 1selector:matchLabels:app: alertmanagertemplate:metadata:creationTimestamp: nulllabels:app: alertmanagerannotations:kubesphere.io/restartedAt: '2022-02-07T06:42:18.778Z'logging.kubesphere.io/logsidecar-config: '{}'spec:volumes:- name: host-timehostPath:path: /etc/localtimetype: ''- name: volume-configconfigMap:name: cm-alertmangerdefaultMode: 420- name: volume-web-configconfigMap:name: cm-prometheus-web-configdefaultMode: 420containers:- name: container-alertmanagerimage: 'prom/alertmanager:v0.23.0'command:- /bin/alertmanagerargs:- '--config.file=/etc/alertmanager/alertmanager.yml'- '--web.config.file=/etc/alertmanager/web-config.yml'- '--web.external-url=http://shinetechzz.tpddns.cn:32178/'- '--storage.path=/alertmanager'ports:- name: tcp-9093containerPort: 9093protocol: TCPresources: {}volumeMounts:- name: host-timereadOnly: truemountPath: /etc/localtime- name: volume-configreadOnly: truemountPath: /etc/alertmanager/alertmanager.ymlsubPath: alertmanager.yml- name: volume-web-configreadOnly: truemountPath: /etc/alertmanager/web-config.ymlsubPath: web-config.ymlterminationMessagePath: /dev/termination-logterminationMessagePolicy: FileimagePullPolicy: IfNotPresentrestartPolicy: AlwaysterminationGracePeriodSeconds: 30dnsPolicy: ClusterFirstserviceAccountName: defaultserviceAccount: defaultsecurityContext: {}affinity: {}schedulerName: default-schedulerstrategy:type: RollingUpdaterollingUpdate:maxUnavailable: 25%maxSurge: 25%revisionHistoryLimit: 10progressDeadlineSeconds: 600
prometheus-alert
自带界面,可以配置钉钉模板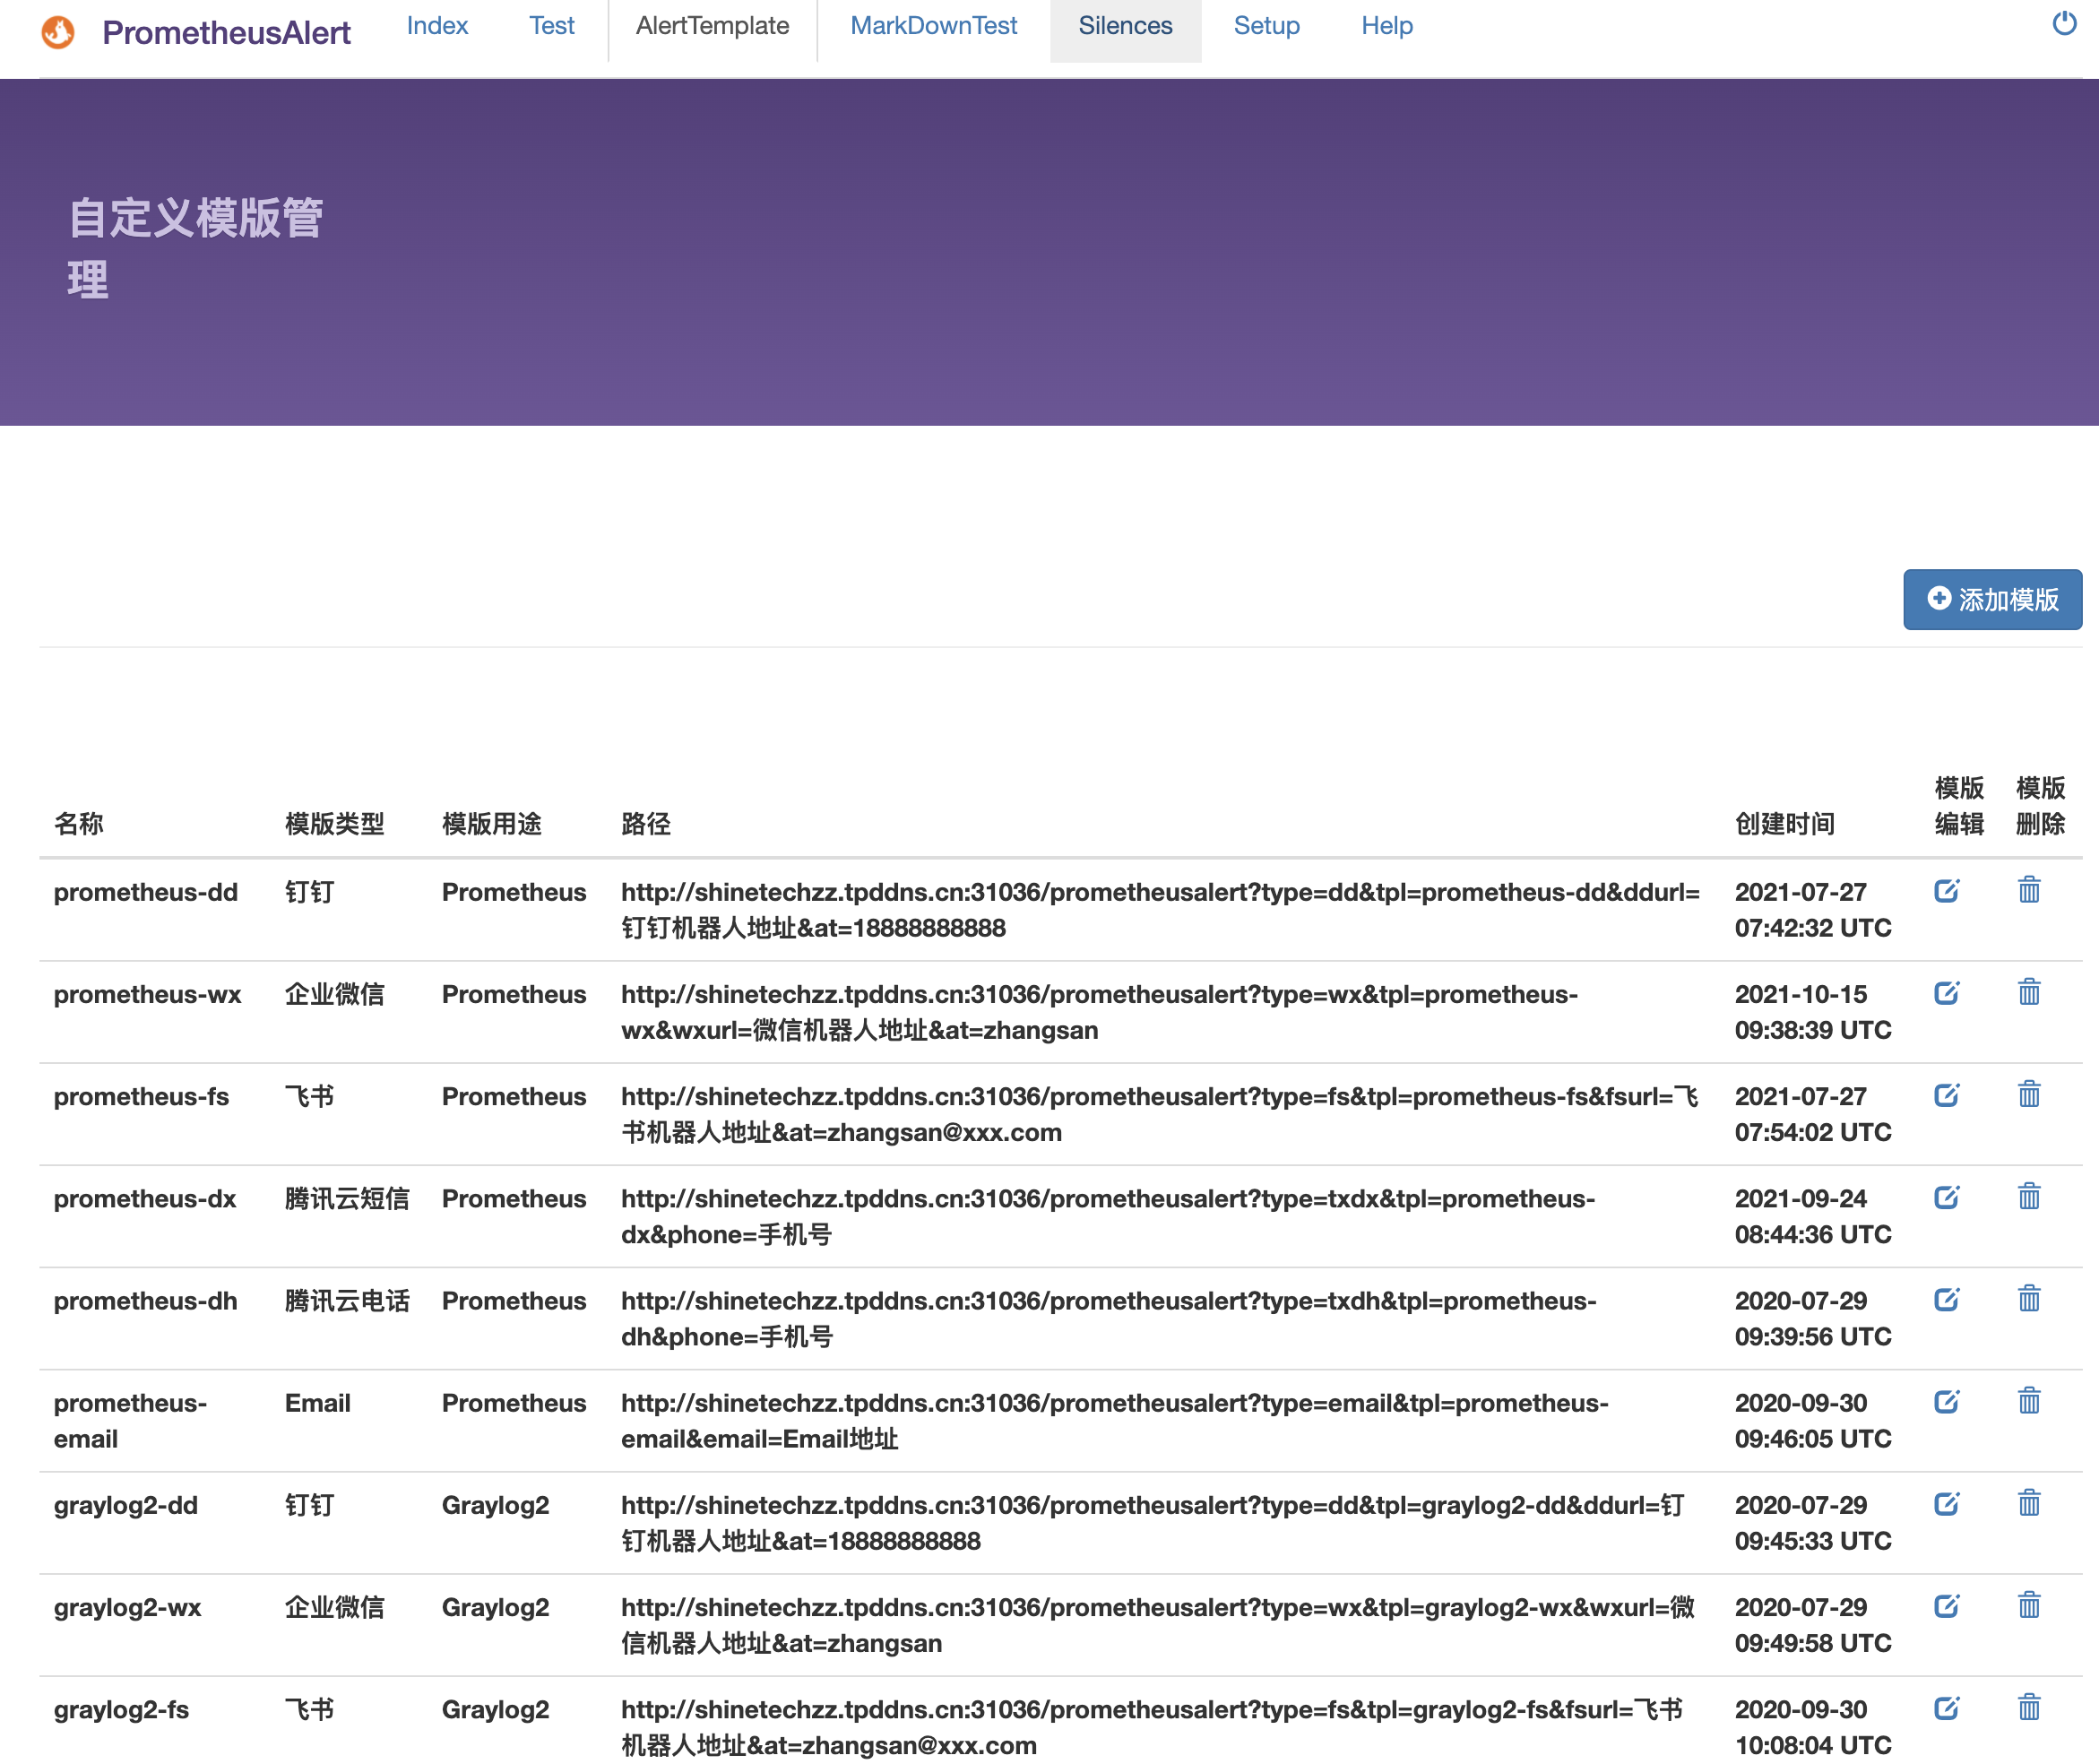
kind: DeploymentapiVersion: apps/v1metadata:name: prometheus-alertnamespace: monitorlabels:app: prometheus-alertannotations:deployment.kubernetes.io/revision: '2'kubesphere.io/creator: zhaoweispec:replicas: 1selector:matchLabels:app: prometheus-alerttemplate:metadata:creationTimestamp: nulllabels:app: prometheus-alertannotations:logging.kubesphere.io/logsidecar-config: '{}'spec:volumes:- name: host-timehostPath:path: /etc/localtimetype: ''- name: volume-5t19zfconfigMap:name: cm-prometheus-alertdefaultMode: 420containers:- name: prometheus-alertimage: feiyu563/prometheus-alertports:- name: http-8080containerPort: 8080protocol: TCPresources: {}volumeMounts:- name: host-timereadOnly: truemountPath: /etc/localtime- name: volume-5t19zfreadOnly: truemountPath: /app/conf/app.confsubPath: app.confterminationMessagePath: /dev/termination-logterminationMessagePolicy: FileimagePullPolicy: IfNotPresentrestartPolicy: AlwaysterminationGracePeriodSeconds: 30dnsPolicy: ClusterFirstserviceAccountName: defaultserviceAccount: defaultsecurityContext: {}affinity: {}schedulerName: default-schedulerstrategy:type: RollingUpdaterollingUpdate:maxUnavailable: 25%maxSurge: 25%revisionHistoryLimit: 10progressDeadlineSeconds: 600
cm-prometheus-alert
kind: ConfigMapapiVersion: v1metadata:name: cm-prometheus-alertnamespace: monitorannotations:kubesphere.io/creator: zhaoweidata:app.conf: >-#---------------------↓全局配置-----------------------appname = PrometheusAlert#登录用户名login_user=prometheus#登录密码login_password=XlPxO1ei7E4BjAen#监听地址httpaddr = "0.0.0.0"#监听端口httpport = 8080runmode = dev#设置代理 proxy = http://123.123.123.123:8080proxy =#开启JSON请求copyrequestbody = true#告警消息标题title=Prometheus#链接到告警平台地址GraylogAlerturl=http://graylog.org#钉钉告警 告警logo图标地址logourl=https://raw.githubusercontent.com/feiyu563/PrometheusAlert/master/doc/alert-center.png#钉钉告警 恢复logo图标地址rlogourl=https://raw.githubusercontent.com/feiyu563/PrometheusAlert/master/doc/alert-center.png#短信告警级别(等于3就进行短信告警) 告警级别定义 0 信息,1 警告,2 一般严重,3 严重,4 灾难messagelevel=3#电话告警级别(等于4就进行语音告警) 告警级别定义 0 信息,1 警告,2 一般严重,3 严重,4 灾难phonecalllevel=4#默认拨打号码(页面测试短信和电话功能需要配置此项)defaultphone=xxxxxxxx#故障恢复是否启用电话通知0为关闭,1为开启phonecallresolved=0#自动告警抑制(自动告警抑制是默认同一个告警源的告警信息只发送告警级别最高的第一条告警信息,其他消息默认屏蔽,这么做的目的是为了减少相同告警来源的消息数量,防止告警炸弹,0为关闭,1为开启)silent=0#是否前台输出file or consolelogtype=file#日志文件路径logpath=logs/prometheusalertcenter.log#转换Prometheus,graylog告警消息的时区为CST时区(如默认已经是CST时区,请勿开启)prometheus_cst_time=0#数据库驱动,支持sqlite3,mysql,postgres如使用mysql或postgres,请开启db_host,db_port,db_user,db_password,db_name的注释db_driver=sqlite3#db_host=127.0.0.1#db_port=3306#db_user=root#db_password=root#db_name=prometheusalert#是否开启告警记录 0为关闭,1为开启AlertRecord=0#---------------------↓webhook-----------------------#是否开启钉钉告警通道,可同时开始多个通道0为关闭,1为开启open-dingding=1#默认钉钉机器人地址ddurl=https://oapi.dingtalk.com/robot/send?access_token=1c3bfef63f32e4ee6a4e38f2f3ad8c321af108b0b4fe4efcef8c8498a0689cf3#是否开启 @所有人(0为关闭,1为开启)dd_isatall=1#是否开启微信告警通道,可同时开始多个通道0为关闭,1为开启open-weixin=0#默认企业微信机器人地址wxurl=https://qyapi.weixin.qq.com/cgi-bin/webhook/send?key=xxxxx#是否开启飞书告警通道,可同时开始多个通道0为关闭,1为开启open-feishu=0#默认飞书机器人地址fsurl=https://open.feishu.cn/open-apis/bot/hook/xxxxxxxxx#---------------------↓腾讯云接口-----------------------#是否开启腾讯云短信告警通道,可同时开始多个通道0为关闭,1为开启open-txdx=0#腾讯云短信接口keyTXY_DX_appkey=xxxxx#腾讯云短信模版ID 腾讯云短信模版配置可参考 prometheus告警:{1}TXY_DX_tpl_id=xxxxx#腾讯云短信sdk app idTXY_DX_sdkappid=xxxxx#腾讯云短信签名 根据自己审核通过的签名来填写TXY_DX_sign=腾讯云#是否开启腾讯云电话告警通道,可同时开始多个通道0为关闭,1为开启open-txdh=0#腾讯云电话接口keyTXY_DH_phonecallappkey=xxxxx#腾讯云电话模版IDTXY_DH_phonecalltpl_id=xxxxx#腾讯云电话sdk app idTXY_DH_phonecallsdkappid=xxxxx#---------------------↓华为云接口-----------------------#是否开启华为云短信告警通道,可同时开始多个通道0为关闭,1为开启open-hwdx=0#华为云短信接口keyHWY_DX_APP_Key=xxxxxxxxxxxxxxxxxxxxxx#华为云短信接口SecretHWY_DX_APP_Secret=xxxxxxxxxxxxxxxxxxxxxx#华为云APP接入地址(端口接口地址)HWY_DX_APP_Url=https://rtcsms.cn-north-1.myhuaweicloud.com:10743#华为云短信模板IDHWY_DX_Templateid=xxxxxxxxxxxxxxxxxxxxxx#华为云签名名称,必须是已审核通过的,与模板类型一致的签名名称,按照自己的实际签名填写HWY_DX_Signature=华为云#华为云签名通道号HWY_DX_Sender=xxxxxxxxxx#---------------------↓阿里云接口-----------------------#是否开启阿里云短信告警通道,可同时开始多个通道0为关闭,1为开启open-alydx=0#阿里云短信主账号AccessKey的IDALY_DX_AccessKeyId=xxxxxxxxxxxxxxxxxxxxxx#阿里云短信接口密钥ALY_DX_AccessSecret=xxxxxxxxxxxxxxxxxxxxxx#阿里云短信签名名称ALY_DX_SignName=阿里云#阿里云短信模板IDALY_DX_Template=xxxxxxxxxxxxxxxxxxxxxx#是否开启阿里云电话告警通道,可同时开始多个通道0为关闭,1为开启open-alydh=0#阿里云电话主账号AccessKey的IDALY_DH_AccessKeyId=xxxxxxxxxxxxxxxxxxxxxx#阿里云电话接口密钥ALY_DH_AccessSecret=xxxxxxxxxxxxxxxxxxxxxx#阿里云电话被叫显号,必须是已购买的号码ALY_DX_CalledShowNumber=xxxxxxxxx#阿里云电话文本转语音(TTS)模板IDALY_DH_TtsCode=xxxxxxxx#---------------------↓容联云接口-----------------------#是否开启容联云电话告警通道,可同时开始多个通道0为关闭,1为开启RLY_DH_open-rlydh=0#容联云基础接口地址RLY_URL=https://app.cloopen.com:8883/2013-12-26/Accounts/#容联云后台SIDRLY_ACCOUNT_SID=xxxxxxxxxxx#容联云api-tokenRLY_ACCOUNT_TOKEN=xxxxxxxxxx#容联云app_idRLY_APP_ID=xxxxxxxxxxxxx#---------------------↓邮件配置-----------------------#是否开启邮件open-email=0#邮件发件服务器地址Email_host=smtp.qq.com#邮件发件服务器端口Email_port=465#邮件帐号Email_user=xxxxxxx@qq.com#邮件密码Email_password=xxxxxx#邮件标题Email_title=运维告警#默认发送邮箱Default_emails=xxxxx@qq.com,xxxxx@qq.com#---------------------↓七陌云接口-----------------------#是否开启七陌短信告警通道,可同时开始多个通道0为关闭,1为开启open-7moordx=0#七陌账户ID7MOOR_ACCOUNT_ID=Nxxx#七陌账户APISecret7MOOR_ACCOUNT_APISECRET=xxx#七陌账户短信模板编号7MOOR_DX_TEMPLATENUM=n#注意:七陌短信变量这里只用一个var1,在代码里写死了。#-----------#是否开启七陌webcall语音通知告警通道,可同时开始多个通道0为关闭,1为开启open-7moordh=0#请在七陌平台添加虚拟服务号、文本节点#七陌账户webcall的虚拟服务号7MOOR_WEBCALL_SERVICENO=xxx# 文本节点里被替换的变量,我配置的是text。如果被替换的变量不是text,请修改此配置7MOOR_WEBCALL_VOICE_VAR=text#---------------------↓telegram接口-----------------------#是否开启telegram告警通道,可同时开始多个通道0为关闭,1为开启open-tg=0#tg机器人tokenTG_TOKEN=xxxxx#tg消息模式 个人消息或者频道消息 0为关闭(推送给个人),1为开启(推送给频道)TG_MODE_CHAN=0#tg用户IDTG_USERID=xxxxx#tg频道name或者id, 频道name需要以@开始TG_CHANNAME=xxxxx#tg api地址, 可以配置为代理地址#TG_API_PROXY="https://api.telegram.org/bot%s/%s"#---------------------↓workwechat接口-----------------------#是否开启workwechat告警通道,可同时开始多个通道0为关闭,1为开启open-workwechat=0# 企业IDWorkWechat_CropID=xxxxx# 应用IDWorkWechat_AgentID=xxxx# 应用secretWorkWechat_AgentSecret=xxxx# 接受用户WorkWechat_ToUser="zhangsan|lisi"# 接受部门WorkWechat_ToParty="ops|dev"# 接受标签WorkWechat_ToTag=""# 消息类型, 暂时只支持markdown# WorkWechat_Msgtype = "markdown"#---------------------↓百度云接口-----------------------#是否开启百度云短信告警通道,可同时开始多个通道0为关闭,1为开启open-baidudx=0#百度云短信接口AK(ACCESS_KEY_ID)BDY_DX_AK=xxxxx#百度云短信接口SK(SECRET_ACCESS_KEY)BDY_DX_SK=xxxxx#百度云短信ENDPOINT(ENDPOINT参数需要用指定区域的域名来进行定义,如服务所在区域为北京,则为)BDY_DX_ENDPOINT=http://smsv3.bj.baidubce.com#百度云短信模版ID,根据自己审核通过的模版来填写(模版支持一个参数code:如prometheus告警:{code})BDY_DX_TEMPLATE_ID=xxxxx#百度云短信签名ID,根据自己审核通过的签名来填写TXY_DX_SIGNATURE_ID=xxxxx#---------------------↓百度Hi(如流)-----------------------#是否开启百度Hi(如流)告警通道,可同时开始多个通道0为关闭,1为开启open-ruliu=0#默认百度Hi(如流)机器人地址BDRL_URL=https://api.im.baidu.com/api/msg/groupmsgsend?access_token=xxxxxxxxxxxxxx#百度Hi(如流)群IDBDRL_ID=123456#---------------------↓bark接口-----------------------#是否开启telegram告警通道,可同时开始多个通道0为关闭,1为开启open-bark=0#bark默认地址, 建议自行部署bark-serverBARK_URL=https://api.day.app#bark key, 多个key使用分割BARK_KEYS=xxxxx# 复制, 推荐开启BARK_COPY=1# 历史记录保存,推荐开启BARK_ARCHIVE=1# 消息分组BARK_GROUP=PrometheusAlert
Grafana
kind: ConfigMapapiVersion: v1metadata:name: cm-grafananamespace: monitorannotations:kubesphere.io/creator: mafeidata:grafana.ini: >-##################### Grafana Configuration Example ####################### Everything has defaults so you only need to uncomment things you want to# change# possible values : production, development;app_mode = production# instance name, defaults to HOSTNAME environment variable value or hostnameif HOSTNAME var is empty;instance_name = ${HOSTNAME}#################################### Paths####################################[paths]# Path to where grafana can store temp files, sessions, and the sqlite3 db(if that is used);data = /var/lib/grafana# Temporary files in `data` directory older than given duration will beremoved;temp_data_lifetime = 24h# Directory where grafana can store logs;logs = /var/log/grafana# Directory where grafana will automatically scan and look for plugins;plugins = /var/lib/grafana/plugins# folder that contains provisioning config files that grafana will apply onstartup and while running.;provisioning = conf/provisioning#################################### Server####################################[server]# Protocol (http, https, h2, socket);protocol = http# The ip address to bind to, empty will bind to all interfaces;http_addr =# The http port to use;http_port = 3000# The public facing domain name used to access grafana from a browser;domain = localhost# Redirect to correct domain if host header does not match domain# Prevents DNS rebinding attacks;enforce_domain = false# The full public facing url you use in browser, used for redirects andemails# If you use reverse proxy and sub path specify full url (with sub path);root_url = %(protocol)s://%(domain)s:%(http_port)s/# Serve Grafana from subpath specified in `root_url` setting. By default itis set to `false` for compatibility reasons.;serve_from_sub_path = false# Log web requests;router_logging = false# the path relative working path;static_root_path = public# enable gzip;enable_gzip = false# https certs & key file;cert_file =;cert_key =# Unix socket path;socket =# CDN Url;cdn_url =# Sets the maximum time using a duration format (5s/5m/5ms) before timingout read of an incoming request and closing idle connections.# `0` means there is no timeout for reading the request.;read_timeout = 0#################################### Database####################################[database]# You can configure the database connection by specifying type, host, name,user and password# as separate properties or as on string using the url properties.# Either "mysql", "postgres" or "sqlite3", it's your choice;type = sqlite3;host = 127.0.0.1:3306;name = grafana;user = root# If the password contains # or ; you have to wrap it with triple quotes. Ex"""#password;""";password =# Use either URL or the previous fields to configure the database# Example: mysql://user:secret@host:port/database;url =# For "postgres" only, either "disable", "require" or "verify-full";ssl_mode = disable;ca_cert_path =;client_key_path =;client_cert_path =;server_cert_name =# For "sqlite3" only, path relative to data_path setting;path = grafana.db# Max idle conn setting default is 2;max_idle_conn = 2# Max conn setting default is 0 (mean not set);max_open_conn =# Connection Max Lifetime default is 14400 (means 14400 seconds or 4 hours);conn_max_lifetime = 14400# Set to true to log the sql calls and execution times.;log_queries =# For "sqlite3" only. cache mode setting used for connecting to thedatabase. (private, shared);cache_mode = private################################### Data sources #########################[datasources]# Upper limit of data sources that Grafana will return. This limit is atemporary configuration and it will be deprecated when pagination will beintroduced on the list data sources API.;datasource_limit = 5000#################################### Cache server#############################[remote_cache]# Either "redis", "memcached" or "database" default is "database";type = database# cache connectionstring options# database: will use Grafana primary database.# redis: config like redis server e.g.`addr=127.0.0.1:6379,pool_size=100,db=0,ssl=false`. Only addr isrequired.ssl may be 'true', 'false', or 'insecure'.# memcache: 127.0.0.1:11211;connstr =#################################### Data proxy ###########################[dataproxy]# This enables data proxy logging, default is false;logging = false# How long the data proxy waits before timing out, default is 30 seconds.# This setting also applies to core backend HTTP data sources where queryrequests use an HTTP client with timeout set.;timeout = 30# How many seconds the data proxy waits before sending a keepalive proberequest.;keep_alive_seconds = 30# How many seconds the data proxy waits for a successful TLS Handshakebefore timing out.;tls_handshake_timeout_seconds = 10# How many seconds the data proxy will wait for a server's first responseheaders after# fully writing the request headers if the request has an "Expect:100-continue"# header. A value of 0 will result in the body being sent immediately,without# waiting for the server to approve.;expect_continue_timeout_seconds = 1# The maximum number of idle connections that Grafana will keep alive.;max_idle_connections = 100# How many seconds the data proxy keeps an idle connection open beforetiming out.;idle_conn_timeout_seconds = 90# If enabled and user is not anonymous, data proxy will add X-Grafana-Userheader with username into the request, default is false.;send_user_header = false#################################### Analytics####################################[analytics]# Server reporting, sends usage counters to stats.grafana.org every 24hours.# No ip addresses are being tracked, only simple counters to track# running instances, dashboard and error counts. It is very helpful to us.# Change this option to false to disable reporting.;reporting_enabled = true# The name of the distributor of the Grafana instance. Ex hosted-grafana,grafana-labs;reporting_distributor = grafana-labs# Set to false to disable all checks to https://grafana.net# for new versions (grafana itself and plugins), check is used# in some UI views to notify that grafana or plugin update exists# This option does not cause any auto updates, nor send any information# only a GET request to http://grafana.com to get latest versions;check_for_updates = true# Google Analytics universal tracking code, only enabled if you specify anid here;google_analytics_ua_id =# Google Tag Manager ID, only enabled if you specify an id here;google_tag_manager_id =#################################### Security####################################[security]# disable creation of admin user on first start of grafana;disable_initial_admin_creation = false# default admin user, created on startup;admin_user = admin# default admin password, can be changed before first start of grafana, orin profile settings;admin_password = admin# used for signing;secret_key = SW2YcwTIb9zpOOhoPsMm# disable gravatar profile images;disable_gravatar = false# data source proxy whitelist (ip_or_domain:port separated by spaces);data_source_proxy_whitelist =# disable protection against brute force login attempts;disable_brute_force_login_protection = false# set to true if you host Grafana behind HTTPS. default is false.;cookie_secure = false# set cookie SameSite attribute. defaults to `lax`. can be set to "lax","strict", "none" and "disabled";cookie_samesite = lax# set to true if you want to allow browsers to render Grafana in a <frame>,<iframe>, <embed> or <object>. default is false.;allow_embedding = false# Set to true if you want to enable http strict transport security (HSTS)response header.# This is only sent when HTTPS is enabled in this configuration.# HSTS tells browsers that the site should only be accessed using HTTPS.;strict_transport_security = false# Sets how long a browser should cache HSTS. Only applied ifstrict_transport_security is enabled.;strict_transport_security_max_age_seconds = 86400# Set to true if to enable HSTS preloading option. Only applied ifstrict_transport_security is enabled.;strict_transport_security_preload = false# Set to true if to enable the HSTS includeSubDomains option. Only appliedif strict_transport_securityis enabled.;strict_transport_security_subdomains = false# Set to true to enable the X-Content-Type-Options response header.# The X-Content-Type-Options response HTTP header is a marker used by theserver to indicate that the MIME types advertised# in the Content-Type headers should not be changed and be followed.;x_content_type_options = true# Set to true to enable the X-XSS-Protection header, which tells browsers tostop pages from loading# when they detect reflected cross-site scripting (XSS) attacks.;x_xss_protection = true# Enable adding the Content-Security-Policy header to your requests.# CSP allows to control resources the user agent is allowed to load andhelps prevent XSS attacks.;content_security_policy = false# Set Content Security Policy template used when adding theContent-Security-Policy header to your requests.# $NONCE in the template includes a random nonce.;content_security_policy_template = """script-src 'unsafe-eval''strict-dynamic' $NONCE;object-src 'none';font-src 'self';style-src 'self''unsafe-inline';img-src 'self' data:;base-uri 'self';connect-src 'self'grafana.com;manifest-src 'self';media-src 'none';form-action 'self';"""#################################### Snapshots ###########################[snapshots]# snapshot sharing options;external_enabled = true;external_snapshot_url = https://snapshots-origin.raintank.io;external_snapshot_name = Publish to snapshot.raintank.io# Set to true to enable this Grafana instance act as an external snapshotserver and allow unauthenticated requests for# creating and deleting snapshots.;public_mode = false# remove expired snapshot;snapshot_remove_expired = true#################################### Dashboards History ##################[dashboards]# Number dashboard versions to keep (per dashboard). Default: 20, Minimum: 1;versions_to_keep = 20# Minimum dashboard refresh interval. When set, this will restrict users toset the refresh interval ofa dashboard lower than given interval. Perdefault this is 5 seconds.# The interval string is a possibly signed sequence of decimal numbers,followed by a unit suffix (ms, s, m, h, d), e.g. 30s or 1m.;min_refresh_interval = 5s# Path to the default home dashboard. If this value is empty, then Grafanauses StaticRootPath + "dashboards/home.json";default_home_dashboard_path =#################################### Users ###############################[users]# disable user signup / registration;allow_sign_up = true# Allow non admin users to create organizations;allow_org_create = true# Set to true to automatically assign new users to the default organization(id 1);auto_assign_org = true# Set this value to automatically add new users to the provided organization(if auto_assign_org above is set to true);auto_assign_org_id = 1# Default role new users will be automatically assigned (if disabled aboveis set to true);auto_assign_org_role = Viewer# Require email validation before sign up completes;verify_email_enabled = false# Background text for the user field on the login page;login_hint = email or username;password_hint = password# Default UI theme ("dark" or "light");default_theme = dark# External user management, these options affect the organization users view;external_manage_link_url =;external_manage_link_name =;external_manage_info =# Viewers can edit/inspect dashboard settings in the browser. But not savethe dashboard.;viewers_can_edit = false# Editors can administrate dashboard, folders and teams they create;editors_can_admin = false# The duration in time a user invitation remains valid before expiring. Thissetting should be expressed as a duration. Examples: 6h (hours), 2d (days),1w (week). Default is 24h (24 hours). The minimum supported duration is 15m(15 minutes).;user_invite_max_lifetime_duration = 24h# Enter a comma-separated list of users login to hide them in the GrafanaUI. These users are shown to Grafana admins and themselves.; hidden_users =[auth]# Login cookie name;login_cookie_name = grafana_session# The maximum lifetime (duration) an authenticated user can be inactivebefore being required to login at next visit. Default is 7 days (7d). Thissetting should be expressed as a duration, e.g. 5m (minutes), 6h (hours),10d (days), 2w (weeks), 1M (month). The lifetime resets at each successfultoken rotation.;login_maximum_inactive_lifetime_duration =# The maximum lifetime (duration) an authenticated user can be logged insince login time before being required to login. Default is 30 days (30d).This setting should be expressed as a duration, e.g. 5m (minutes), 6h(hours), 10d (days), 2w (weeks), 1M (month).;login_maximum_lifetime_duration =# How often should auth tokens be rotated for authenticated users when beingactive. The default is each 10 minutes.;token_rotation_interval_minutes = 10# Set to true to disable (hide) the login form, useful if you use OAuth,defaults to false;disable_login_form = false# Set to true to disable the signout link in the side menu. useful if youuse auth.proxy, defaults to false;disable_signout_menu = false# URL to redirect the user to after sign out;signout_redirect_url =# Set to true to attempt login with OAuth automatically, skipping the loginscreen.# This setting is ignored if multiple OAuth providers are configured.;oauth_auto_login = false# OAuth state max age cookie duration in seconds. Defaults to 600 seconds.;oauth_state_cookie_max_age = 600# limit of api_key seconds to live before expiration;api_key_max_seconds_to_live = -1# Set to true to enable SigV4 authentication option for HTTP-baseddatasources.;sigv4_auth_enabled = false#################################### Anonymous Auth ######################[auth.anonymous]# enable anonymous access;enabled = false# specify organization name that should be used for unauthenticated users;org_name = Main Org.# specify role for unauthenticated users;org_role = Viewer# mask the Grafana version number for unauthenticated users;hide_version = false#################################### GitHub Auth ##########################[auth.github];enabled = false;allow_sign_up = true;client_id = some_id;client_secret = some_secret;scopes = user:email,read:org;auth_url = https://github.com/login/oauth/authorize;token_url = https://github.com/login/oauth/access_token;api_url = https://api.github.com/user;allowed_domains =;team_ids =;allowed_organizations =#################################### GitLab Auth #########################[auth.gitlab];enabled = false;allow_sign_up = true;client_id = some_id;client_secret = some_secret;scopes = api;auth_url = https://gitlab.com/oauth/authorize;token_url = https://gitlab.com/oauth/token;api_url = https://gitlab.com/api/v4;allowed_domains =;allowed_groups =#################################### Google Auth ##########################[auth.google];enabled = false;allow_sign_up = true;client_id = some_client_id;client_secret = some_client_secret;scopes = https://www.googleapis.com/auth/userinfo.profilehttps://www.googleapis.com/auth/userinfo.email;auth_url = https://accounts.google.com/o/oauth2/auth;token_url = https://accounts.google.com/o/oauth2/token;api_url = https://www.googleapis.com/oauth2/v1/userinfo;allowed_domains =;hosted_domain =#################################### Grafana.com Auth ####################[auth.grafana_com];enabled = false;allow_sign_up = true;client_id = some_id;client_secret = some_secret;scopes = user:email;allowed_organizations =#################################### Azure AD OAuth #######################[auth.azuread];name = Azure AD;enabled = false;allow_sign_up = true;client_id = some_client_id;client_secret = some_client_secret;scopes = openid email profile;auth_url =https://login.microsoftonline.com/<tenant-id>/oauth2/v2.0/authorize;token_url = https://login.microsoftonline.com/<tenant-id>/oauth2/v2.0/token;allowed_domains =;allowed_groups =#################################### Okta OAuth #######################[auth.okta];name = Okta;enabled = false;allow_sign_up = true;client_id = some_id;client_secret = some_secret;scopes = openid profile email groups;auth_url = https://<tenant-id>.okta.com/oauth2/v1/authorize;token_url = https://<tenant-id>.okta.com/oauth2/v1/token;api_url = https://<tenant-id>.okta.com/oauth2/v1/userinfo;allowed_domains =;allowed_groups =;role_attribute_path =#################################### Generic OAuth##########################[auth.generic_oauth];enabled = false;name = OAuth;allow_sign_up = true;client_id = some_id;client_secret = some_secret;scopes = user:email,read:org;email_attribute_name = email:primary;email_attribute_path =;login_attribute_path =;name_attribute_path =;id_token_attribute_name =;auth_url = https://foo.bar/login/oauth/authorize;token_url = https://foo.bar/login/oauth/access_token;api_url = https://foo.bar/user;allowed_domains =;team_ids =;allowed_organizations =;role_attribute_path =;tls_skip_verify_insecure = false;tls_client_cert =;tls_client_key =;tls_client_ca =#################################### Basic Auth ##########################[auth.basic];enabled = true#################################### Auth Proxy ##########################[auth.proxy];enabled = false;header_name = X-WEBAUTH-USER;header_property = username;auto_sign_up = true;sync_ttl = 60;whitelist = 192.168.1.1, 192.168.2.1;headers = Email:X-User-Email, Name:X-User-Name# Read the auth proxy docs for details on what the setting below enables;enable_login_token = false#################################### Auth LDAP ##########################[auth.ldap];enabled = false;config_file = /etc/grafana/ldap.toml;allow_sign_up = true# LDAP background sync (Enterprise only)# At 1 am every day;sync_cron = "0 0 1 * * *";active_sync_enabled = true#################################### AWS ###########################[aws]# Enter a comma-separated list of allowed AWS authentication providers.# Options are: default (AWS SDK Default), keys (Access && secret key),credentials (Credentials field),ec2_iam_role (EC2 IAM Role); allowed_auth_providers = default,keys,credentials# Allow AWS users to assume a role using temporary security credentials.# If true, assume role will be enabled for all AWS authentication providersthat are specified in aws_auth_providers; assume_role_enabled = true#################################### SMTP / Emailing##########################[smtp]enabled = truehost = smtp.126.com:465user = mafei7@126.com# If the password contains # or ; you have to wrap it with triple quotes. Ex"""#password;"""password = RNPEBMEVLKMEAJUW;cert_file =;key_file =skip_verify = truefrom_address = mafei7@126.comfrom_name = Grafana# EHLO identity in SMTP dialog (defaults to instance_name);ehlo_identity = dashboard.example.com# SMTP startTLS policy (defaults to 'OpportunisticStartTLS');startTLS_policy = NoStartTLS[emails];welcome_email_on_sign_up = false;templates_pattern = emails/*.html#################################### Logging ##########################[log]# Either "console", "file", "syslog". Default is console and file# Use space to separate multiple modes, e.g. "console file";mode = console file# Either "debug", "info", "warn", "error", "critical", default is "info";level = info# optional settings to set different levels for specific loggers. Ex filters= sqlstore:debug;filters =# For "console" mode only[log.console];level =# log line format, valid options are text, console and json;format = console# For "file" mode only[log.file];level =# log line format, valid options are text, console and json;format = text# This enables automated log rotate(switch of following options), default istrue;log_rotate = true# Max line number of single file, default is 1000000;max_lines = 1000000# Max size shift of single file, default is 28 means 1 << 28, 256MB;max_size_shift = 28# Segment log daily, default is true;daily_rotate = true# Expired days of log file(delete after max days), default is 7;max_days = 7[log.syslog];level =# log line format, valid options are text, console and json;format = text# Syslog network type and address. This can be udp, tcp, or unix. If leftblank, the default unix endpoints will be used.;network =;address =# Syslog facility. user, daemon and local0 through local7 are valid.;facility =# Syslog tag. By default, the process' argv[0] is used.;tag =[log.frontend]# Should Sentry javascript agent be initialized;enabled = false# Sentry DSN if you want to send events to Sentry.;sentry_dsn =# Custom HTTP endpoint to send events captured by the Sentry agent to.Default will log the events to stdout.;custom_endpoint = /log# Rate of events to be reported between 0 (none) and 1 (all), float;sample_rate = 1.0# Requests per second limit enforced an extended period, for Grafana backendlog ingestion endpoint (/log).;log_endpoint_requests_per_second_limit = 3# Max requests accepted per short interval of time for Grafana backend logingestion endpoint (/log).;log_endpoint_burst_limit = 15#################################### Usage Quotas ########################[quota]; enabled = false#### set quotas to -1 to make unlimited. ##### limit number of users per Org.; org_user = 10# limit number of dashboards per Org.; org_dashboard = 100# limit number of data_sources per Org.; org_data_source = 10# limit number of api_keys per Org.; org_api_key = 10# limit number of orgs a user can create.; user_org = 10# Global limit of users.; global_user = -1# global limit of orgs.; global_org = -1# global limit of dashboards; global_dashboard = -1# global limit of api_keys; global_api_key = -1# global limit on number of logged in users.; global_session = -1#################################### Alerting ############################[alerting]# Disable alerting engine & UI featuresenabled = true# Makes it possible to turn off alert rule execution but alerting UI isvisibleexecute_alerts = true# Default setting for new alert rules. Defaults to categorize error andtimeouts as alerting. (alerting, keep_state);error_or_timeout = alerting# Default setting for how Grafana handles nodata or null values in alerting.(alerting, no_data, keep_state, ok);nodata_or_nullvalues = no_data# Alert notifications can include images, but rendering many images at thesame time can overload the server# This limit will protect the server from render overloading and make surenotifications are sent out quickly;concurrent_render_limit = 5# Default setting for alert calculation timeout. Default value is 30;evaluation_timeout_seconds = 30# Default setting for alert notification timeout. Default value is 30;notification_timeout_seconds = 30# Default setting for max attempts to sending alert notifications. Defaultvalue is 3;max_attempts = 3# Makes it possible to enforce a minimal interval between evaluations, toreduce load on the backend;min_interval_seconds = 1# Configures for how long alert annotations are stored. Default is 0, whichkeeps them forever.# This setting should be expressed as a duration. Examples: 6h (hours), 10d(days), 2w (weeks), 1M (month).;max_annotation_age =# Configures max number of alert annotations that Grafana stores. Defaultvalue is 0, which keeps all alert annotations.;max_annotations_to_keep =#################################### Annotations #########################[annotations]# Configures the batch size for the annotation clean-up job. This setting isused for dashboard, API, and alert annotations.;cleanupjob_batchsize = 100[annotations.dashboard]# Dashboard annotations means that annotations are associated with thedashboard they are created on.# Configures how long dashboard annotations are stored. Default is 0, whichkeeps them forever.# This setting should be expressed as a duration. Examples: 6h (hours), 10d(days), 2w (weeks), 1M (month).;max_age =# Configures max number of dashboard annotations that Grafana stores.Default value is 0, which keeps all dashboard annotations.;max_annotations_to_keep =[annotations.api]# API annotations means that the annotations have been created using the APIwithout any# association with a dashboard.# Configures how long Grafana stores API annotations. Default is 0, whichkeeps them forever.# This setting should be expressed as a duration. Examples: 6h (hours), 10d(days), 2w (weeks), 1M (month).;max_age =# Configures max number of API annotations that Grafana keeps. Default valueis 0, which keeps all API annotations.;max_annotations_to_keep =#################################### Explore #############################[explore]# Enable the Explore section;enabled = true#################################### Internal Grafana Metrics########################### Metrics available at HTTP API Url /metrics[metrics]# Disable / Enable internal metrics;enabled = true# Graphite Publish interval;interval_seconds = 10# Disable total stats (stat_totals_*) metrics to be generated;disable_total_stats = false#If both are set, basic auth will be required for the metrics endpoint.; basic_auth_username =; basic_auth_password =# Metrics environment info adds dimensions to the `grafana_environment_info`metric, which# can expose more information about the Grafana instance.[metrics.environment_info]#exampleLabel1 = exampleValue1#exampleLabel2 = exampleValue2# Send internal metrics to Graphite[metrics.graphite]# Enable by setting the address setting (ex localhost:2003);address =;prefix = prod.grafana.%(instance_name)s.#################################### Grafana.com integration########################### Url used to import dashboards directly from Grafana.com[grafana_com];url = https://grafana.com#################################### Distributed tracing ############[tracing.jaeger]# Enable by setting the address sending traces to jaeger (ex localhost:6831);address = localhost:6831# Tag that will always be included in when creating new spans. ex(tag1:value1,tag2:value2);always_included_tag = tag1:value1# Type specifies the type of the sampler: const, probabilistic,rateLimiting, or remote;sampler_type = const# jaeger samplerconfig param# for "const" sampler, 0 or 1 for always false/true respectively# for "probabilistic" sampler, a probability between 0 and 1# for "rateLimiting" sampler, the number of spans per second# for "remote" sampler, param is the same as for "probabilistic"# and indicates the initial sampling rate before the actual one# is received from the mothership;sampler_param = 1# sampling_server_url is the URL of a sampling manager providing a samplingstrategy.;sampling_server_url =# Whether or not to use Zipkin propagation (x-b3- HTTP headers).;zipkin_propagation = false# Setting this to true disables shared RPC spans.# Not disabling is the most common setting when using Zipkin elsewhere inyour infrastructure.;disable_shared_zipkin_spans = false#################################### External image storage##########################[external_image_storage]# Used for uploading images to public servers so they can be included inslack/email messages.# you can choose between (s3, webdav, gcs, azure_blob, local);provider =[external_image_storage.s3];endpoint =;path_style_access =;bucket =;region =;path =;access_key =;secret_key =[external_image_storage.webdav];url =;public_url =;username =;password =[external_image_storage.gcs];key_file =;bucket =;path =[external_image_storage.azure_blob];account_name =;account_key =;container_name =[external_image_storage.local]# does not require any configuration[rendering]# Options to configure a remote HTTP image rendering service, e.g. usinghttps://github.com/grafana/grafana-image-renderer.# URL to a remote HTTP image renderer service, e.g.http://localhost:8081/render, will enable Grafana to render panels anddashboards to PNG-images using HTTP requests to an external service.;server_url =# If the remote HTTP image renderer service runs on a different server thanthe Grafana server you may have to configure this to a URL where Grafana isreachable, e.g. http://grafana.domain/.;callback_url =# Concurrent render request limit affects when the /render HTTP endpoint isused. Rendering many imagesat the same time can overload the server,# which this setting can help protect against by only allowing a certainamount of concurrent requests.;concurrent_render_request_limit = 30[panels]# If set to true Grafana will allow script tags in text panels. Notrecommended as it enable XSS vulnerabilities.;disable_sanitize_html = false[plugins];enable_alpha = false;app_tls_skip_verify_insecure = false# Enter a comma-separated list of plugin identifiers to identify pluginsthat are allowed to be loaded even if they lack a valid signature.;allow_loading_unsigned_plugins =;marketplace_url = https://grafana.com/grafana/plugins/#################################### Grafana Image Renderer Plugin##########################[plugin.grafana-image-renderer]# Instruct headless browser instance to use a default timezone when notprovided by Grafana, e.g. when rendering panel image of alert.# See ICU’s metaZones.txt(https://cs.chromium.org/chromium/src/third_party/icu/source/data/misc/metaZones.txt)for a list of supported# timezone IDs. Fallbacks to TZ environment variable if not set.;rendering_timezone =# Instruct headless browser instance to use a default language when notprovided by Grafana, e.g. when rendering panel image of alert.# Please refer to the HTTP header Accept-Language to understand how toformat this value, e.g. 'fr-CH, fr;q=0.9, en;q=0.8, de;q=0.7, *;q=0.5'.;rendering_language =# Instruct headless browser instance to use a default device scale factorwhen not provided by Grafana,e.g. when rendering panel image of alert.# Default is 1. Using a higher value will produce more detailed images(higher DPI), but will require more disk space to store an image.;rendering_viewport_device_scale_factor =# Instruct headless browser instance whether to ignore HTTPS errors duringnavigation. Per default HTTPS errors are not ignored. Due to# the security risk it's not recommended to ignore HTTPS errors.;rendering_ignore_https_errors =# Instruct headless browser instance whether to capture and log verboseinformation when rendering an image. Default is false and will# only capture and log error messages. When enabled, debug messages arecaptured and logged as well.# For the verbose information to be included in the Grafana server log youhave to adjust the renderinglog level to debug, configure# [log].filter = rendering:debug.;rendering_verbose_logging =# Instruct headless browser instance whether to output its debug and errormessages into running process of remote rendering service.# Default is false. This can be useful to enable (true) whentroubleshooting.;rendering_dumpio =# Additional arguments to pass to the headless browser instance. Default is--no-sandbox. The list of Chromium flags can be found# here (https://peter.sh/experiments/chromium-command-line-switches/).Multiple arguments is separated with comma-character.;rendering_args =# You can configure the plugin to use a different browser binary instead ofthe pre-packaged version ofChromium.# Please note that this is not recommended, since you may encounter problemsif the installed version of Chrome/Chromium is not# compatible with the plugin.;rendering_chrome_bin =# Instruct how headless browser instances are created. Default is 'default'and will create a new browser instance on each request.# Mode 'clustered' will make sure that only a maximum of browsers/incognitopages can execute concurrently.# Mode 'reusable' will have one browser instance and will create a newincognito page on each request.;rendering_mode =# When rendering_mode = clustered you can instruct how many browsers orincognito pages can execute concurrently. Default is 'browser'# and will cluster using browser instances.# Mode 'context' will cluster using incognito pages.;rendering_clustering_mode =# When rendering_mode = clustered you can define maximum number of browserinstances/incognito pages that can execute concurrently..;rendering_clustering_max_concurrency =# Limit the maximum viewport width, height and device scale factor that canbe requested.;rendering_viewport_max_width =;rendering_viewport_max_height =;rendering_viewport_max_device_scale_factor =# Change the listening host and port of the gRPC server. Default host is127.0.0.1 and default port is 0 and will automatically assign# a port not in use.;grpc_host =;grpc_port =[enterprise]# Path to a valid Grafana Enterprise license.jwt file;license_path =[feature_toggles]# enable features, separated by spaces;enable =[date_formats]# For information on what formatting patterns that are supportedhttps://momentjs.com/docs/#/displaying/# Default system date format used in time range picker and other placeswhere full time is displayed;full_date = YYYY-MM-DD HH:mm:ss# Used by graph and other places where we only show small intervals;interval_second = HH:mm:ss;interval_minute = HH:mm;interval_hour = MM/DD HH:mm;interval_day = MM/DD;interval_month = YYYY-MM;interval_year = YYYY# Experimental feature;use_browser_locale = false# Default timezone for user preferences. Options are 'browser' for thebrowser local timezone or a timezone name from IANA Time Zone database, e.g.'UTC' or 'Europe/Amsterdam' etc.;default_timezone = browser[expressions]# Enable or disable the expressions functionality.;enabled = true
deployment
kind: Deployment
apiVersion: apps/v1
metadata:
  name: grafana
  namespace: monitor
  labels:
    app: grafana
  annotations:
    deployment.kubernetes.io/revision: '5'
    kubesphere.io/creator: mafei
spec:
  replicas: 1
  selector:
    matchLabels:
      app: grafana
  template:
    metadata:
      creationTimestamp: null
      labels:
        app: grafana
      annotations:
        kubesphere.io/restartedAt: '2022-01-18T05:48:42.695Z'
    spec:
      volumes:
        - name: volume-data
          persistentVolumeClaim:
            claimName: pvc-grafana
        - name: volume-x6fx99
          configMap:
            name: cm-grafana
            defaultMode: 420
      containers:
        - name: grafana
          image: 'grafana/grafana:7.5.2'
          ports:
            - name: tcp-3000
              containerPort: 3000
              protocol: TCP
          resources: {}
          volumeMounts:
            - name: volume-data
              mountPath: /var/lib/grafana
            - name: volume-x6fx99
              readOnly: true
              mountPath: /etc/grafana/grafana.ini
              subPath: grafana.ini
          livenessProbe:
            tcpSocket:
              port: 3000
            initialDelaySeconds: 30
            timeoutSeconds: 1
            periodSeconds: 10
            successThreshold: 1
            failureThreshold: 3
          readinessProbe:
            httpGet:
              path: /robots.txt
              port: 3000
              scheme: HTTP
            initialDelaySeconds: 10
            timeoutSeconds: 2
            periodSeconds: 30
            successThreshold: 1
            failureThreshold: 3
          terminationMessagePath: /dev/termination-log
          terminationMessagePolicy: File
          imagePullPolicy: IfNotPresent
      restartPolicy: Always
      terminationGracePeriodSeconds: 30
      dnsPolicy: ClusterFirst
      serviceAccountName: default
      serviceAccount: default
      securityContext:
        supplementalGroups:
          - 0
        fsGroup: 472
      schedulerName: default-scheduler
  strategy:
    type: RollingUpdate
    rollingUpdate:
      maxUnavailable: 25%
      maxSurge: 25%
  revisionHistoryLimit: 10
  progressDeadlineSeconds: 600

若有收获,就点个赞吧
0 人点赞
