一、安装Prometheus
1.下载源码
首先要先确定我们的 k8s 版本,根据版本去 github 上找对应版本的 Kube-prometheus 。
[root@k8s-master-108 ~]# kubectl versionClient Version: version.Info{Major:"1", Minor:"19", GitVersion:"v1.19.0", GitCommit:"e19964183377d0ec2052d1f1fa930c4d7575bd50", GitTreeState:"clean", BuildDate:"2020-08-26T14:30:33Z", GoVersion:"go1.15", Compiler:"gc", Platform:"linux/amd64"}Server Version: version.Info{Major:"1", Minor:"19", GitVersion:"v1.19.0", GitCommit:"e19964183377d0ec2052d1f1fa930c4d7575bd50", GitTreeState:"clean", BuildDate:"2020-08-26T14:23:04Z", GoVersion:"go1.15", Compiler:"gc", Platform:"linux/amd64"}
我们的 k8s 版本为 v1.19.0 ,通过查询下表可知,我们需要 0.6 或 0.7 版本的 prometheus 。<br />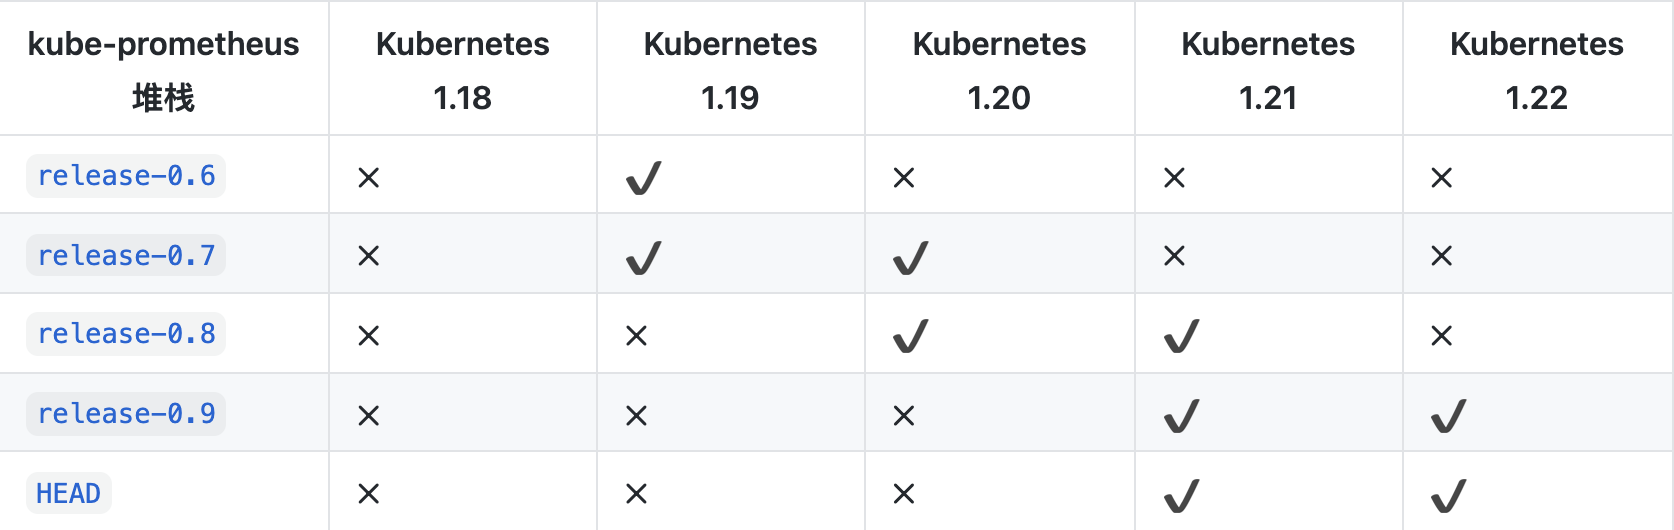<br />我们选用 release-0.6 ,下载即可。
[root@k8s-master-108 ~]# git clone https://github.com/prometheus-operator/kube-prometheus.git
如果下载失败,可以将链接的 https 改为 git ,就能正常下载了。
2.切换版本
下载完毕后,进入 prometheus 的文件夹,切换 prometheus 版本
# 切换版本
[root@k8s-master-108 kube-prometheus]# git checkout release-0.6

# 检查版本
[root@k8s-master-108 kube-prometheus]# git branch
  main
* release-0.6
3.部署 prometheus
[root@k8s-master-108 kube-prometheus]# kubectl create -f manifests/setup
[root@k8s-master-108 kube-prometheus]# until kubectl get servicemonitors --all-namespaces ; do date; sleep 1; echo ""; done
NAMESPACE    NAME                      AGE
monitoring   alertmanager              25h
monitoring   coredns                   25h
monitoring   grafana                   25h
monitoring   kube-apiserver            25h
monitoring   kube-controller-manager   25h
monitoring   kube-scheduler            25h
monitoring   kube-state-metrics        25h
monitoring   kubelet                   25h
monitoring   node-exporter             25h
monitoring   prometheus                25h
monitoring   prometheus-adapter        25h
monitoring   prometheus-operator       25h
monitoring   pushgateway-monitor       25h
[root@k8s-master-108 kube-prometheus]# kubectl create -f manifests/
4.修改service模式
为了方便主机访问 prometheus 和 grafana ,我们将他们的 service 修改为 NodePort 模式。
先找到我们要修改的 service ,分别为 grafana 和 prometheus-k8s 。
[root@k8s-master-108 manifests]# kubectl get svc -n monitoring
NAME                    TYPE        CLUSTER-IP       EXTERNAL-IP   PORT(S)                      AGE
alertmanager-main       ClusterIP   10.101.189.14    <none>        9093/TCP                     25h
alertmanager-operated   ClusterIP   None             <none>        9093/TCP,9094/TCP,9094/UDP   25h
grafana                 ClusterIP   10.106.151.169   <none>        3000/TCP               25h
kube-state-metrics      ClusterIP   None             <none>        8443/TCP,9443/TCP            25h
node-exporter           ClusterIP   None             <none>        9100/TCP                     6h56m
prometheus-adapter      ClusterIP   10.103.64.236    <none>        443/TCP                      25h
prometheus-k8s          ClusterIP   10.111.43.197    <none>        9090/TCP               25h
prometheus-operated     ClusterIP   None             <none>        9090/TCP                     25h
prometheus-operator     ClusterIP   None             <none>        8443/TCP                     25h
通过下列命令修改对应 yaml 文件。
[root@k8s-master-108 manifests]# kubectl edit svc prometheus-k8s -n monitoring
修改红色方框位置,改成如下图
grafana 同理。
[root@k8s-master-108 manifests]# kubectl edit svc grafana -n monitoring

5.修改node-exporter配置
由于官方给的 node-exporter 中,web.listen-address 和 upstream 是 127.0.0.1:9100 ,这个地址只能用 Localhost 访问,无法使用 Node 节点的地址访问,因此需要修改为 0.0.0.0:9100 。修改目录如下:
/root/prometheus/kube-prometheus/manifests/node-exporter-daemonset.yaml
修改红框内内容。
修改完毕,prometheus 安装至此完成。
二、安装Pushgateway
1.部署源码
Pushgateway 有三个文件需要部署,分别是 monitor-pushgateway,yaml、pod-pushgateway,yaml、service-pushgateway.yaml 。
其源码如下:
# monitor-pushgateway.yaml
apiVersion: monitoring.coreos.com/v1
kind: ServiceMonitor
metadata:
  name: pushgateway-monitor
  namespace: monitoring
  labels:
    k8s-app: pushgateway
spec:
  jobLabel: k8s-app
  endpoints:
  - port: http
    interval: 30s
    scheme: http
  selector:
    matchLabels:
      pushgateway: promethues
  namespaceSelector:
    matchNames:
    - default
# pod-pushgateway.yaml
apiVersion: v1
kind: Pod
metadata:
  name: pushgateway-prometheus
  labels:
    pushgateway: pushgateway
spec:
  containers:
  - name: pushgateway
    image: prom/pushgateway:v1.4.1
    ports:
    - containerPort: 9091
      name: http
    volumeMounts:
    - name: time-config
      mountPath: /etc/localtime
      readOnly: true
  volumes:
  - name: time-config
    hostPath:
      path: /etc/localtime
# service-pushgateway.yaml
apiVersion: v1
kind: Service
metadata:
  name: pushgateway-service
  labels:
    pushgateway: promethues
spec:
  selector:
    pushgateway: pushgateway
  type: NodePort
  ports:
  - name: http
    port: 9091
    protocol: TCP
    nodePort: 30003
以上文件逐个部署即可
[root@k8s-master-108 prometheus]# kubectl apply -f monitor-pushgateway.yaml
[root@k8s-master-108 prometheus]# kubectl apply -f pod-pushgateway.yaml
[root@k8s-master-108 prometheus]# kubectl apply -f service-pushgateway.yaml
2.推送数据
推数据给 pushgateway 可用如下代码:
[root@k8s-master-108 prometheus]# echo "some_job1_online_counter 3" | curl --data-binary @- http://10.10.103.108:9100/metrics/job/some_job1
上面代码中,“|”之前的代码输出的内容,会被获取并发送给 putegateway 的服务器。由此可得,我们从各个节点中获取信息,然后发送给 putgateway ,由 putgateway 推送给 prometheus ,即可监控。<br />通过 node_exporter 我们可以获取到各个 Node 的指标,从 node_exporter 中获取指标,然后推送给 putgateway ,从而再通过 prometheus 监控指标。<br />其中,node_exporter 获取各个 Node 的指标的代码如下:
[root@k8s-master-108 ~]# curl -s http://10.10.103.110:9100/metrics
这里的 IP 地址 10.10.103.110 为我们要监控的 Node 的 IP 地址,9100 为 node_exporter 的暴露端口。
我们获取到指标后,通过上述代码与推送给 pushgateway 的代码结合,可以先获取指标,后推送给 pushgateway ,从而完成监控。
[root@k8s-master-108 ~]# curl -s http://10.10.103.110:9100/metrics | curl --data-binary @- http://10.10.103.108:9100/metrics/job/push_node_exporter/instance/"10.10.103.110:9100"
推送完成后,可以在 pushgateway 的平台中看到推送的数据。<br />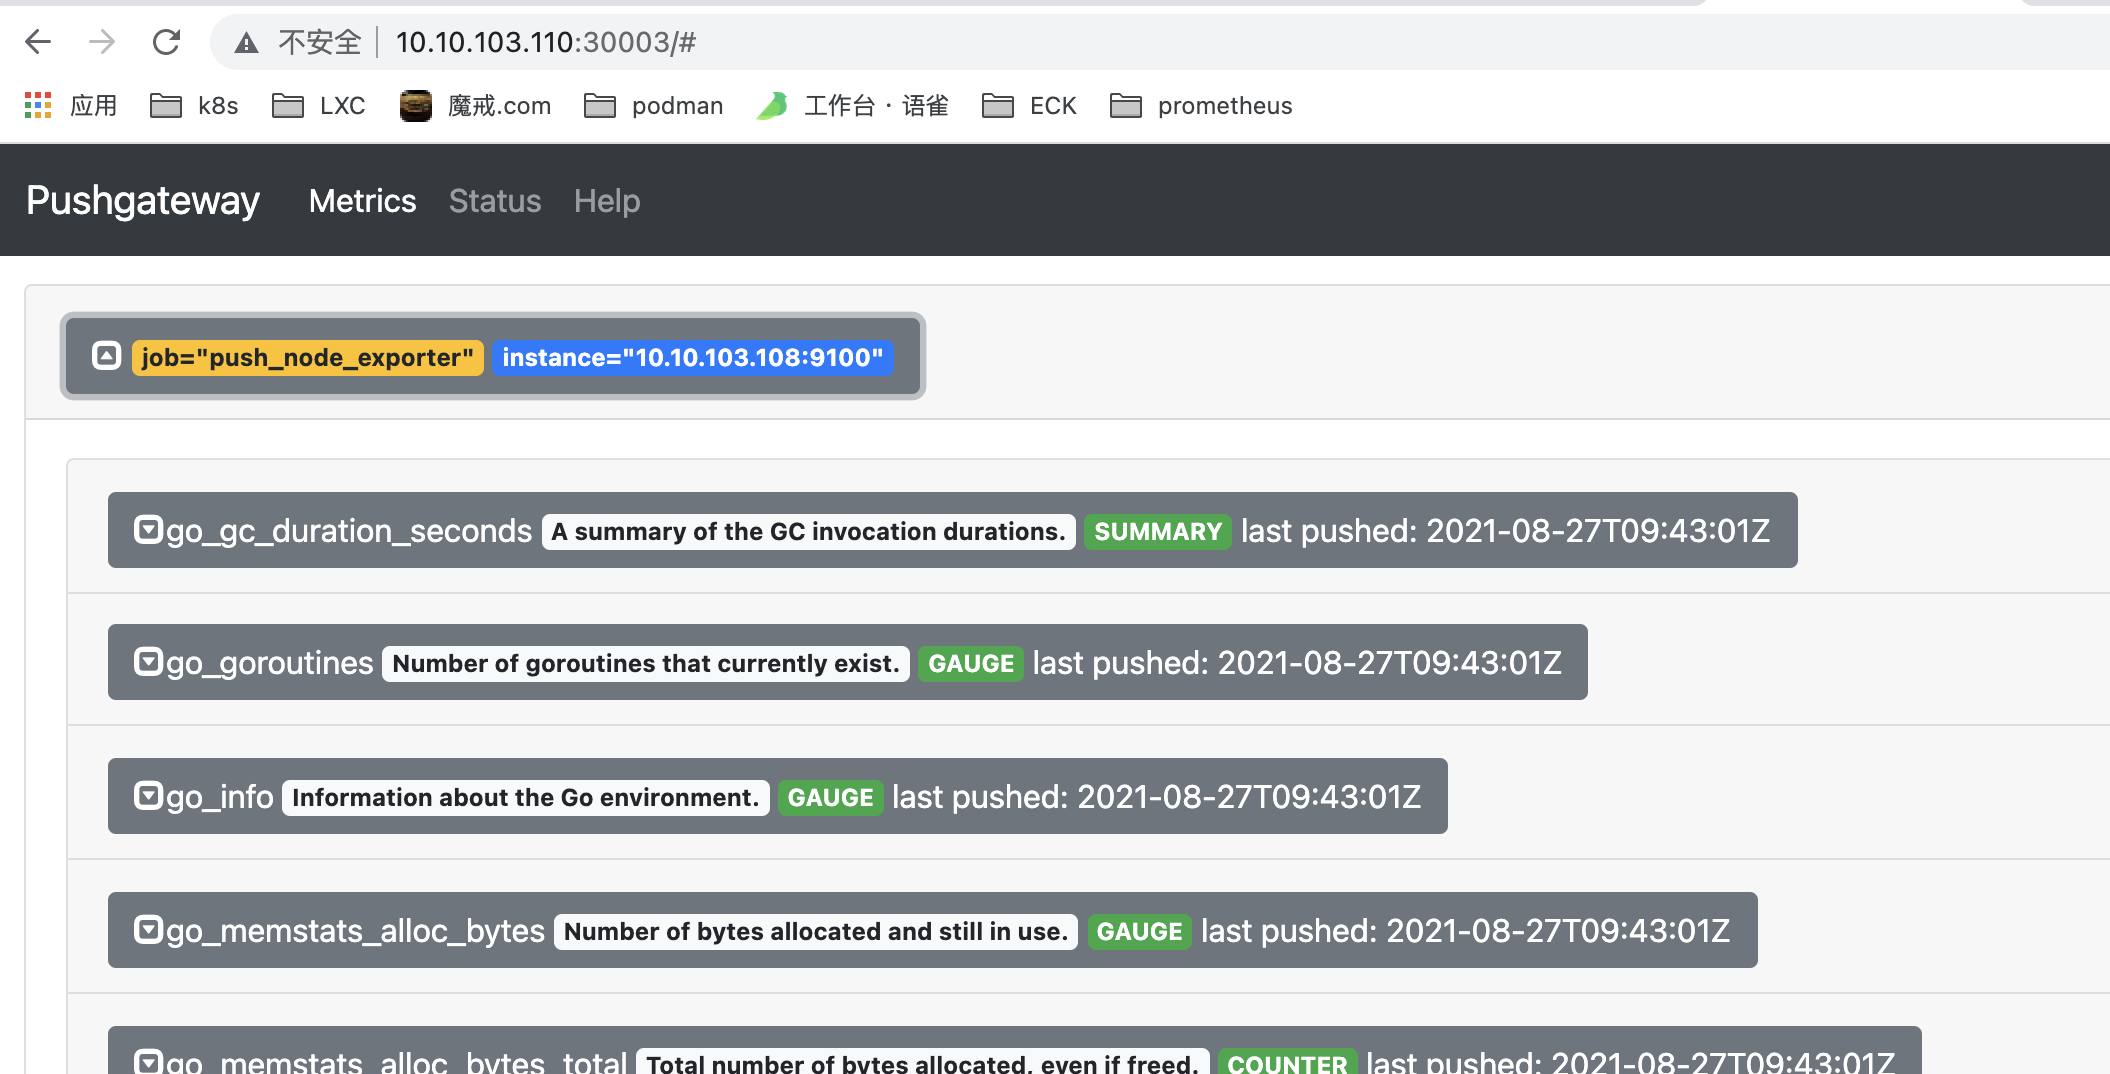<br />pushgateway 暴露端口为 30003 ,IP + 端口号 即可访问。
3.配置定时任务
如果每次推送都通过手动的方式推监测数据,将会耗费大量的时间和精力在重复劳动上,我们可以通过设置定时任务的方式使服务器自动推送数据给 pushgateway ,从而完成监控。
定时任务的思路有两套,第一套方案是使用 k8s 自带功能 cronjob 来实现定时任务,另一套方案是采用 linux 系统中的工具 crontab 来实现定时任务。
本文采用第二套方案,直接采用 linux 中自带的 crontab 来实现定时任务。
首先需要创建 docker 镜像,在镜像中实现 crontab 并打包,再通过 k8s 部署,从而实现自动化任务。
为了获取正确的服务器时间,需要在 pushgateway 所在的 Node 矫正时间,从而使 pushgateway 可以获得正确的服务器时间。
# 下载 ntpdate
[root@k8s-node-110 pushgateway]# yum install -y ntpdate

# 矫正服务器时间
[root@k8s-node-110 pushgateway]# ntpdate 120.24.81.91
部署 cron-deamonset.yaml 来实现自动定时任务。其代码如下:
# cron-deamonset.yaml
apiVersion: apps/v1
kind: DaemonSet
metadata:
  name: pushgateway-cron
  labels:
    app: pushgateway-cron
    version: stable
spec:
  selector:
    matchLabels:
      app: pushgateway-cron
      version: stable
  template:
    metadata:
      labels:
        app: pushgateway-cron
        version: stable
    spec:
      nodeSelector:
        node: node
      containers:
      - name: pushgateway-cron
        image: 10.10.103.114/shangqi-kubeedge/pushgateway-cron:v0.1.1
        command:
          - sh
          - /code/run.sh
        env:
        - name: nodeIP
          valueFrom:
            fieldRef:
              fieldPath: status.hostIP
        name: time-set
        volumeMounts:
        - name: time-config
          mountPath: /etc/localtime
          readOnly: true
      volumes:
      - name: time-config
        hostPath:
          path: /etc/localtime
      restartPolicy: Always
创建完源码后,执行并部署源码
[root@k8s-master-108 prometheus]# k apply -f cron-deamonset.yaml
daemonset.apps/pushgateway-cron created
部署完毕,可以在 http://10.10.103.110:30003 查看是否部署成功。
三、制作镜像pushgateway-cron详解
1.制作镜像
在第二部分中,pod-cron.yaml 文件中存在镜像 pushgateway-cron ,这个镜像需要自己制作,也可以通过 harbor 获取。
首先拉取一个 centos 的镜像,最好为 centos7 版本。
[root@k8s-node-110 ~]# docker pull centos:7
然后运行容器并进入
[root@k8s-node-110 ~]# docker run -it centos:7 /bin/bash
下载 curl
[root@2b987368dc1a /]# yum install -y curl
2.制作自动循环脚本
下载完毕 curl ,我们需要为我们的容器设置启动器,否则在启动后瞬间它会自动关闭,因为缺失循环运行的工具。可以在根目录下创建目录 code ,然后在 code 中新建文件 run.sh 。
[root@2b987368dc1a /]# mkdir code
[root@2b987368dc1a /]# cd code
[root@2b987368dc1a code]# vi run.sh
run.sh 内容如下:
#!/bin/sh

while [ true ]; do
/bin/sleep 10
curl -s http://$nodeIP:9100/metrics | curl --data-binary @- http://10.10.103.108:30003/metrics/job/push_node_exporter/instance/"$nodeIP:9100"
done
这个 run.sh 会无限循环将 node 节点中的信息推送给 pushgateway 。每十秒执行一次。
3.打包容器
创建完毕后,另外起一个 shell 窗口,打包这个容器。
[root@k8s-node-110 ~]# docker commit --change='CMD ["/bin/bash","/code/run.sh"]' ab1a863f1edc 10.10.103.114/shangqi-kubeedge/pushgateway-cron:v0.0.3
其中,ab1a863f1edc 为容器名,可以通过 docker ps 来查看当前容器名,10.10.103.114/shangqi-kubeedge/pushgateway-cron 为镜像名。v0.0.3 为版本号。
4.推送至镜像库
打包完后,通过下列代码可以推送至我们的镜像库保存。
[root@k8s-node-110 ~]# docker push 10.10.103.114/shangqi-kubeedge/pushgateway-cron:v0.0.3

若有收获,就点个赞吧
0 人点赞
