- 1. 环境说明
- 2. 安装node_exporter
- 2.安装influxdb
- /etc/fstab
- Created by anaconda on Mon Jan 4 07:43:22 2021
- Accessible filesystems, by reference, are maintained under ‘/dev/disk’
- See man pages fstab(5), findfs(8), mount(8) and/or blkid(8) for more info
- 3. 安装prometheus
- 创建数据库和授权用户
- 4. 安装配置高可用和负载均衡
- 5. Alert manager高可用
- !/bin/bash
- THIS FILE IS ADDED FOR COMPATIBILITY PURPOSES
- It is highly advisable to create own systemd services or udev rules
- to run scripts during boot instead of using this file.
- In contrast to previous versions due to parallel execution during boot
- this script will NOT be run after all other services.
- Please note that you must run ‘chmod +x /etc/rc.d/rc.local’ to ensure
- that this script will be executed during boot.
1. 环境说明
2. 安装node_exporter
- 运行 ```bash /usr/sbin/node_exporter —log.level=”info” \ —web.disable-exporter-metrics \ —collector.systemd \ —collector.processes \ —collector.mountstats \ —collector.ntp.server=”10.68.3.101” \ —collector.diskstats.ignored-devices=”^(ram|loop|fd|(h|s|v|xv)d[a-z]|nvme\d+n\d+p)\d+$” \ —collector.filesystem.ignored-mount-points=”^/(dev|proc|sys|var/lib/docker/.+)($|/)” \ —collector.filesystem.ignored-fs-types=”^(autofs|binfmt_misc|bpf|cgroup2?|configfs|debugfs|devpts|devtmpfs|fusectl|hugetlbfs|mqueue|nsfs|overlay|proc|procfs|pstore|rpc_pipefs|securityfs|selinuxfs|squashfs|sysfs|tracefs)$” &
- 开机启动```bash[root@monitor1 ~]# cat /etc/rc.local#!/bin/bash# THIS FILE IS ADDED FOR COMPATIBILITY PURPOSES## It is highly advisable to create own systemd services or udev rules# to run scripts during boot instead of using this file.## In contrast to previous versions due to parallel execution during boot# this script will NOT be run after all other services.## Please note that you must run 'chmod +x /etc/rc.d/rc.local' to ensure# that this script will be executed during boot./usr/sbin/node_exporter --log.level="info" \--web.disable-exporter-metrics \--collector.systemd \--collector.processes \--collector.mountstats \--collector.ntp.server="10.68.3.101" \--collector.diskstats.ignored-devices="^(ram|loop|fd|(h|s|v|xv)d[a-z]|nvme\\d+n\\d+p)\\d+$" \--collector.filesystem.ignored-mount-points="^/(dev|proc|sys|var/lib/docker/.+)($|/)" \--collector.filesystem.ignored-fs-types="^(autofs|binfmt_misc|bpf|cgroup2?|configfs|debugfs|devpts|devtmpfs|fusectl|hugetlbfs|mqueue|nsfs|overlay|proc|procfs|pstore|rpc_pipefs|securityfs|selinuxfs|squashfs|sysfs|tracefs)$" &touch /var/lock/subsys/local
2.安装influxdb
- 安装influxdb
## 下载influxdb https://portal.influxdata.com/downloads/yum localinstall -y influxdb-1.8.0.x86_64.rpm
2.2 创建挂载ceph块存储
[root@mon1 ~]# ceph -scluster:id: 8785bb23-6770-4f83-9235-279c7d34c76fhealth: HEALTH_WARNDegraded data redundancy: 487/1527 objects degraded (31.893%), 122 pgs degradedservices:mon: 3 daemons, quorum mon1,mon2,mon3 (age 2m)mgr: mon1(active, since 3h), standbys: mon2, mon3osd: 9 osds: 9 up (since 4h), 9 in (since 4h)data:pools: 1 pools, 128 pgsobjects: 509 objects, 1.9 GiBusage: 13 GiB used, 527 GiB / 540 GiB availpgs: 487/1527 objects degraded (31.893%)120 active+recovery_wait+degraded6 active+clean2 active+recovering+degradedio:recovery: 3.3 MiB/s, 0 objects/s
创建pool
ceph osd pool create influxdata 512 512
检查
[root@mon1 ~]# ceph osd lspools22 influxdata
创建块镜像
rbd create influxdata/influx_data --size 10240 --image-feature layering## 如果不指定 pool_name/image_name 默认使用的是rbd pool
检查
[root@mon1 ~]# rbd list influxdatainflux_data[root@mon1 ~]# rbd info influxdata/influx_datarbd image 'influx_data':size 10 GiB in 2560 objectsorder 22 (4 MiB objects)snapshot_count: 0id: 1982a32f770f0block_name_prefix: rbd_data.1982a32f770f0format: 2features: layeringop_features:flags:create_timestamp: Wed Jan 6 13:28:27 2021access_timestamp: Wed Jan 6 13:28:27 2021modify_timestamp: Wed Jan 6 13:28:27 2021
创建账户和密码 ```bash ceph auth get-or-create client.influx mon ‘allow r’ osd ‘allow rwx pool=influxdata’|tee > /etc/ceph/ceph.client.influx.keyring
[root@mon1 ~]# cat /etc/ceph/ceph.client.influx.keyring [client.influx] key = AQCgTfVfogPQNBAAsisDrblyxPYNg5WKk1XzLg==
- 拷贝到客户端```bash[root@mon1 ~]# scp /etc/ceph/ceph.client.influx.keyring 10.68.3.91:/etc/ceph/
- 客户端映射快设备
```bash
yum install ceph-common -y
创建ceph.conf
[root@monitor1 ~]# cat /etc/ceph/ceph.conf [global] mon_host = 10.68.3.121,10.68.3.122,10.68.3.123
[root@monitor1 ~]# rbd map —image influxdata/influx_data —name client.influx /dev/rbd0
- 格式化挂载使用```bashmkfs.xfs /dev/rbd0mount /dev/rbd0 /var/lib/influxdb/[root@monitor1 ~]# df -hFilesystem Size Used Avail Use% Mounted ondevtmpfs 899M 0 899M 0% /devtmpfs 910M 0 910M 0% /dev/shmtmpfs 910M 33M 878M 4% /runtmpfs 910M 0 910M 0% /sys/fs/cgroup/dev/mapper/centos-root 14G 2.2G 12G 17% //dev/sda1 1014M 149M 866M 15% /boottmpfs 182M 0 182M 0% /run/user/0/dev/rbd0 10G 33M 10G 1% /var/lib/influxdb
- 开机挂载 ```bash
[root@monitor1 ~]# cat /etc/fstab
#
/etc/fstab
Created by anaconda on Mon Jan 4 07:43:22 2021
#
Accessible filesystems, by reference, are maintained under ‘/dev/disk’
See man pages fstab(5), findfs(8), mount(8) and/or blkid(8) for more info
# /dev/mapper/centos-root / xfs defaults 0 0 UUID=68c4209c-d479-4804-ac96-406a547d6168 /boot xfs defaults 0 0 /dev/mapper/centos-swap swap swap defaults 0 0 /dev/rbd0 /var/lib/influxdb xfs defaults 0 0
<a name="bRTk4"></a>## 2.3 启动influxdb- 修改配置文件```bashbind-address = "0.0.0.0:8088"
systemctl enable influxdbsystemctl start influxdb
3. 安装prometheus
3.1 influxdb创建表
[root@monitor1 lib]# influxConnected to http://localhost:8086 version 1.8.3InfluxDB shell version: 1.8.3> create database prometheus;> create user icinga2 with password 'password';> grant all on prometheus to icinga2;ERR: user not foundWarning: It is possible this error is due to not setting a database.Please set a database with the command "use <database>".> use prometheus;Using database prometheus> grant all on prometheus to icinga2;ERR: user not found> show retention policies on prometheus;name duration shardGroupDuration replicaN default---- -------- ------------------ -------- -------autogen 0s 168h0m0s 1 true> quit
创建数据库和用户: create database prometheus create user “admin” with password ‘Admin123’ with all privileges use prometheus
show measurements name: measurements
name
scrape_duration_seconds scrape_samples_post_metric_relabeling scrape_samples_scraped scrape_series_added up ```
3.2 安装promethues
- 配置分片节点的prometheus ```bash tar xvf prometheus-2.13.1.linux-amd64.tar.gz [root@monitor1 ~]# cp prometheus-2.13.1.linux-amd64/prometheus /usr/sbin/ [root@monitor1 ~]# cp prometheus-2.13.1.linux-amd64/promtool /usr/sbin/ [root@monitor1 ~]# cp prometheus-2.13.1.linux-amd64/prometheus.yml /etc/
分发文件到其他服务器
[root@monitor1 ~]# scp /usr/sbin/prometheus monitor2:/usr/sbin/ prometheus 100% 75MB 9.4MB/s 00:08 [root@monitor1 ~]# scp /usr/sbin/prometheus monitor3:/usr/sbin/ prometheus
- 配置promethues文件```bash[root@monitor1 ~]# cat /etc/prometheus.yml |egrep -v '\#|^$'global:alerting:alertmanagers:- static_configs:- targets:rule_files:scrape_configs:- job_name: 'prometheus'static_configs:- targets: ['10.68.3.91:9100'] # 监控的主机labels:hostname: monitor1## 分发到其他主机[root@monitor1 ~]# scp /etc/prometheus.yml monitor2:/etc/prometheus.yml 100% 925 42.1KB/s 00:00^C[root@monitor1 ~]# scp /etc/prometheus.yml monitor3:/etc/prometheus.yml
启动服务
[root@monitor1 ~]#/usr/sbin/prometheus --config.file=/etc/prometheus.yml \--log.level=info \--storage.tsdb.path=/var/lib/data/ \--web.enable-admin-api \--web.enable-lifecycle \--web.listen-address="0.0.0.0:9090" &
开机启动 ```bash [root@monitor1 ~]# cat /etc/rc.local /usr/sbin/prometheus —config.file=/etc/prometheus.yml \ —log.level=info \ —storage.tsdb.path=/var/lib/data/ \ —web.enable-admin-api \ —web.enable-lifecycle \ —web.listen-address=”0.0.0.0:9090” &
分发到各节点
[root@monitor1 ~]# scp /etc/rc.local monitor2:/etc/ [root@monitor1 ~]# scp /etc/rc.local monitor3:/etc/
<a name="8fpG0"></a>## 3.3 安装primary节点- 配置文件```bash[root@monitor1 etc]# cat prometheus-primary.yml |egrep -v '#|^$'global:alerting:alertmanagers:- static_configs:- targets:remote_write:- url: "http://10.68.3.91:8086/api/v1/prom/write?db=prometheus"basic_auth:username: adminpassword: Admin123remote_read:- url: "http://10.68.3.93:8086/api/v1/prom/read?db=prometheus"basic_auth:username: adminpassword: Admin123rule_files:scrape_configs:- job_name: 'prometheus-primary'honor_labels: truemetrics_path: '/federate'params:'match[]':- ^'{job=~"promethues*"}'static_configs:- targets:- 'monitor1:9090'- 'monitor2:9090'- 'monitor3:9090'
其中,db替换为实际创建的数据库名称,username和password需要替换为上一步influxdb中创建的账密信息。 修改完成后并重启prometheus,服务正常后,influxdb中就会有相应的数据了,实现了数据的持久化。
启动服务
[root@monitor1 opt]# prometheus --config.file=/etc/prometheus-primary.yml \--log.level=info --web.enable-admin-api --web.enable-lifecycle \--web.listen-address="0.0.0.0:8080" &
检查验证
浏览器打开: http://10.68.3.91:8080/targets
同理创建其他三个prometheus-primary节点
[root@monitor1 ~]# scp /etc/prometheus-primary.yml monitor2:/etc/prometheus-primary.yml 100% 1443 59.5KB/s 00:00[root@monitor1 ~]# scp /etc/prometheus-primary.yml monitor3:/etc/prometheus-primary.yml
启动
[root@monitor1 ~]# scp /etc/rc.local monitor2:/etc/rc.local 100% 1433 59.1KB/s 00:00[root@monitor1 ~]# scp /etc/rc.local monitor3:/etc/rc.local
验证
http://10.68.3.92:8080/targets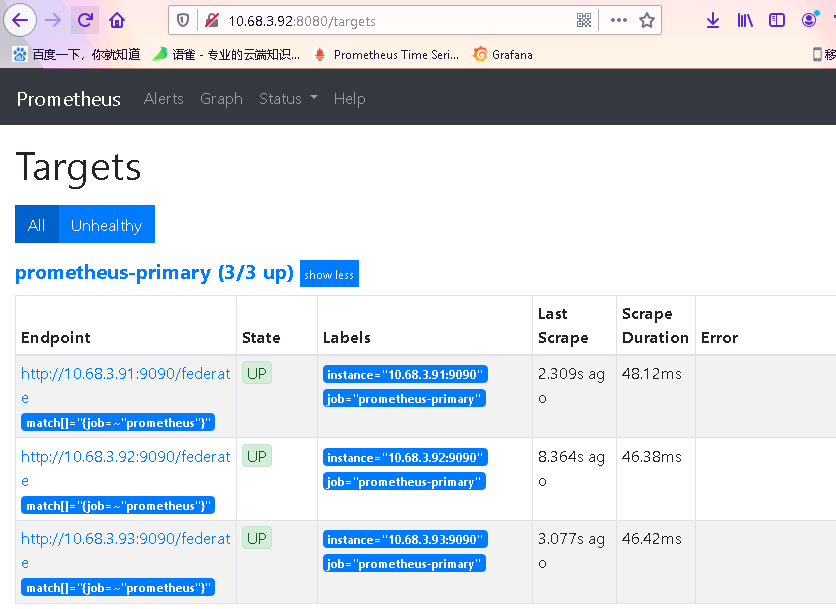
http://10.68.3.93:8080/targets
- 检查influxdb的数据
[root@monitor1 ~]# influxConnected to http://localhost:8086 version 1.8.3InfluxDB shell version: 1.8.3>> use prometheusUsing database prometheus> show series ##可以看到收集到的数据> show measurements
4. 安装配置高可用和负载均衡
4.1 安装keepalived
安装
yum install keepalived -y
MASTER[3.91]配置文件 ```bash [root@monitor1 keepalived]# cat /etc/keepalived/keepalived.conf ! Configuration File for keepalived
global_defs { router_id monitor1 vrrp_skip_check_adv_addr vrrp_strict vrrp_garp_interval 0 vrrp_gna_interval 0 } vrrp_script check_nginx { script “/etc/keepalived/nginx_check.sh” interval 2 weight -20 }
vrrp_instance VI_1 { state MASTER interface ens32 virtual_router_id 51 priority 100 advert_int 1 authentication { auth_type PASS auth_pass 1111 } virtual_ipaddress { 10.68.3.90 } }
- BACKUP1 节点[3.92]配置文件```bash[root@monitor2 ~]# cat /etc/keepalived/keepalived.conf! Configuration File for keepalivedglobal_defs {router_id monitor2vrrp_skip_check_adv_addrvrrp_strictvrrp_garp_interval 0vrrp_gna_interval 0}vrrp_script check_nginx {script "/etc/keepalived/nginx_check.sh"interval 2weight -20}vrrp_instance VI_1 {state MASTERinterface ens32mcast_src_ip 10.68.3.92virtual_router_id 51priority 99advert_int 1authentication {auth_type PASSauth_pass 1111}virtual_ipaddress {10.68.3.90}}
- BACKUP1 节点[3.93]配置文件 ```bash [root@monitor3 ~]# cat /etc/keepalived/keepalived.conf ! Configuration File for keepalived
global_defs { router_id monitor3 vrrp_skip_check_adv_addr vrrp_garp_interval 0 vrrp_gna_interval 0 } vrrp_script check_nginx { script “/etc/keepalived/nginx_check.sh” interval 2 weight -20 }
vrrp_instance VI_1 { state MASTER interface ens32 mcast_src_ip 10.68.3.93 virtual_router_id 51 priority 98 advert_int 1 authentication { auth_type PASS auth_pass 1111 } virtual_ipaddress { 10.68.3.90 } }
- 启动服务```bash[root@monitor1 keepalived]# systemctl start keepalived[root@monitor1 keepalived]# systemctl enable keepalived
- 验证
```bash
master节点
[root@monitor1 keepalived]# ip addr|grep inet inet 127.0.0.1/8 scope host lo inet6 ::1/128 scope host inet 10.68.3.91/24 brd 10.68.3.255 scope global noprefixroute ens32 inet 10.68.3.90/32 scope global ens32 inet6 fe80::150f:2e53:9bd0:a01b/64 scope link noprefixroute
- 测试```bash## 关闭master到keepalived 服务,检查vip有没有漂移到backup节点
5. Alert manager高可用
5.1 二进制包
- 下载二进制包
```bash cp alertmanager-0.20.0.linux-amd64/alertmanager /usr/sbin/ cp alertmanager-0.20.0.linux-amd64/alertmanager.yml /etc/
scp alertmanager-0.20.0.linux-amd64/alertmanager monitor2:/usr/sbin/ scp alertmanager-0.20.0.linux-amd64/alertmanager monitor3:/usr/sbin/
scp /etc/alertmanager.yml monitor2:/etc/ scp /etc/alertmanager.yml monitor3:/etc/
<a name="6BTWs"></a>## 5.2 启动服务```bash## monitor1/usr/sbin/alertmanager \--config.file /etc/alertmanager.yml \--web.listen-address="10.68.3.91:8194" \--log.level=debug \--data.retention=120h \--cluster.listen-address="10.68.3.91:6129" > /var/log/alert_manager.log &## monitor2/usr/sbin/alertmanager \--config.file /etc/alertmanager.yml \--web.listen-address="10.68.3.92:8194" \--log.level=debug \--data.retention=120h \--cluster.peer="10.68.3.91:6129" \--cluster.listen-address="10.68.3.92:6129" 2>&1 > /var/log/alert_manager.log &## monitor3/usr/sbin/alertmanager \--config.file /etc/alertmanager.yml \--web.listen-address="10.68.3.93:8194" \--log.level=debug \--data.retention=120h \--cluster.peer="10.68.3.91:6129" \--cluster.listen-address="10.68.3.93:6129" 2>&1 > /var/log/alert_manager.log &
- 开机启动
```bash
monitor1
[root@monitor1 ~]# cat /etc/rc.local!/bin/bash
THIS FILE IS ADDED FOR COMPATIBILITY PURPOSES
#It is highly advisable to create own systemd services or udev rules
to run scripts during boot instead of using this file.
#In contrast to previous versions due to parallel execution during boot
this script will NOT be run after all other services.
#Please note that you must run ‘chmod +x /etc/rc.d/rc.local’ to ensure
that this script will be executed during boot.
/usr/sbin/node_exporter —log.level=”info” \ —web.disable-exporter-metrics \ —collector.systemd \ —collector.processes \ —collector.mountstats \ —collector.ntp.server=”10.68.3.101” \ —collector.diskstats.ignored-devices=”^(ram|loop|fd|(h|s|v|xv)d[a-z]|nvme\d+n\d+p)\d+$” \ —collector.filesystem.ignored-mount-points=”^/(dev|proc|sys|var/lib/docker/.+)($|/)” \ —collector.filesystem.ignored-fs-types=”^(autofs|binfmt_misc|bpf|cgroup2?|configfs|debugfs|devpts|devtmpfs|fusectl|hugetlbfs|mqueue|nsfs|overlay|proc|procfs|pstore|rpc_pipefs|securityfs|selinuxfs|squashfs|sysfs|tracefs)$” &
/usr/sbin/prometheus —config.file=/etc/prometheus.yml \ —log.level=info \ —storage.tsdb.path=/var/lib/data/ \ —web.enable-admin-api \ —web.enable-lifecycle \ —web.listen-address=”0.0.0.0:9090” &
prometheus —config.file=/etc/prometheus-primary.yml —log.level=info —web.enable-admin-api —web.enable-lifecycle —web.listen-address=”0.0.0.0:8080” &
/usr/sbin/alertmanager \ —config.file /etc/alertmanager.yml \ —web.listen-address=”10.68.3.91:8194” \ —log.level=debug \ —data.retention=120h \ —cluster.listen-address=”10.68.3.91:6129” > /var/log/alert_manager.log &
touch /var/lock/subsys/local
monitor2
cat /etc/rc.local
!/bin/bash
THIS FILE IS ADDED FOR COMPATIBILITY PURPOSES
#
It is highly advisable to create own systemd services or udev rules
to run scripts during boot instead of using this file.
#
In contrast to previous versions due to parallel execution during boot
this script will NOT be run after all other services.
#
Please note that you must run ‘chmod +x /etc/rc.d/rc.local’ to ensure
that this script will be executed during boot.
/usr/sbin/node_exporter —log.level=”info” \ —web.disable-exporter-metrics \ —collector.systemd \ —collector.processes \ —collector.mountstats \ —collector.ntp.server=”10.68.3.101” \ —collector.diskstats.ignored-devices=”^(ram|loop|fd|(h|s|v|xv)d[a-z]|nvme\d+n\d+p)\d+$” \ —collector.filesystem.ignored-mount-points=”^/(dev|proc|sys|var/lib/docker/.+)($|/)” \ —collector.filesystem.ignored-fs-types=”^(autofs|binfmt_misc|bpf|cgroup2?|configfs|debugfs|devpts|devtmpfs|fusectl|hugetlbfs|mqueue|nsfs|overlay|proc|procfs|pstore|rpc_pipefs|securityfs|selinuxfs|squashfs|sysfs|tracefs)$” &
/usr/sbin/prometheus —config.file=/etc/prometheus.yml \ —log.level=info \ —storage.tsdb.path=/var/lib/data/ \ —web.enable-admin-api \ —web.enable-lifecycle \ —web.listen-address=”0.0.0.0:9090” &
/usr/sbin/prometheus —config.file=/etc/prometheus-primary.yml —log.level=info —web.enable-admin-api —web.enable-lifecycle —web.listen-address=”0.0.0.0:8080” &
/usr/sbin/alertmanager \ —config.file /etc/alertmanager.yml \ —web.listen-address=”10.68.3.92:8194” \ —log.level=debug \ —data.retention=120h \ —cluster.peer=”10.68.3.91:6129” \ —cluster.listen-address=”10.68.3.92:6129” 2>&1 > /var/log/alert_manager.log &
touch /var/lock/subsys/local
monitor3
cat /etc/rc.local
!/bin/bash
THIS FILE IS ADDED FOR COMPATIBILITY PURPOSES
#
It is highly advisable to create own systemd services or udev rules
to run scripts during boot instead of using this file.
#
In contrast to previous versions due to parallel execution during boot
this script will NOT be run after all other services.
#
Please note that you must run ‘chmod +x /etc/rc.d/rc.local’ to ensure
that this script will be executed during boot.
/usr/sbin/node_exporter —log.level=”info” \ —web.disable-exporter-metrics \ —collector.systemd \ —collector.processes \ —collector.mountstats \ —collector.ntp.server=”10.68.3.101” \ —collector.diskstats.ignored-devices=”^(ram|loop|fd|(h|s|v|xv)d[a-z]|nvme\d+n\d+p)\d+$” \ —collector.filesystem.ignored-mount-points=”^/(dev|proc|sys|var/lib/docker/.+)($|/)” \ —collector.filesystem.ignored-fs-types=”^(autofs|binfmt_misc|bpf|cgroup2?|configfs|debugfs|devpts|devtmpfs|fusectl|hugetlbfs|mqueue|nsfs|overlay|proc|procfs|pstore|rpc_pipefs|securityfs|selinuxfs|squashfs|sysfs|tracefs)$” &
/usr/sbin/prometheus —config.file=/etc/prometheus.yml \ —log.level=info \ —storage.tsdb.path=/var/lib/data/ \ —web.enable-admin-api \ —web.enable-lifecycle \ —web.listen-address=”0.0.0.0:9090” &
prometheus —config.file=/etc/prometheus-primary.yml —log.level=info —web.enable-admin-api —web.enable-lifecycle —web.listen-address=”0.0.0.0:8080” &
/usr/sbin/alertmanager \ —config.file /etc/alertmanager.yml \ —web.listen-address=”10.68.3.93:8194” \ —log.level=debug \ —data.retention=120h \ —cluster.peer=”10.68.3.91:6129” \ —cluster.listen-address=”10.68.3.93:6129” 2>&1 > /var/log/alert_manager.log &
touch /var/lock/subsys/local
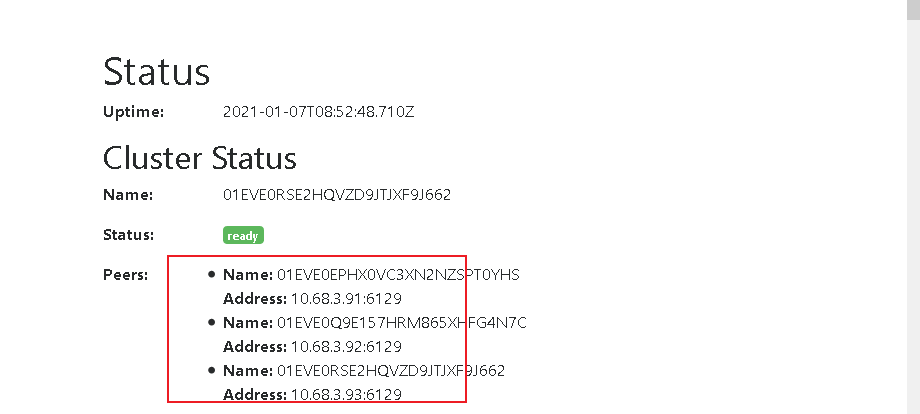
5.3 检查验证
http://10.68.3.93:8194/#/status
http://10.68.3.92:8194/#/status
http://10.68.3.91:8194/#/status

若有收获,就点个赞吧
0 人点赞
