前提
因为前面我在测试148服务器已经相继部署了elasticsearch:6.8.6和kinba:6.8.6,所以这里只需要部署fluentd就行了。但是我的fluentd是通过k8s部署,当稳定性测试通过后,我会将docker-compose部署的es和kinba会迁移到k8上,下面我将通过我自身踩过的坑来安装下Fluentd来实现日志的搜集。
下载对应配置文件
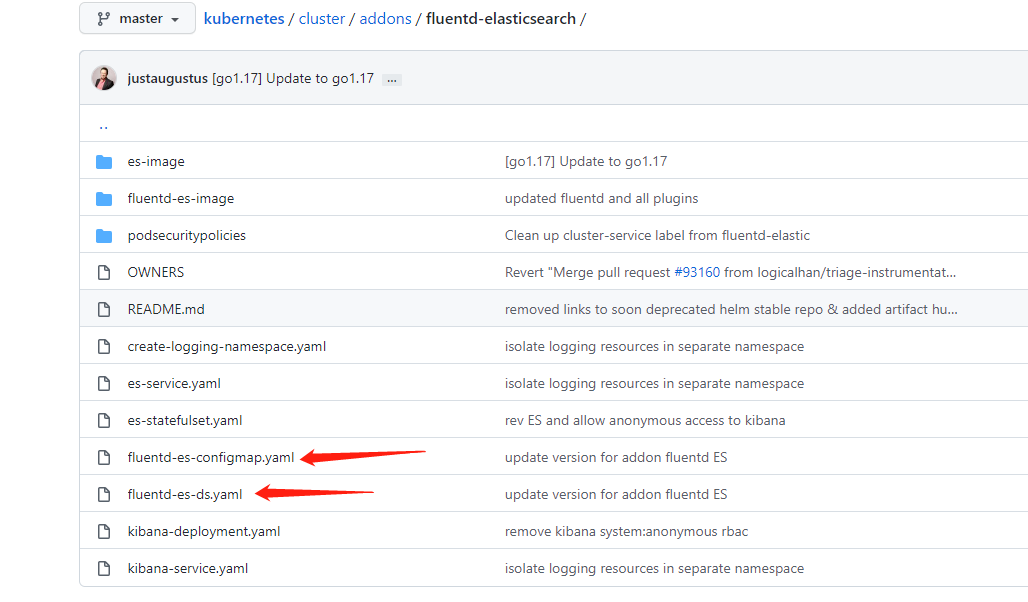
可以从官方提供的下载地址去获取对应k8配置文件:地址,我先把它列出来以此做备份,当然你前提是需要先创建对应的namespace: logging
ConfigMap
kind: ConfigMapapiVersion: v1metadata:name: fluentd-es-config-v0.2.1namespace: logginglabels:addonmanager.kubernetes.io/mode: Reconciledata:system.conf: |-<system>root_dir /tmp/fluentd-buffers/</system>containers.input.conf: |-<source>@id fluentd-containers.log@type tailpath /var/log/containers/*.logpos_file /var/log/es-containers.log.postag raw.kubernetes.*read_from_head true<parse>@type multi_format<pattern>format jsontime_key timetime_format %Y-%m-%dT%H:%M:%S.%NZ</pattern><pattern>format /^(?<time>.+) (?<stream>stdout|stderr) [^ ]* (?<log>.*)$/time_format %Y-%m-%dT%H:%M:%S.%N%:z</pattern></parse></source># Detect exceptions in the log output and forward them as one log entry.<match raw.kubernetes.**>@id raw.kubernetes@type detect_exceptionsremove_tag_prefix rawmessage logstream streammultiline_flush_interval 5max_bytes 500000max_lines 1000</match># Concatenate multi-line logs<filter **>@id filter_concat@type concatkey messagemultiline_end_regexp /\n$/separator ""</filter># Enriches records with Kubernetes metadata<filter kubernetes.**>@id filter_kubernetes_metadata@type kubernetes_metadata</filter># Fixes json fields in Elasticsearch<filter kubernetes.**>@id filter_parser@type parserkey_name logreserve_data trueremove_key_name_field true<parse>@type multi_format<pattern>format json</pattern><pattern>format none</pattern></parse></filter>system.input.conf: |-<source>@id minion@type tailformat /^(?<time>[^ ]* [^ ,]*)[^\[]*\[[^\]]*\]\[(?<severity>[^ \]]*) *\] (?<message>.*)$/time_format %Y-%m-%d %H:%M:%Spath /var/log/salt/minionpos_file /var/log/salt.postag salt</source><source>@id startupscript.log@type tailformat syslogpath /var/log/startupscript.logpos_file /var/log/es-startupscript.log.postag startupscript</source><source>@id docker.log@type tailformat /^time="(?<time>[^"]*)" level=(?<severity>[^ ]*) msg="(?<message>[^"]*)"( err="(?<error>[^"]*)")?( statusCode=($<status_code>\d+))?/path /var/log/docker.logpos_file /var/log/es-docker.log.postag docker</source><source>@id etcd.log@type tail# Not parsing this, because it doesn't have anything particularly useful to# parse out of it (like severities).format nonepath /var/log/etcd.logpos_file /var/log/es-etcd.log.postag etcd</source><source>@id kubelet.log@type tailformat multilinemultiline_flush_interval 5sformat_firstline /^\w\d{4}/format1 /^(?<severity>\w)(?<time>\d{4} [^\s]*)\s+(?<pid>\d+)\s+(?<source>[^ \]]+)\] (?<message>.*)/time_format %m%d %H:%M:%S.%Npath /var/log/kubelet.logpos_file /var/log/es-kubelet.log.postag kubelet</source><source>@id kube-proxy.log@type tailformat multilinemultiline_flush_interval 5sformat_firstline /^\w\d{4}/format1 /^(?<severity>\w)(?<time>\d{4} [^\s]*)\s+(?<pid>\d+)\s+(?<source>[^ \]]+)\] (?<message>.*)/time_format %m%d %H:%M:%S.%Npath /var/log/kube-proxy.logpos_file /var/log/es-kube-proxy.log.postag kube-proxy</source><source>@id kube-apiserver.log@type tailformat multilinemultiline_flush_interval 5sformat_firstline /^\w\d{4}/format1 /^(?<severity>\w)(?<time>\d{4} [^\s]*)\s+(?<pid>\d+)\s+(?<source>[^ \]]+)\] (?<message>.*)/time_format %m%d %H:%M:%S.%Npath /var/log/kube-apiserver.logpos_file /var/log/es-kube-apiserver.log.postag kube-apiserver</source><source>@id kube-controller-manager.log@type tailformat multilinemultiline_flush_interval 5sformat_firstline /^\w\d{4}/format1 /^(?<severity>\w)(?<time>\d{4} [^\s]*)\s+(?<pid>\d+)\s+(?<source>[^ \]]+)\] (?<message>.*)/time_format %m%d %H:%M:%S.%Npath /var/log/kube-controller-manager.logpos_file /var/log/es-kube-controller-manager.log.postag kube-controller-manager</source><source>@id kube-scheduler.log@type tailformat multilinemultiline_flush_interval 5sformat_firstline /^\w\d{4}/format1 /^(?<severity>\w)(?<time>\d{4} [^\s]*)\s+(?<pid>\d+)\s+(?<source>[^ \]]+)\] (?<message>.*)/time_format %m%d %H:%M:%S.%Npath /var/log/kube-scheduler.logpos_file /var/log/es-kube-scheduler.log.postag kube-scheduler</source><source>@id glbc.log@type tailformat multilinemultiline_flush_interval 5sformat_firstline /^\w\d{4}/format1 /^(?<severity>\w)(?<time>\d{4} [^\s]*)\s+(?<pid>\d+)\s+(?<source>[^ \]]+)\] (?<message>.*)/time_format %m%d %H:%M:%S.%Npath /var/log/glbc.logpos_file /var/log/es-glbc.log.postag glbc</source><source>@id cluster-autoscaler.log@type tailformat multilinemultiline_flush_interval 5sformat_firstline /^\w\d{4}/format1 /^(?<severity>\w)(?<time>\d{4} [^\s]*)\s+(?<pid>\d+)\s+(?<source>[^ \]]+)\] (?<message>.*)/time_format %m%d %H:%M:%S.%Npath /var/log/cluster-autoscaler.logpos_file /var/log/es-cluster-autoscaler.log.postag cluster-autoscaler</source><source>@id journald-docker@type systemdmatches [{ "_SYSTEMD_UNIT": "docker.service" }]<storage>@type localpersistent truepath /var/log/journald-docker.pos</storage>read_from_head truetag docker</source><source>@id journald-container-runtime@type systemdmatches [{ "_SYSTEMD_UNIT": "{{ fluentd_container_runtime_service }}.service" }]<storage>@type localpersistent truepath /var/log/journald-container-runtime.pos</storage>read_from_head truetag container-runtime</source><source>@id journald-kubelet@type systemdmatches [{ "_SYSTEMD_UNIT": "kubelet.service" }]<storage>@type localpersistent truepath /var/log/journald-kubelet.pos</storage>read_from_head truetag kubelet</source><source>@id journald-node-problem-detector@type systemdmatches [{ "_SYSTEMD_UNIT": "node-problem-detector.service" }]<storage>@type localpersistent truepath /var/log/journald-node-problem-detector.pos</storage>read_from_head truetag node-problem-detector</source><source>@id kernel@type systemdmatches [{ "_TRANSPORT": "kernel" }]<storage>@type localpersistent truepath /var/log/kernel.pos</storage><entry>fields_strip_underscores truefields_lowercase true</entry>read_from_head truetag kernel</source>forward.input.conf: |-# Takes the messages sent over TCP<source>@id forward@type forward</source>monitoring.conf: |-# Prometheus Exporter Plugin# input plugin that exports metrics<source>@id prometheus@type prometheus</source><source>@id monitor_agent@type monitor_agent</source># input plugin that collects metrics from MonitorAgent<source>@id prometheus_monitor@type prometheus_monitor<labels>host ${hostname}</labels></source># input plugin that collects metrics for output plugin<source>@id prometheus_output_monitor@type prometheus_output_monitor<labels>host ${hostname}</labels></source># input plugin that collects metrics for in_tail plugin<source>@id prometheus_tail_monitor@type prometheus_tail_monitor<labels>host ${hostname}</labels></source>output.conf: |-<match **>@id elasticsearch@type elasticsearch@log_level infotype_name _docinclude_tag_key truehost elasticsearch-logging #这个可以填写我们自身148服务器es所在ip 192.168.1.148port 9200logstash_format true<buffer>@type filepath /var/log/fluentd-buffers/kubernetes.system.bufferflush_mode intervalretry_type exponential_backoffflush_thread_count 2flush_interval 5sretry_foreverretry_max_interval 30chunk_limit_size 2Mtotal_limit_size 500Moverflow_action block</buffer></match>
DaemonSet + rbac
apiVersion: v1kind: ServiceAccountmetadata:name: fluentd-esnamespace: logginglabels:k8s-app: fluentd-esaddonmanager.kubernetes.io/mode: Reconcile---kind: ClusterRoleapiVersion: rbac.authorization.k8s.io/v1metadata:name: fluentd-eslabels:k8s-app: fluentd-esaddonmanager.kubernetes.io/mode: Reconcilerules:- apiGroups:- ""resources:- "namespaces"- "pods"verbs:- "get"- "watch"- "list"---kind: ClusterRoleBindingapiVersion: rbac.authorization.k8s.io/v1metadata:name: fluentd-eslabels:k8s-app: fluentd-esaddonmanager.kubernetes.io/mode: Reconcilesubjects:- kind: ServiceAccountname: fluentd-esnamespace: loggingapiGroup: ""roleRef:kind: ClusterRolename: fluentd-esapiGroup: ""---apiVersion: apps/v1kind: DaemonSetmetadata:name: fluentd-es-v3.1.1namespace: logginglabels:k8s-app: fluentd-esversion: v3.1.1addonmanager.kubernetes.io/mode: Reconcilespec:selector:matchLabels:k8s-app: fluentd-esversion: v3.1.1template:metadata:labels:k8s-app: fluentd-esversion: v3.1.1spec:securityContext:seccompProfile:type: RuntimeDefaultpriorityClassName: system-node-criticalserviceAccountName: fluentd-escontainers:- name: fluentd-esimage: quay.io/fluentd_elasticsearch/fluentd:v3.1.0env:- name: FLUENTD_ARGSvalue: --no-supervisor -qresources:limits:memory: 500Mirequests:cpu: 100mmemory: 200MivolumeMounts:- name: varlogmountPath: /var/log- name: varlibdockercontainersmountPath: /var/lib/docker/containersreadOnly: true- name: config-volumemountPath: /etc/fluent/config.dports:- containerPort: 24231name: prometheusprotocol: TCPlivenessProbe:tcpSocket:port: prometheusinitialDelaySeconds: 5timeoutSeconds: 10readinessProbe:tcpSocket:port: prometheusinitialDelaySeconds: 5timeoutSeconds: 10terminationGracePeriodSeconds: 30volumes:- name: varloghostPath:path: /var/log #这个路径不要填写自身定义的宿主机路径- name: varlibdockercontainershostPath:path: /var/lib/docker/containers #这个路径不要填写自身定义的宿主机路径- name: config-volumeconfigMap:name: fluentd-es-config-v0.2.1
需要注意的就是其中ConfigMap里面的es host需要填写es宿主机所在的ip,由于我们elasticsearch是部署在kubernetes外面,想让内部服务访问elasticsearch还需要简单配置一下。添加一个elasticsearch的endpoints让service能够找到我们的elasticsearch服务。只需要执行下面的两个文件即可。
其次需要注意的就是我们挂在每个节点机器的hostpath必须是对应地址,否则也无法收集对应日志
创建es的终端Endpoints
kind: EndpointsapiVersion: v1metadata:name: elasticsearch-loggingnamespace: logginglabels:k8s-app: elasticsearch-loggingkubernetes.io/name: "Elasticsearch"subsets:- addresses:- ip: 192.168.1.148ports:- port: 9200
apiVersion: v1kind: Servicemetadata:name: elasticsearch-loggingnamespace: logginglabels:k8s-app: elasticsearch-loggingaddonmanager.kubernetes.io/mode: Reconcilekubernetes.io/name: "Elasticsearch"spec:ports:- port: 9200protocol: TCPtargetPort: dbclusterIP: None
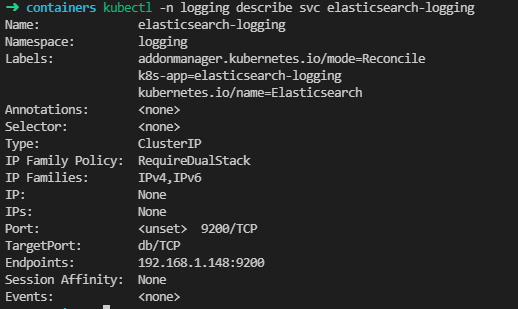
检查service能否找到endpoints
➜ kubectl -n logging describe svc elasticsearch-logging
执行上面文件之后,我们就会在每个节点机器上起对应的pod去监听宿主机下/var/log/containers 对应各个pod的日志信息了,然后将日志发送到我们的es上进行存储,也是为我们后面通过kinba分析做铺垫。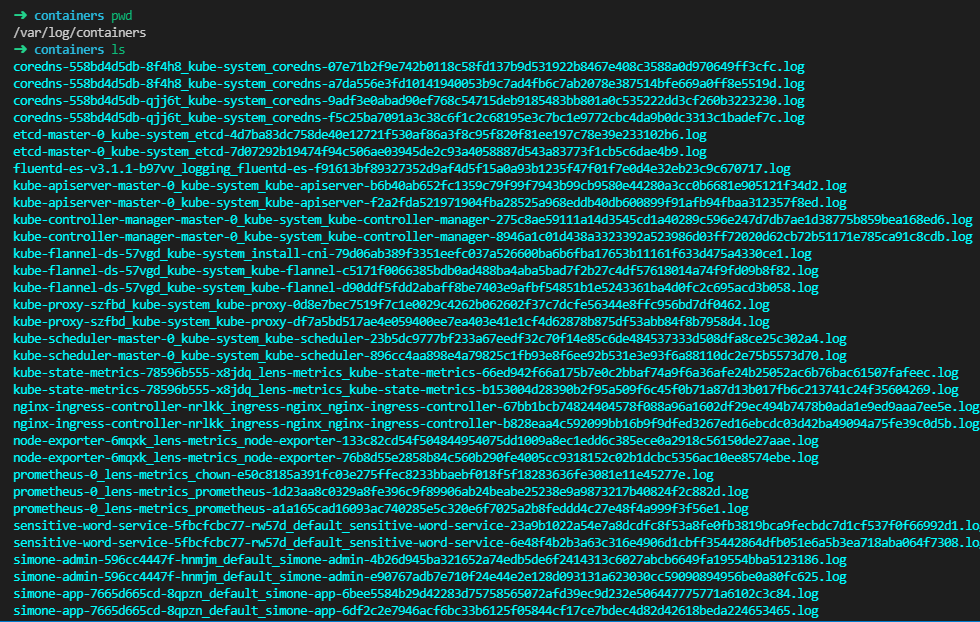
完成日志索引
查看创建的索引文件
从下图可以看出我们近期两日的文件已经被索引进去了,而且是通过logstash格式。接下来我们要通过kinba中的左侧的管理菜单创建对应的索引模式。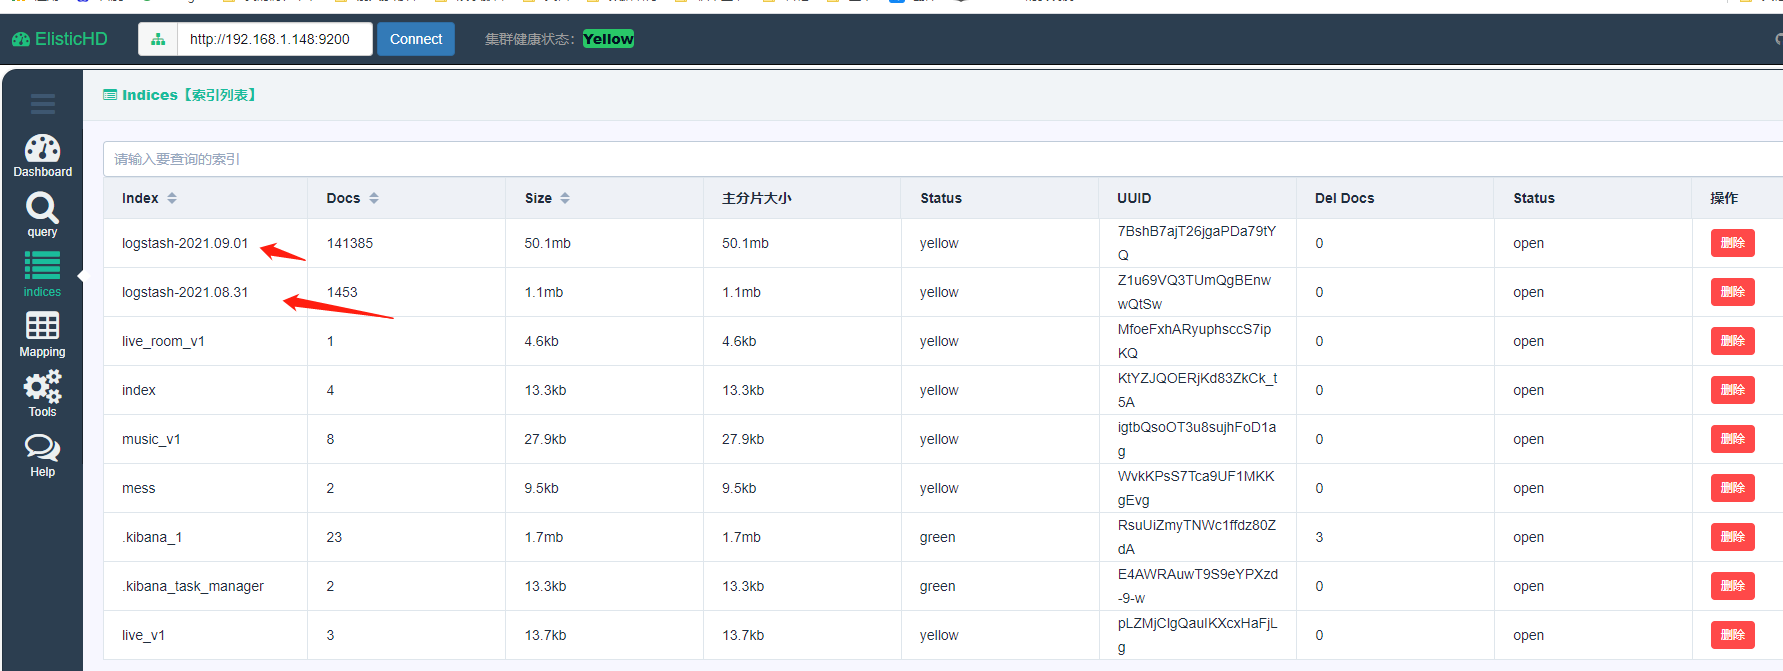
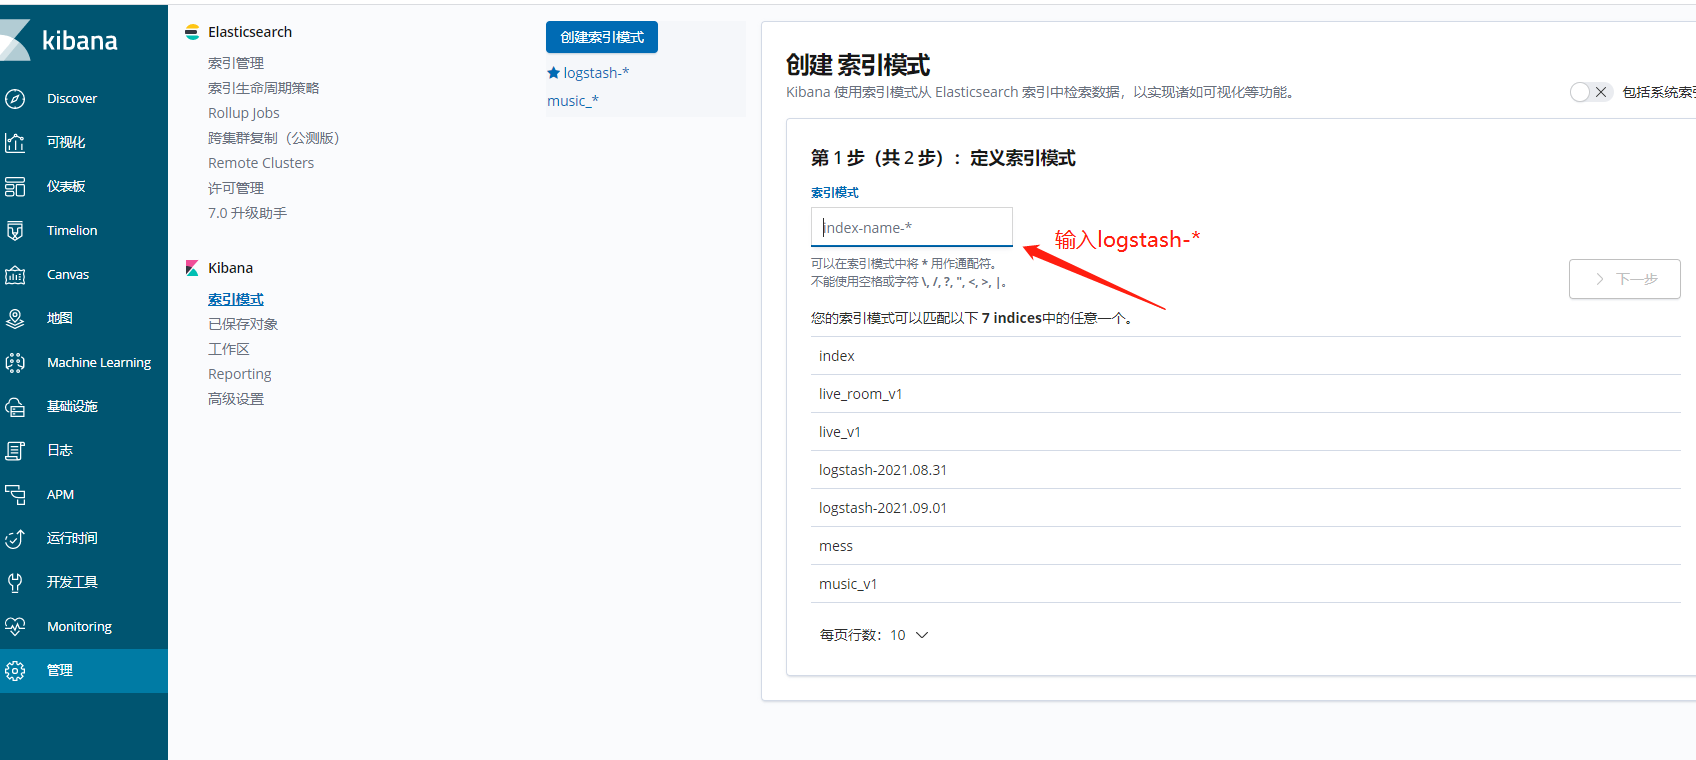
创建索引模式
在创建索引模式也遇到了坑,然后点击确定界面一直打转阻塞,查看网页network显示报错error forbidden,从日志中可以看出索引仅有 只读权限,状态码为 403;,上网上查了一下说当es发现你的磁盘占用超过85%后就会产生此错误,让你的索引变为只读模式,但是我磁盘是正常的。后面通过在es宿主机上执行一行命令修改下全局的索引状态后便ok了。
➜ curl -XPUT -H "Content-Type: application/json" http://127.0.0.1:9200/_all/_settings -d '{"index.blocks.read_only_allow_delete": null}'{"acknowledged":true}%
查看日志
在我们的kinba上左侧第一个discove,里面的玩法很多,我这里就不一一举例了。ok至此完成服务器日志统一收集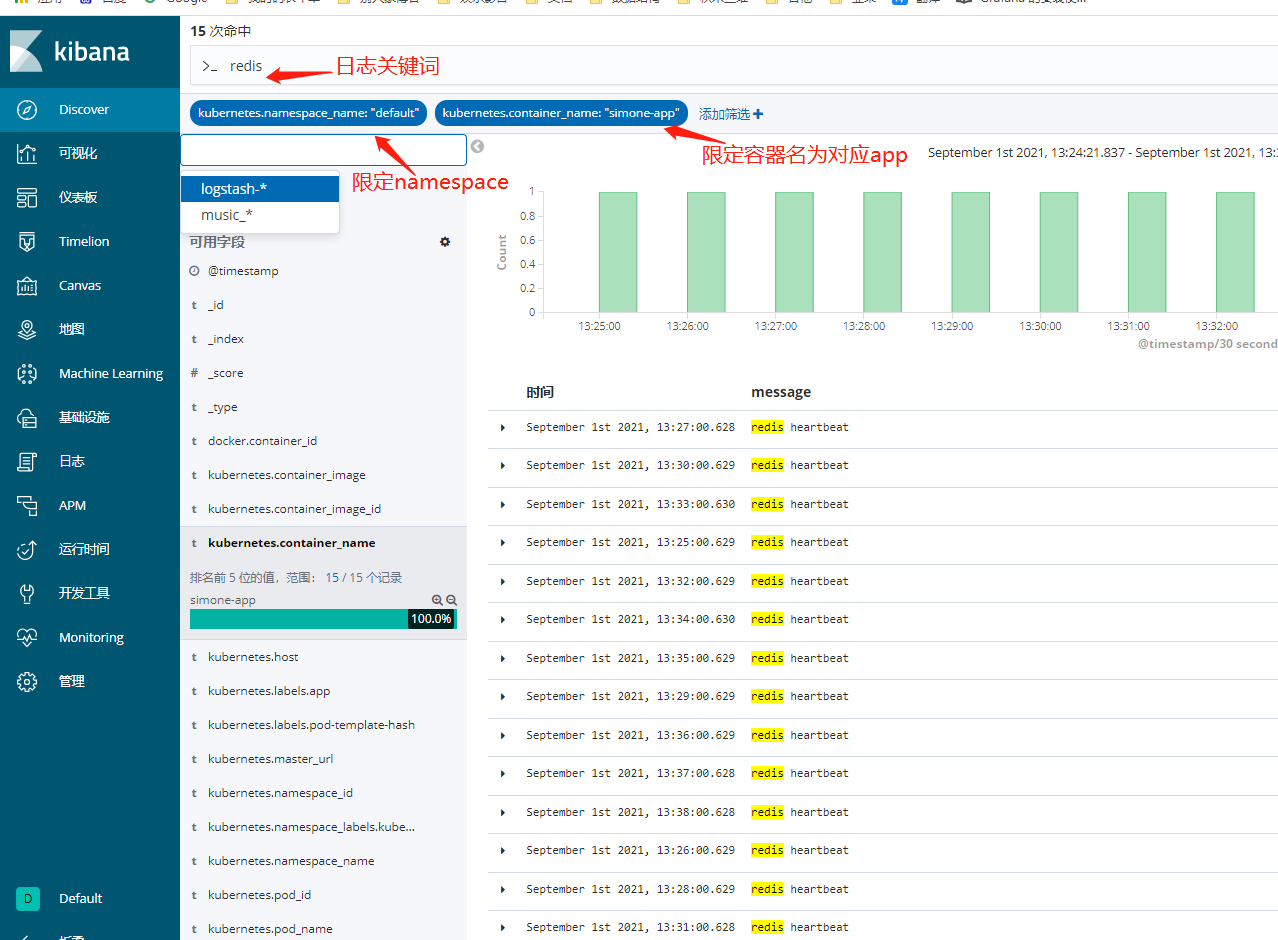
参考:文章地址

若有收获,就点个赞吧
0 人点赞
