两样本t检验
两样本t检验用于检验两个总体的均值是否相等。两总体都是未知的,且我们不想或不易测量出总体中所有的个体,来求得总体均值进行比较。所以我们从总体中随机抽样得到样本。对两样本进行统计检验,来看两样本是否存统计学差异。
案例
- 若我们想知道两个不同物种的乌龟的平均重量是否相等。我们可以进行随机抽样选择部分乌龟来代表总体乌龟。由于存在误差,两个物种样本的平均重量是存在差异的。而我们可以通过
two sample t-test知道它们之间的差异是否显著。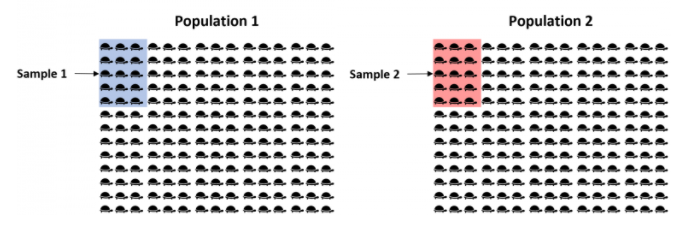
前提假设
为使two sample t-test结果有效,需要满足一些条件。
- 两总体相互独立
- 两总体均服从正太分布,且两总体方差相等
- 样本应是从总体随机抽样而来
假设检验步骤
- 确定零假设:
 , 假设两总体均值相等
- 确定备择假设,这里有3种假设方法,根据实际问题进行假设:
 , 双侧检验,两总体均值不相等
 , 单侧检验,总体均值
 小于
小于
 , 单侧检验,总体均值大于
- 计算检验统计量
 :
:

其中:
 : 样本均数
  :样本大小
:样本大小 :合并标准差
 :样本方差
:样本方差
- 计算p-_value:
选择一个显著性水准 ,一般为0.01,0.05,0.1,然后根据和自由度
 ,去找到相应的_p-value。可以去查t界值表或者通过程序计算出来。
实例计算
以之前乌龟为例,若样本数据为:
- 样本大小:
 ,
, 
- 样本均值:

- 样本标准差:

建立检验假设,检验水准
 ,即假设两物种乌龟总体平均重量相等
 ,即两物种乌龟总体平均重量不相等
计算t检验统计量:


以 为输T Score to P Value Calculator计算,可得出
 。
。
确定结论 , 故不拒绝零假设
 ,差异无统计学意义。没有充分理由说明两个乌龟物种的平均重量不相等。
Python 代码实现
一般常见的算法,都是有Python库封装好的了,我们直接调用它给的接口就行了。
这里借助一个Python科学计算库 scipy, 一般可以通过命令pip install scipy安装。
import numpy as npimport scipy.stats as stats## 研究者想知道两种植物的平均高度是否相等,所以他们各搜集了20株植物## group1,group2分别为两个植物样本身高group1 = np.array([14, 15, 15, 16, 13, 8, 14, 17, 16, 14, 19, 20, 21, 15, 15, 16, 16, 13, 14, 12])group2 = np.array([15, 17, 14, 17, 14, 8, 12, 19, 19, 14, 17, 22, 24, 16, 13, 16, 13, 18, 15, 13])# 确定总体方差是否相等# 根据经验,如果较大的样本方差与较小的样本方差之比小于4:1,我们可以假定总体具有相同的方差。print(np.var(group1), np.var(group2))# 7.73 12.26 # 12.26 / 7.73 = 1.586,小于4。这意味着我们可以假设总体方差相等## 通过stats.ttest_ind 进行两样本t检验res = stats.ttest_ind(a=group1, b=group2, equal_var=True)print("t statistic: ", res.statistic)print("P Value: ", res.pvalue)## output## t statistic: -0.6337397070250238## P Value: 0.5300471010405257
stats.ttest_ind 的参数a和b分布是第一个样本和第二个样本;equal_var只两个总体方差是否相等。默认为True,若为False可使用Welch’s t-test
结果说明:
 ,假设两种植物平均高度相等
 ,该植物平均高度不相等
因为此次检验p-value(0.53005) 大于 , 不能拒绝 ,所以没有充分的证据说明两植物的平均高度不同。
R代码
t-test在R里使用t.test进行计算
> group1 <- c(14, 15, 15, 16, 13, 8, 14, 17, 16, 14, 19, 20, 21, 15, 15, 16, 16, 13, 14, 12)> group2 <- c(15, 17, 14, 17, 14, 8, 12, 19, 19, 14, 17, 22, 24, 16, 13, 16, 13, 18, 15, 13)> ?t.test> t.test(group1, group2, alternative = "two.sided", var.equal = T, mu=0)Two Sample t-testdata: group1 and group2t = -0.63374, df = 38, p-value = 0.53alternative hypothesis: true difference in means is not equal to 095 percent confidence interval:-2.726335 1.426335sample estimates:mean of x mean of y15.15 15.80
t.test 中的参数设置:
alternative设置备择假设的单双尾检验,默认为”two.sided” ,双尾检验,单位设置成”greater”或”less”- 参数
mu,为两总体的差异均值,这里设为0,因为假设了两总体均值相等。所以差值为0。 var.equal, 两总体方差是否相等
最后的结果和Python中的一样,甚至更详细。
参考

若有收获,就点个赞吧
0 人点赞
