K8S总体架构
参考:https://kubernetes.io/docs/concepts/overview/components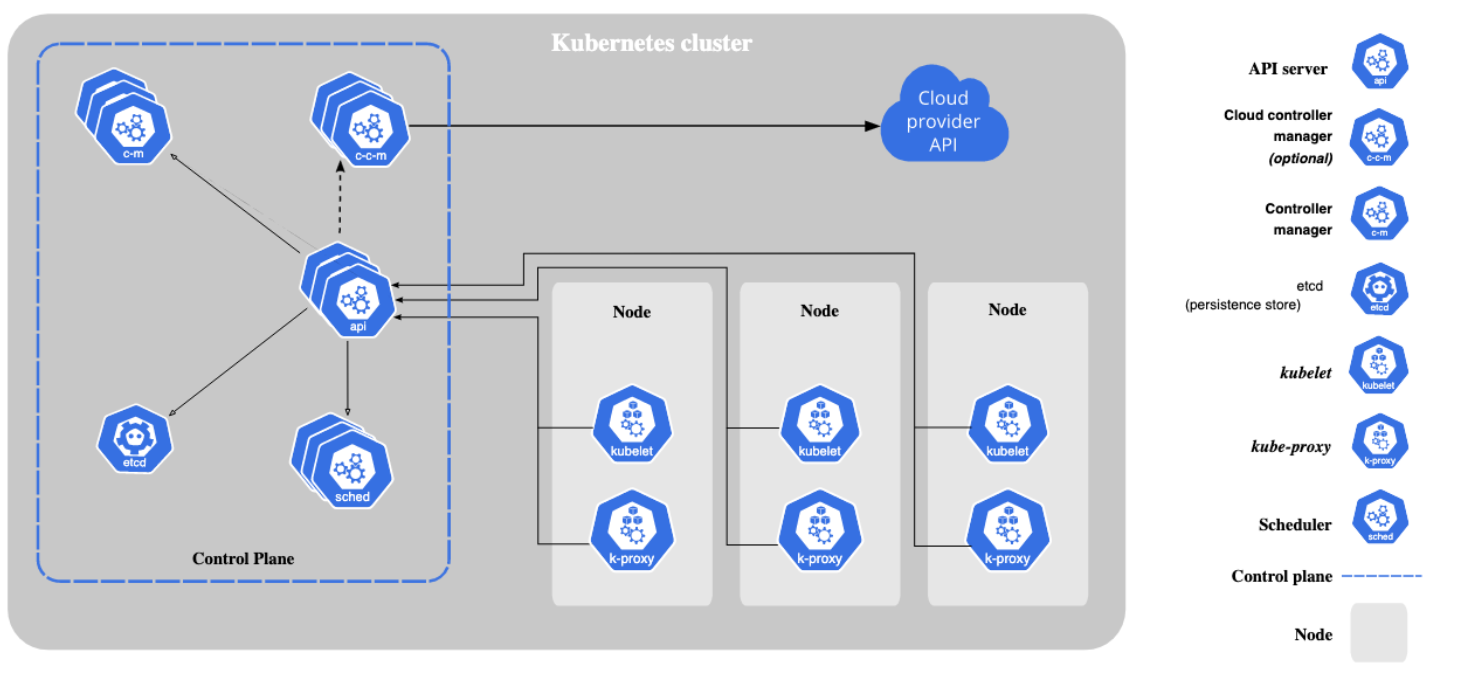
各个组件的监控指标监听端口可参考:Metrics For Kubernetes System Components。一般为本组件的--bind-address监听的默认端口,当然,也可能会有例外,可能存在专门用于监控指标的端口,需要进一步查看原始文档。同时,如果是Kubernetes集群外访问组件的/metrics,则一般最好通过API Server Proxy模式访问方式实现。
总体监控目标
从监控平台本身的业务需求来看,至少应该通过平台获取到如下两个维度的指标数据,从而确定了总体监控目标及范围如下:
- 性能指标:例如,CPU、Memory、Load、磁盘、网络等
- 节点主机
- 节点容器、Pod
- 应用服务及网络:如http、tcp等数据
- 应用业务组件:容器内应用业务组件进程自己主动暴露的性能等指标数据
- 健康状态:例如,K8S集群组件运行状态、K8S集群内运行的资源对象(Pod、Deployment等)的运行状态
- 集群组件:参考:https://kubernetes.io/docs/concepts/cluster-administration/system-metrics/
- kube-apiserver
- etcd
- kube-proxy
- kube-scheduler
- kube-controller-manager
- kubelet
- 集群内资源对象:Pod、Deployment、Daemonset等
- 集群组件:参考:https://kubernetes.io/docs/concepts/cluster-administration/system-metrics/
获取监控数据之后,还需要对监控进行可视化展示,以及对监控中出现的异常情况进行告警。
主流监控方案
目前对于kubernetes的主流监控方案主要有以下几种:
- Heapster+InfluxDB+Grafana
每个K8S节点的Kubelet内含cAdvisor,暴露出API,Kubelet从cAdvisor获取数据。Heapster通过kube-apiserver发现集群的所有节点,并通过访问每个节点的Kubelet API(nodeIP:10255/stats/summary)获取监控数据。它支持多种储存方式,常用的是InfluxDB。这套方案的缺点是数据来源单一、缺乏报警功能以及InfluxDB的单点问题,而且Heapster也已经在新版本中被deprecated(被metrics-server取代)了。这种实现方案的详细介绍请见这篇文章。 - Metrics-Server+InfluxDB+Grafana
K8S从1.8版本开始,CPU、内存等资源的metrics信息可以通过 Metrics API来获取,用户还可以通过kubectl top(1.10版开始)直接获取这些metrics信息。Metrics API需要部署Metrics-Server。Metrics-Server是Kubernetes1.9版本以上的首选方法。可以参考官方架构:Kubernetes monitoring architecture。 - 各种Exporter+Prometheus+AlerManager+Grafana(
我们的实践)
通过各种exporter采集不同维度的监控指标,并通过Prometheus支持的数据格式暴露出来,Prometheus定期pull数据并通过Grafana展示,同时异常情况使用AlertManager告警。
前期准备
Prometheus部署方案概述
各种Exporter+Prometheus+AlertManager+Grafana作为监控K8S的解决方案,一般都是在K8S集群内部部署,这样可以直接使用集群内部的认证、证书及监控内部地址,但是增加了集群的资源开销,同时,将监控系统与监控目标混合到了一起,如果K8S本身出现故障,则监控系统也同时会故障。因此在资源允许的情况下,更倾向于K8S集群外独立部署Prometheus及其相关组件。
结论:在资源允许的情况下,倾向于K8S集群外独立部署Prometheus及其相关组件。
但是,集群外部署Prometheus和集群内部署Prometheus是不一样的,因为Prometheus自动服务发现的一般是由集群内部的私有IP拼接而成的默认抓取目标端点,如果Prometheus本身就部署在K8S集群内部,则其本身就是可以直接通信的;但是如果部署在集群外部,使用默认自动拼接的抓取目标端点是无法访问的(集群内部的私有IP在外部是无法通信的,例如,Service的ClusterIP是K8S集群内私有的虚拟IP地址,集群外部是不存在的)。
如何解决?还好,K8S官方提供了一种集群外部应用访问集群内部API的代理方式,具体可参考Manually constructing apiserver proxy URLs;此时只需要我们自行构造apiserver proxy URLs,集群外Prometheus就可以通过proxy url的方式代理访问实际的抓取目标端点来拉取监控指标数据了,而此过程同样需要借助Prometheus强大的标签重写功能。
结论:通过Prometheus强大的
标签重写功能自行构造出K8S集群apiserver proxy URLS来达到集群外部代理访问集群内部实际抓取目标端点URL地址,以此来实现集群外部监控的目的。
构造apiserver proxy URLs
通过Accessing services running on the cluster了解到在k8s集群中nodes、pods、services都有自己的私有IP,但是却无法从集群外访问。但K8S提供以下几种方式来访问:
- 通过
public IPs访问service - 通过
proxy URLs访问node、pod、service - 通过集群内的node或pod间接访问
而通过kubectl cluster-info可以查看kube-system命令空间的apiserver proxy URLs:
kubectl cluster-infoKubernetes master is running at https://127.0.0.1:8443KubeDNS is running at https://127.0.0.1:8443/api/v1/namespaces/kube-system/services/kube-dns:dns/proxyMetrics-server is running at https://127.0.0.1:8443/api/v1/namespaces/kube-system/services/https:metrics-server:/proxyTo further debug and diagnose cluster problems, use 'kubectl cluster-info dump'.
其默认的构造规则为:
# 访问nodehttps://${apiserver_address}/api/v1/nodes/node_name:[port_name]/proxy/metrics# 访问servicehttps://${apiserver_address}/api/v1/namespaces/service_namespace/services/http:service_name[:port_name]/proxy/metrics# 访问podhttps://${apiserver_address}/api/v1/namespaces/pod_namespace/pods/http:pod_name[:port_name]/proxy/metrics
在了解如何构造proxy url后,我们就可以通过集群外Prometheus的relabel_config自行构造apiserver proxy URLs了。
如何获取API Server地址
结论:
- 集群内部:通过DNS名称
kubernetes.default.svc:443来访问。 - 集群外部:通过
kubectl cluster-info或者kubectl config view | grep server | cut -f 2- -d ":" | tr -d " "获取负载均衡地址。
可通过kubectl cluster-info或者kubectl config view | grep server | cut -f 2- -d ":" | tr -d " "获取API Server地址信息。
## 172.23.16.106上执行kubectl config view | grep server | cut -f 2- -d ":" | tr -d " "https://127.0.0.1:8443
本例中,最终结果为:172.23.16.106:8443。但是,很多文档中讲应该配置kubernetes.default.svc:443,这是为什么?可以参考Implementation details中如下章节,也即,kubernetes.default.svc是API Server默认的DNS域名:
因此,如果Prometheus本身就部署在监控的Kubernetes集群中,则通过Kubernetes集群的DNS机制,本身就是可以直接解析到kubernetes.default.svc:443这个集群内部地址及端口的。而如果Prometheus是独立部署的(例如,本例),则首先讲端口,443集群内部IP肯定是访问不到的,反而6443是可以访问通的;其次,域名解析问题,外部需要额外的DNS服务器正确解析kubernetes.default.svc这个域名,否则,只能通过节点IP来访问。而本例中,则是直接通过API Server的负载均衡地址及端口进行访问的,因此,也即:172.23.16.106:8443(其中,172.23.16.106为节点IP,因为部署K8S集群时未指定负载均衡VIP,因此,猜测任意节点均可以代理过去)。
Generate the necessary certificates
Kubeadm generates certificate and private key pairs for different purposes:
- A self signed certificate authority for the Kubernetes cluster saved into ca.crt file and ca.key private key file
- A serving certificate for the API server, generated using ca.crt as the CA, and saved into apiserver.crt file with its private key apiserver.key. This certificate should contain following alternative names:
- The Kubernetes service’s internal clusterIP (the first address in the services CIDR, e.g. 10.96.0.1 if service subnet is 10.96.0.0/12)
- Kubernetes DNS names, e.g.
kubernetes.default.svc.cluster.localif--service-dns-domainflag value iscluster.local, plus default DNS nameskubernetes.default.svc,kubernetes.default,kubernetes - The node-name
- The —apiserver-advertise-address
- Additional alternative names specified by the user
- A client certificate for the API server to connect to the kubelets securely, generated using ca.crt as the CA and saved into apiserver-kubelet-client.crt file with its private key apiserver-kubelet-client.key. This certificate should be in the system:masters organization
- A private key for signing ServiceAccount Tokens saved into sa.key file along with its public key sa.pub
- A certificate authority for the front proxy saved into front-proxy-ca.crt file with its key front-proxy-ca.key
- A client cert for the front proxy client, generate using front-proxy-ca.crt as the CA and saved into front-proxy-client.crt file with its private keyfront-proxy-client.key
Certificates are stored by default in /etc/kubernetes/pki, but this directory is configurable using the —cert-dir flag.
…
那么,443端口呢?可以查看API Server对应的服务kubernetes:
kubectl describe svc kubernetesName: kubernetesNamespace: defaultLabels: component=apiserverprovider=kubernetesAnnotations: <none>Selector: <none>Type: ClusterIPIP: 10.244.64.1Port: https 443/TCPTargetPort: 6443/TCPEndpoints: 172.23.16.106:6443,172.23.16.107:6443Session Affinity: NoneEvents: <none>
发现,443为内部容器端口,6443为节点的NodePort,端点为:172.23.16.106:6443,172.23.16.107:6443两个都可用。但我们没有用,我们通过kubectl cluster-info看到的地址是[https://127.0.0.1:8443](https://127.0.0.1:8443):
kubectl cluster-infoKubernetes master is running at https://127.0.0.1:8443KubeDNS is running at https://127.0.0.1:8443/api/v1/namespaces/kube-system/services/kube-dns:dns/proxyMetrics-server is running at https://127.0.0.1:8443/api/v1/namespaces/kube-system/services/https:metrics-server:/proxyTo further debug and diagnose cluster problems, use 'kubectl cluster-info dump'.
注意,此处看到的[https://127.0.0.1:8443](https://127.0.0.1:8443)是API Server的负载均衡地址及IP,本例中通过猪齿鱼部署后,默认的负载均衡是Nginx,默认的端口是8443,由于未指定VIP,因此,每个节点IP都可用,可随便选择任意一个端点。最终可形成:[https://172.23.16.106:8443](https://172.23.16.106:8443)。
详情参见部署文档-Ansible inventory.ini:
;-------------------------------------- 以下为基础信息配置 ------------------------------------;[all:vars]; 是否跳过节点物理资源校验,Master节点要求2c2g以上,Worker节点要求2c4g以上skip_verify_node=false; kubernetes版本kube_version="1.16.8"; 负载均衡器; 有 nginx、haproxy、envoy 和 slb 四个选项,默认使用 nginx;lb_mode="nginx"; 使用负载均衡后集群 apiserver ip,设置 lb_kube_apiserver_ip 变量,则启用负载均衡器 + keepalived; lb_kube_apiserver_ip="192.168.56.15"; 使用负载均衡后集群 apiserver portlb_kube_apiserver_port="8443"
从端口监听程序也可以看出来是Nginx:
netstat -tunlp | grep 8443tcp 0 0 0.0.0.0:8443 0.0.0.0:* LISTEN 10698/nginx: master
另外,可能是因为没有指定负载均衡的VIP,因此,默认为
127.0.0.1:8443,也即kubectl cluster-info看到的结果。
如何获取根证书及token
方式一:最小可用权限原则
- 此处的
根证书用于客户端校验服务器端证书的合法性- 此处的
token用于访问时ServiceAccount的认证及授权
## 192.168.17.117 k8s主节点cd /u01/repo/example## 创建ServiceAccountvim prometheus-serviceaccount.ymlkubectl create -f prometheus-serviceaccount.yml---apiVersion: v1kind: ServiceAccountmetadata:name: prometheus---## 创建Cluster级别角色vim prometheus-clusterrole.ymlkubectl create -f prometheus-clusterrole.yml---apiVersion: rbac.authorization.k8s.io/v1beta1kind: ClusterRolemetadata:name: prometheusrules:- apiGroups: ["", "extensions", "apps"]resources:- nodes- nodes/proxy- nodes/metrics- services- services/proxy- endpoints- pods- pods/proxy- deploymentsverbs: ["get", "list", "watch"]- nonResourceURLs: ["/metrics"]verbs: ["get"]---## 绑定角色及用户kubectl create clusterrolebinding prometheus-clusterrole-binding --clusterrole=prometheus --serviceaccount=default:prometheus## 当然,也可以直接绑定cluster-admin集群管理员角色## 获取Tokenkubectl describe serviceaccount prometheusName: prometheusNamespace: defaultLabels: <none>Annotations: <none>Image pull secrets: <none>Mountable secrets: prometheus-token-gxb6cTokens: prometheus-token-gxb6cEvents: <none>## 知道了`Mountable secrets`,就可以获取Token了。kubectl get secrets prometheus-token-gxb6c -ojsonpath='{.data.token}' | base64 -deyJhbGciOiJSUzI1NiIsImtpZCI6Ijc0QXUtSGlaNGFoTjVuRFhRTF8zREN3T0VFQ2loYkpzNXYzTHdXZ3FVMEEifQ.eyJpc3MiOiJrdWJlcm5ldGVzL3NlcnZpY2VhY2NvdW50Iiwia3ViZXJuZXRlcy5pby9zZXJ2aWNlYWNjb3VudC9uYW1lc3BhY2UiOiJkZWZhdWx0Iiwia3ViZXJuZXRlcy5pby9zZXJ2aWNlYWNjb3VudC9zZWNyZXQubmFtZSI6InByb21ldGhldXMtdG9rZW4tZ3hiNmMiLCJrdWJlcm5ldGVzLmlvL3NlcnZpY2VhY2NvdW50L3NlcnZpY2UtYWNjb3VudC5uYW1lIjoicHJvbWV0aGV1cyIsImt1YmVybmV0ZXMuaW8vc2VydmljZWFjY291bnQvc2VydmljZS1hY2NvdW50LnVpZCI6IjkyNTQ1NDc4LTQyNGMtNDVlOS04MTVkLTViZjYxMTFmZjk2NiIsInN1YiI6InN5c3RlbTpzZXJ2aWNlYWNjb3VudDpkZWZhdWx0OnByb21ldGhldXMifQ.bg8ehGgW4omCYY348g1baOwwpnYY926kfbJhLXNwv4J4RoLP60L8Ez90rw3VdjGgFu06uCqx1WP-JOMkjFJrgLDZMP9hyYobCSi1al2KAHvtCxOmbKRtmXcta5cSVEaiIdVT6ap8A78i17557Wt_teQQFGTtX2K4FmNcoDBOpFUzIK6ADUjTD6WHfpsIH7FzNfBWYswtfABNLRd624m7o5p4DV4JGP9IR6gwgD83qQupe7k6DH1qgDiZdIWjAN_WOhBoUh6L1S3WXupwxx8wYWoVJ7hfd9Yihlo5hrbHMdJ7PzKw-FM245OASEgjpse0u-RxMfKVE8XHrock1Gh6eg
注意:
- Service Account授权
- 此处的Service Account授权需要包含
nodes/proxy,否则,通过API Server中转的方式/api/v1/nodes/${1}/proxy/metrics/cadvisor就会有问题。详见:https://github.com/prometheus/prometheus/issues/2606。 - 此处的Service Account授权需要包含
nodes/metrics,否则,直接通过节点的Kubelet方式访问NODE_ID/10250/metrics就会报错Forbidden (user=system:serviceaccount:default:prometheus, verb=get, resource=nodes, subresource=metrics)。 services/proxy及pods/proxy也是同样的道理,视情况使用哪种代理,则需要相应授权。或者直接授予cluster-admin集群管理员角色
- 此处的Service Account授权需要包含
- 此处Token需要
base64 -d进行转码,同时,此处并没有通过-n指定命名空间,那是因为,我们的Service Account本身是创建在default默认命名空间下的。另外,是否可以用kubectl get tokens语法?将会报错:error: the server doesn’t have a resource type “tokens”,也即K8S中并没有tokens这种资源类型。
方式二:构造集群管理员权限Service Account
如果需要访问不同的namespace,也可以分配cluster-admin,以免权限不足。具体步骤如下:
# 1.创建serviceaccountskubectl create sa hops-admin -n kube-system# 2.绑定cluster-admin角色到hopskubectl create clusterrolebinding hops-admin --clusterrole cluster-admin --serviceaccount=kube-system:hops-admin
虽创建了serviceaccount,但访问apiserver并不是直接使用serviceaccount,而是通过token。因此我们需要获取serviceaccount:hops-admin对应的token,而此token是经过base64加密过的,必须解密后才能使用。
# 1. kube-system命名空间下查看sa# kubectl get sa -n kube-systemNAME SECRETS AGEhops-admin 1 55s...# 2. 查看secret# kubectl get sa hops-admin -n kube-system -o yamlapiVersion: v1kind: ServiceAccountmetadata:creationTimestamp: "2020-11-30T18:58:50Z"name: hops-adminnamespace: kube-systemresourceVersion: "4250441"selfLink: /api/v1/namespaces/kube-system/serviceaccounts/hops-adminuid: 9ec3b19d-aad1-4f05-8de4-f0dfe3865be6secrets:- name: hops-admin-token-z9b8t# 3. 获取token,从yaml中得到token并进行解码# kubectl get secrets -n kube-system hops-admin-token-z9b8t -ojsonpath='{.data.token}' | base64 -d---eyJhbGciOiJSUzI1NiIsImtpZCI6Ijc0QXUtSGlaNGFoTjVuRFhRTF8zREN3T0VFQ2loYkpzNXYzTHdXZ3FVMEEifQ.eyJpc3MiOiJrdWJlcm5ldGVzL3NlcnZpY2VhY2NvdW50Iiwia3ViZXJuZXRlcy5pby9zZXJ2aWNlYWNjb3VudC9uYW1lc3BhY2UiOiJrdWJlLXN5c3RlbSIsImt1YmVybmV0ZXMuaW8vc2VydmljZWFjY291bnQvc2VjcmV0Lm5hbWUiOiJob3BzLWFkbWluLXRva2VuLXo5Yjh0Iiwia3ViZXJuZXRlcy5pby9zZXJ2aWNlYWNjb3VudC9zZXJ2aWNlLWFjY291bnQubmFtZSI6ImhvcHMtYWRtaW4iLCJrdWJlcm5ldGVzLmlvL3NlcnZpY2VhY2NvdW50L3NlcnZpY2UtYWNjb3VudC51aWQiOiI5ZWMzYjE5ZC1hYWQxLTRmMDUtOGRlNC1mMGRmZTM4NjViZTYiLCJzdWIiOiJzeXN0ZW06c2VydmljZWFjY291bnQ6a3ViZS1zeXN0ZW06aG9wcy1hZG1pbiJ9.I5UM5xUbQ6Qc9B-stcZp022tXIYjKSf4VtbF-FzCtCBJOy8gQdqoxfWj5gQa7O5TYgBH_YXxpy-q-J217wupxPeH_owNUGOBGj3eB8Sbs-BUVINqltGAAS9Mmzh2a-ApP9u1OsvEYafXf0vYAYSCBWnNyhUsljx4o-Yo6CmdyQh0f6FqEhcZMKXbyasVVcmZelswFUftLM4BRrxaF3JGvlw_PG7HAvIPDhQqC43gzI_m6xtVzjpGBSe_GTf7TY5_7Cs2c6u6ZowPVId0KNaCDTzlg0Jm5kIhETU8rbYp1kwunguabh1bH7PUG7m1daFsvkPktUW3Uc6QXsZcbB4qDw---
通过自建POD,从自建POD中下载根证书及Token文件
## 任意启动一个Pod,serviceAccountName指定为如上的prometheusvim example.ymlkubectl create -f example.yml---apiVersion: v1kind: Podmetadata:name: examplespec:serviceAccountName: prometheuscontainers:- image: luksa/kubianame: kubiaports:- containerPort: 8080protocol: TCP---## 拷贝这个Pod的ca.crt/token/namespacekubectl describe pod example---Mounts:/var/run/secrets/kubernetes.io/serviceaccount from prometheus-token-7vdmz (ro)---kubectl cp default/example:/var/run/secrets/kubernetes.io/serviceaccount ./---tar: Removing leading `/' from member nameswarning: file "..data" is a symlink, skipping (consider using "kubectl exec -n "default" "example" -- tar cf - "/var/run/secrets/kubernetes.io/serviceaccount" | tar xf -")warning: skipping symlink: "namespace" -> "..data/namespace"warning: skipping symlink: "ca.crt" -> "..data/ca.crt"warning: skipping symlink: "token" -> "..data/token"---## 可能会报警告,无法成功,通过警告提示的命令执行即可kubectl exec -n "default" "example" -- tar cf - "/var/run/secrets/kubernetes.io/serviceaccount" | tar xf -# pwd/u01/repo/example/var/run/secrets/kubernetes.io/serviceaccount# lltotal 0lrwxrwxrwx 1 root root 13 Apr 20 18:27 ca.crt -> ..data/ca.crtlrwxrwxrwx 1 root root 16 Apr 20 18:27 namespace -> ..data/namespacelrwxrwxrwx 1 root root 12 Apr 20 18:27 token -> ..data/token
验证Token-查看指标数据
—> Fetch the Kubelet endpoints
curl -k $APISERVER/api/v1/nodes/$NODE/proxy/metrics --header "Authorization: Bearer $TOKEN"curl -k $APISERVER/api/v1/nodes/$NODE/proxy/metrics/cadvisor --header "Authorization: Bearer $TOKEN"curl -k $APISERVER/api/v1/nodes/$NODE/proxy/healthz --header "Authorization: Bearer $TOKEN"
-k, --insecure: Allow connections to SSL sites without certs (H).
—> Fetch the endpoints directly on Kubelet
curl -k https://$NODE:10250/metrics --header "Authorization: Bearer $TOKEN"curl -k https://$NODE:10250/metrics/cadvisor --header "Authorization: Bearer $TOKEN"curl -k https://$NODE:10250/heathz --header "Authorization: Bearer $TOKEN"
<kubernetes_sd_config>
参考官方文档:https://prometheus.io/docs/prometheus/latest/configuration/configuration/#kubernetes_sd_config
Kubernetes SD configurations allow retrieving scrape targets from
Kubernetes’ REST API and always staying synchronized with
the cluster state.
One of the following role types can be configured to discover targets:
node
The node role discovers one target per cluster node with the address defaulting
to the Kubelet’s HTTP port.
The target address defaults to the first existing address of the Kubernetes
node object in the address type order of NodeInternalIP, NodeExternalIP,NodeLegacyHostIP, and NodeHostName.
Available meta labels:
__meta_kubernetes_node_name: The name of the node object.__meta_kubernetes_node_label_<labelname>: Each label from the node object.__meta_kubernetes_node_labelpresent_<labelname>:truefor each label from the node object.__meta_kubernetes_node_annotation_<annotationname>: Each annotation from the node object.__meta_kubernetes_node_annotationpresent_<annotationname>:truefor each annotation from the node object.__meta_kubernetes_node_address_<address_type>: The first address for each node address type, if it exists.
In addition, the instance label for the node will be set to the node name
as retrieved from the API server.
service
The service role discovers a target for each service port for each service.
This is generally useful for blackbox monitoring of a service.
The address will be set to the Kubernetes DNS name of the service and respective
service port.
Available meta labels:
__meta_kubernetes_namespace: The namespace of the service object.__meta_kubernetes_service_annotation_<annotationname>: Each annotation from the service object.__meta_kubernetes_service_annotationpresent_<annotationname>: “true” for each annotation of the service object.__meta_kubernetes_service_cluster_ip: The cluster IP address of the service. (Does not apply to services of type ExternalName)__meta_kubernetes_service_external_name: The DNS name of the service. (Applies to services of type ExternalName)__meta_kubernetes_service_label_<labelname>: Each label from the service object.__meta_kubernetes_service_labelpresent_<labelname>:truefor each label of the service object.__meta_kubernetes_service_name: The name of the service object.__meta_kubernetes_service_port_name: Name of the service port for the target.__meta_kubernetes_service_port_protocol: Protocol of the service port for the target.__meta_kubernetes_service_type: The type of the service.
pod
The pod role discovers all pods and exposes their containers as targets. For each declared
port of a container, a single target is generated. If a container has no specified ports,
a port-free target per container is created for manually adding a port via relabeling.
Available meta labels:
__meta_kubernetes_namespace: The namespace of the pod object.__meta_kubernetes_pod_name: The name of the pod object.__meta_kubernetes_pod_ip: The pod IP of the pod object.__meta_kubernetes_pod_label_<labelname>: Each label from the pod object.__meta_kubernetes_pod_labelpresent_<labelname>:truefor each label from the pod object.__meta_kubernetes_pod_annotation_<annotationname>: Each annotation from the pod object.__meta_kubernetes_pod_annotationpresent_<annotationname>:truefor each annotation from the pod object.__meta_kubernetes_pod_container_init:trueif the container is an InitContainer__meta_kubernetes_pod_container_name: Name of the container the target address points to.__meta_kubernetes_pod_container_port_name: Name of the container port.__meta_kubernetes_pod_container_port_number: Number of the container port.__meta_kubernetes_pod_container_port_protocol: Protocol of the container port.__meta_kubernetes_pod_ready: Set totrueorfalsefor the pod’s ready state.__meta_kubernetes_pod_phase: Set toPending,Running,Succeeded,FailedorUnknown
in the lifecycle.__meta_kubernetes_pod_node_name: The name of the node the pod is scheduled onto.__meta_kubernetes_pod_host_ip: The current host IP of the pod object.__meta_kubernetes_pod_uid: The UID of the pod object.__meta_kubernetes_pod_controller_kind: Object kind of the pod controller.__meta_kubernetes_pod_controller_name: Name of the pod controller.
endpoints
endpoints角色的用法相对较广,其同时可以获取服务维度及Pod维度的指标标签,但一般不同的抓取任务需要通过__meta_kubernetes_endpoint_port_name端口名称或者__meta_kubernetes_service_name服务名称来限定具体是抓取的哪个服务或者容器的指标信息,否则会持续有很多EndPoint被自动发现,但是,特定的抓取任务又无法有效处理(尤其是不同的抓取任务标签重写都是不同的,用于特定的用途)。
__meta_kubernetes_endpoint_port_name端口名称:一般用于业务容器与监控容器(sidecar容器)共存于同一个Pod的情况,例如,redis业务容器与redis-exporter监控容器__meta_kubernetes_service_name服务名称:一般用于限定抓取不同的服务端点,例如,etcd/kube-proxy等通过服务暴露监控指标的情况
The endpoints role discovers targets from listed endpoints of a service. For each endpoint
address one target is discovered per port. If the endpoint is backed by a pod, all
additional container ports of the pod, not bound to an endpoint port, are discovered as targets as well.
Available meta labels:
__meta_kubernetes_namespace: The namespace of the endpoints object.__meta_kubernetes_endpoints_name: The names of the endpoints object.- For all targets discovered directly from the endpoints list (those not additionally inferred
from underlying pods), the following labels are attached:__meta_kubernetes_endpoint_hostname: Hostname of the endpoint.__meta_kubernetes_endpoint_node_name: Name of the node hosting the endpoint.__meta_kubernetes_endpoint_ready: Set totrueorfalsefor the endpoint’s ready state.__meta_kubernetes_endpoint_port_name: Name of the endpoint port.__meta_kubernetes_endpoint_port_protocol: Protocol of the endpoint port.__meta_kubernetes_endpoint_address_target_kind: Kind of the endpoint address target.__meta_kubernetes_endpoint_address_target_name: Name of the endpoint address target.
- If the endpoints belong to a service, all labels of the
role: servicediscovery are attached. - For all targets backed by a pod, all labels of the
role: poddiscovery are attached.
ingress
The ingress role discovers a target for each path of each ingress.
This is generally useful for blackbox monitoring of an ingress.
The address will be set to the host specified in the ingress spec.
Available meta labels:
__meta_kubernetes_namespace: The namespace of the ingress object.__meta_kubernetes_ingress_name: The name of the ingress object.__meta_kubernetes_ingress_label_<labelname>: Each label from the ingress object.__meta_kubernetes_ingress_labelpresent_<labelname>:truefor each label from the ingress object.__meta_kubernetes_ingress_annotation_<annotationname>: Each annotation from the ingress object.__meta_kubernetes_ingress_annotationpresent_<annotationname>:truefor each annotation from the ingress object.__meta_kubernetes_ingress_scheme: Protocol scheme of ingress,httpsif TLS
config is set. Defaults tohttp.__meta_kubernetes_ingress_path: Path from ingress spec. Defaults to/.
See below for the configuration options for Kubernetes discovery:
# The information to access the Kubernetes API.# The API server addresses. If left empty, Prometheus is assumed to run inside# of the cluster and will discover API servers automatically and use the pod's# CA certificate and bearer token file at /var/run/secrets/kubernetes.io/serviceaccount/.[ api_server: <host> ]# The Kubernetes role of entities that should be discovered.role: <role># Optional authentication information used to authenticate to the API server.# Note that `basic_auth`, `bearer_token` and `bearer_token_file` options are# mutually exclusive.# password and password_file are mutually exclusive.# Optional HTTP basic authentication information.basic_auth:[ username: <string> ][ password: <secret> ][ password_file: <string> ]# Optional bearer token authentication information.[ bearer_token: <secret> ]# Optional bearer token file authentication information.[ bearer_token_file: <filename> ]# Optional proxy URL.[ proxy_url: <string> ]# TLS configuration.tls_config:[ <tls_config> ]# Optional namespace discovery. If omitted, all namespaces are used.namespaces:names:[ - <string> ]# Optional label and field selectors to limit the discovery process to a subset of available resources.# See https://kubernetes.io/docs/concepts/overview/working-with-objects/field-selectors/# and https://kubernetes.io/docs/concepts/overview/working-with-objects/labels/ to learn more about the possible# filters that can be used. Endpoints role supports pod, service and endpoints selectors, other roles# only support selectors matching the role itself (e.g. node role can only contain node selectors).# Note: When making decision about using field/label selector make sure that this# is the best approach - it will prevent Prometheus from reusing single list/watch# for all scrape configs. This might result in a bigger load on the Kubernetes API,# because per each selector combination there will be additional LIST/WATCH. On the other hand,# if you just want to monitor small subset of pods in large cluster it's recommended to use selectors.# Decision, if selectors should be used or not depends on the particular situation.[ selectors:[ - role: <role>[ label: <string> ][ field: <string> ] ]]
Where <role> must be endpoints, service, pod, node, oringress.
See this example Prometheus configuration file
for a detailed example of configuring Prometheus for Kubernetes.
You may wish to check out the 3rd party Prometheus Operator,
which automates the Prometheus setup on top of Kubernetes.

若有收获,就点个赞吧
0 人点赞
