回归
Excise
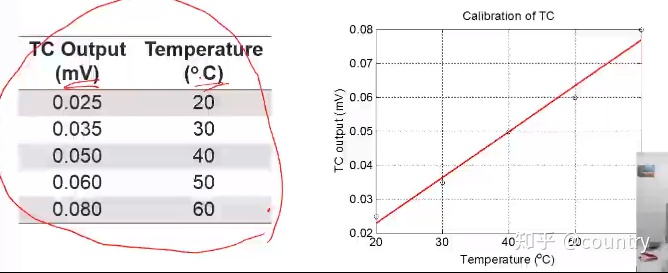
1、Given the table below:
(1)Find the 和
of the regression line(找到回归线)
(2)Plot the figure
TC = [0.025 0.035 0.050 0.060 0.080];T = [20 30 40 50 60];fit = polyfit(T,TC,1)Tfit = T(1):0.01:T(end);TCfit = fit(1) * Tfit + fit(2);plot(T,TC,'ko',Tfit,TCfit,'r','LineWidth',2);set(gca,'FontSize',14);grid on;set(gca,'GridLineStyle','--'); %设置网格线为虚线xlabel('Temperature(^oC)');ylabel('TC output(mV)');title('Calibration of TC')
Excise
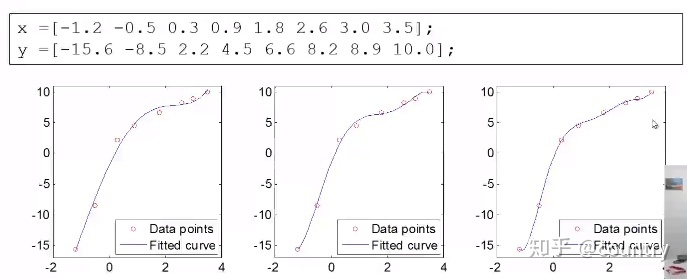
1、Find the -order polynomials
2、Is it better to use higher order polynomials?(错,可能过拟合)
x = [-1.2 -0.5 0.3 0.9 1.8 2.6 3.0 3.5];
y = [-15.6 -8.5 2.2 4.5 6.6 8.2 8.9 10.0];
figure('Position',[50 50 1500 400]);
for i = 4:6
    subplot(1,3,i-3);
    %由于与order用的是同样的变量,所以只需减掉多的3阶即可
    p = polyfit(x,y,i);
    xfit = x(1):0.1:x(end);
    yfit = polyval(p,xfit);
    plot(x,y,'ro',xfit,yfit);
    set(gca,'FontSize',14);
    ylim([-17,11]);
    legend('Data points','Fitted curve','Location','southeast');
end
自己写出的代码,图会挤在一块
x = [-1.2 -0.5 0.3 0.9 1.8 2.6 3.0 3.5];
y = [-15.6 -8.5 2.2 4.5 6.6 8.2 8.9 10.0];
figure('Position',[50 50 1500 400]);
for i=4:6
    subplot(4,6,i);%要修改这里的数字,是1-3;
    p=polyfit(x,y,i);
    xfit=x(1):0.1:x(end);
    yfit=polyval(p,xfit);
    plot(x,y,'ro',xfit,yfit);
    set(gca,'FontSize',14);
    ylim([-17,11]);
    legend('Data points','Fitted curve','Location','southeast');
end
原因:subplot(m,n,p)或者subplot(m n p)。
subplot是将多个图画到一个平面上的工具。其中,m表示是图排成m行,n表示图排成n列,也就是整个figure中有n个图是排成一行的,一共m行,如果m=2就是表示2行图。p表示图所在的位置,p=1表示从左到右从上到下的第一个位置。
内插
Excise
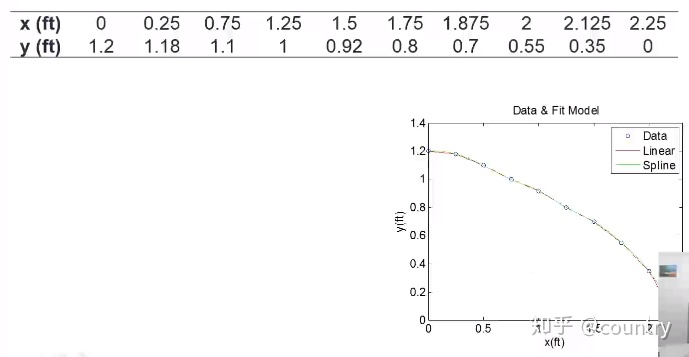
1、Fit the data using linear lines and cubic splines(用直线和三次样条拟合数据)
自己的:
 x = [0 0.25 0.75 1.25 1.5 1.75 1.875 2 2.125 2.25];
 y = [1.2 1.18 1.1 1 0.92 0.8 0.7 0.55 0.35 0];
 x_m=x;
 y_m=y;
 plot(x_m,y_m,'ro','MarkerFaceColor','r');
 box on;
 m_i=~isnan(x_m);
 y_i1=interp1(x_m(m_i),y_m(m_i),x);
 y_i2=spline(x_m(m_i),y_m(m_i),x);
 hold on;
 plot(x,y_i1,'-b','LineWidth',2);
 plot(x,y_i2,'-g','LineWidth',2);
 hold off;
 h=legend('Original','Linear','Spline');
 set(h,'FontName','Times New Roman')
示例:
x = [0 0.25 0.75 1.25 1.5 1.75 1.875 2 2.125 2.25];
y = [1.2 1.18 1.1 1 0.92 0.8 0.7 0.55 0.35 0];
x_i = 0:0.1:2.5;
hold on
plot(x,y,'bo');%绘制散点图
xlim([0,2.5]);
ylim([0,1.4]);
box on;
y_i1 = interp1(x,y,x_i);%使用内插值线段连接
y_i2 = interp1(x,y,x_i,'spine');%使用样条差值连接
plot(x_i,y_i2,'r','linewidth',1);
plot(x_i,y_i1,'c');
xlabel('x(ft)');
ylabel('y(ft)');
title('Data & Fit Model');
set(gca,'fontsize',14);
legend('Data','Linear','Spline')
hold off

