一、诗词大会
昔年种柳,依依汉南。
今看摇落,凄怆江潭。
树犹如此,人何以堪。
——《枯树赋》庾信(北周)
张华考上了北京大学;
李萍进了中等技术学校;
我在百货公司当售货员。
我们都有光明当前途。
《无题·重帏深下莫愁堂》唐 李商隐
重帏深下莫愁堂,卧后清宵细细长。
神女生涯原是梦,小姑居处本无郎。
风波不信菱枝弱,月露谁教桂叶香。
直道相思了无益,未妨惆怅是清狂。
山川异域,风月同天。寄诸佛子,共结来缘。
岂曰无衣,与子同裳。
青山一道同云雨,明月何曾是两乡。
辽河雪融,富山花开。同气连枝,共盼春来。
——日本援助中国抗击新型冠状病毒肺炎
《送柴侍御》【作者】王昌龄 (唐)
沅水通波接武冈,送君不觉有离伤。
青山一道同云雨,明月何曾是两乡。
二、知识储备
得到课程:密码学,信息论
金融科技:satoshi白皮书
三、人生苦短,我用Python
1、OS系统的优势
OS系统是可以直接通过shell命令运行.py文件的,而windows则不行。
OS系统可以打开终端直接跑.py文件。当然,更方便的是直接使用集成好的python开发环境来写。
2、Hub、编译器、库、模块和环境:
你都用 Python 来做什么?
[https://www.zhihu.com/question/20799742**](https://www.zhihu.com/question/20799742)
**
Apache ECharts
https://www.echartsjs.com/zh/feature.html#big-data
腾讯云
https://cloud.tencent.com/developer/search/article-pyecharts
廖雪峰
https://www.liaoxuefeng.com/wiki/1016959663602400/1017104324028448
大专栏
https://www.dazhuanlan.com/
我们生活在“Python时代”
https://baijiahao.baidu.com/s?id=1648241919117346415&wfr=spider&for=pc
GitHub https://github.com/
GitHub 是一个面向开源及私有 软件项目的托管平台,因为只支持 Git 作为唯一的版本库格式进行托管,故名 GitHub。 GitHub 于 2008 年 4 月 10 日正式上线,除了 Git 代码仓库托管及基本的 Web 管理界面以外,还提供了订阅、讨论组、文本渲染、在线文件编辑器、协作图谱(报表)、代码片段分享(Gist)等功能。目前,其注册用户已经超过350万,托管版本数量也是非常之多,其中不乏知名开源项目 Ruby on Rails、jQuery、python 等。GitHub 去年为漏洞支付了 16.6 万美元赏金。 2018年6月,GitHub被微软以75亿美元的价格收购。
知乎:https://www.zhihu.com/topic/19566035/intro
Jupyter Notebook https://jupyter.org/**Jupyter Notebook(此前被称为 IPython notebook)是一个交互式笔记本,支持运行 40 多种编程语言。
Jupyter Notebook 的本质是一个 Web 应用程序,便于创建和共享文学化程序文档,支持实时代码,数学方程,可视化和 markdown。 用途包括:数据清理和转换,数值模拟,统计建模,机器学习等等。
知乎:https://www.zhihu.com/question/266988943 Jupyter Notebook 有哪些奇技淫巧?
简书:https://www.jianshu.com/p/061c6e5c4b0d Jupyter Notebook 入门指南
百度:https://baijiahao.baidu.com/s?id=1640454102005014843&wfr=spider&for=pc
一招帮你毫不费力地优化Jupyter笔记本
Spider **https://docs.spyder-ide.org/
Spyder: The Scientific Python Development Environment — Documentation
Spyder is a powerful scientific environment written in Python, for Python, and designed by and for scientists, engineers and data analysts. It features a unique combination of the advanced editing, analysis, debugging, and profiling functionality of a comprehensive development tool with the data exploration, interactive execution, deep inspection, and beautiful visualization capabilities of a scientific package. Furthermore, Spyder offers built-in integration with many popular scientific packages, including NumPy, SciPy, Pandas, IPython, QtConsole, Matplotlib, SymPy, and more.
Beyond its many built-in features, Spyder’s abilities can be extended even further via its plugin system and API. Spyder can also be used as a PyQt5 extension library, allowing you to build upon its functionality and embed its components, such as the interactive console, in your own software.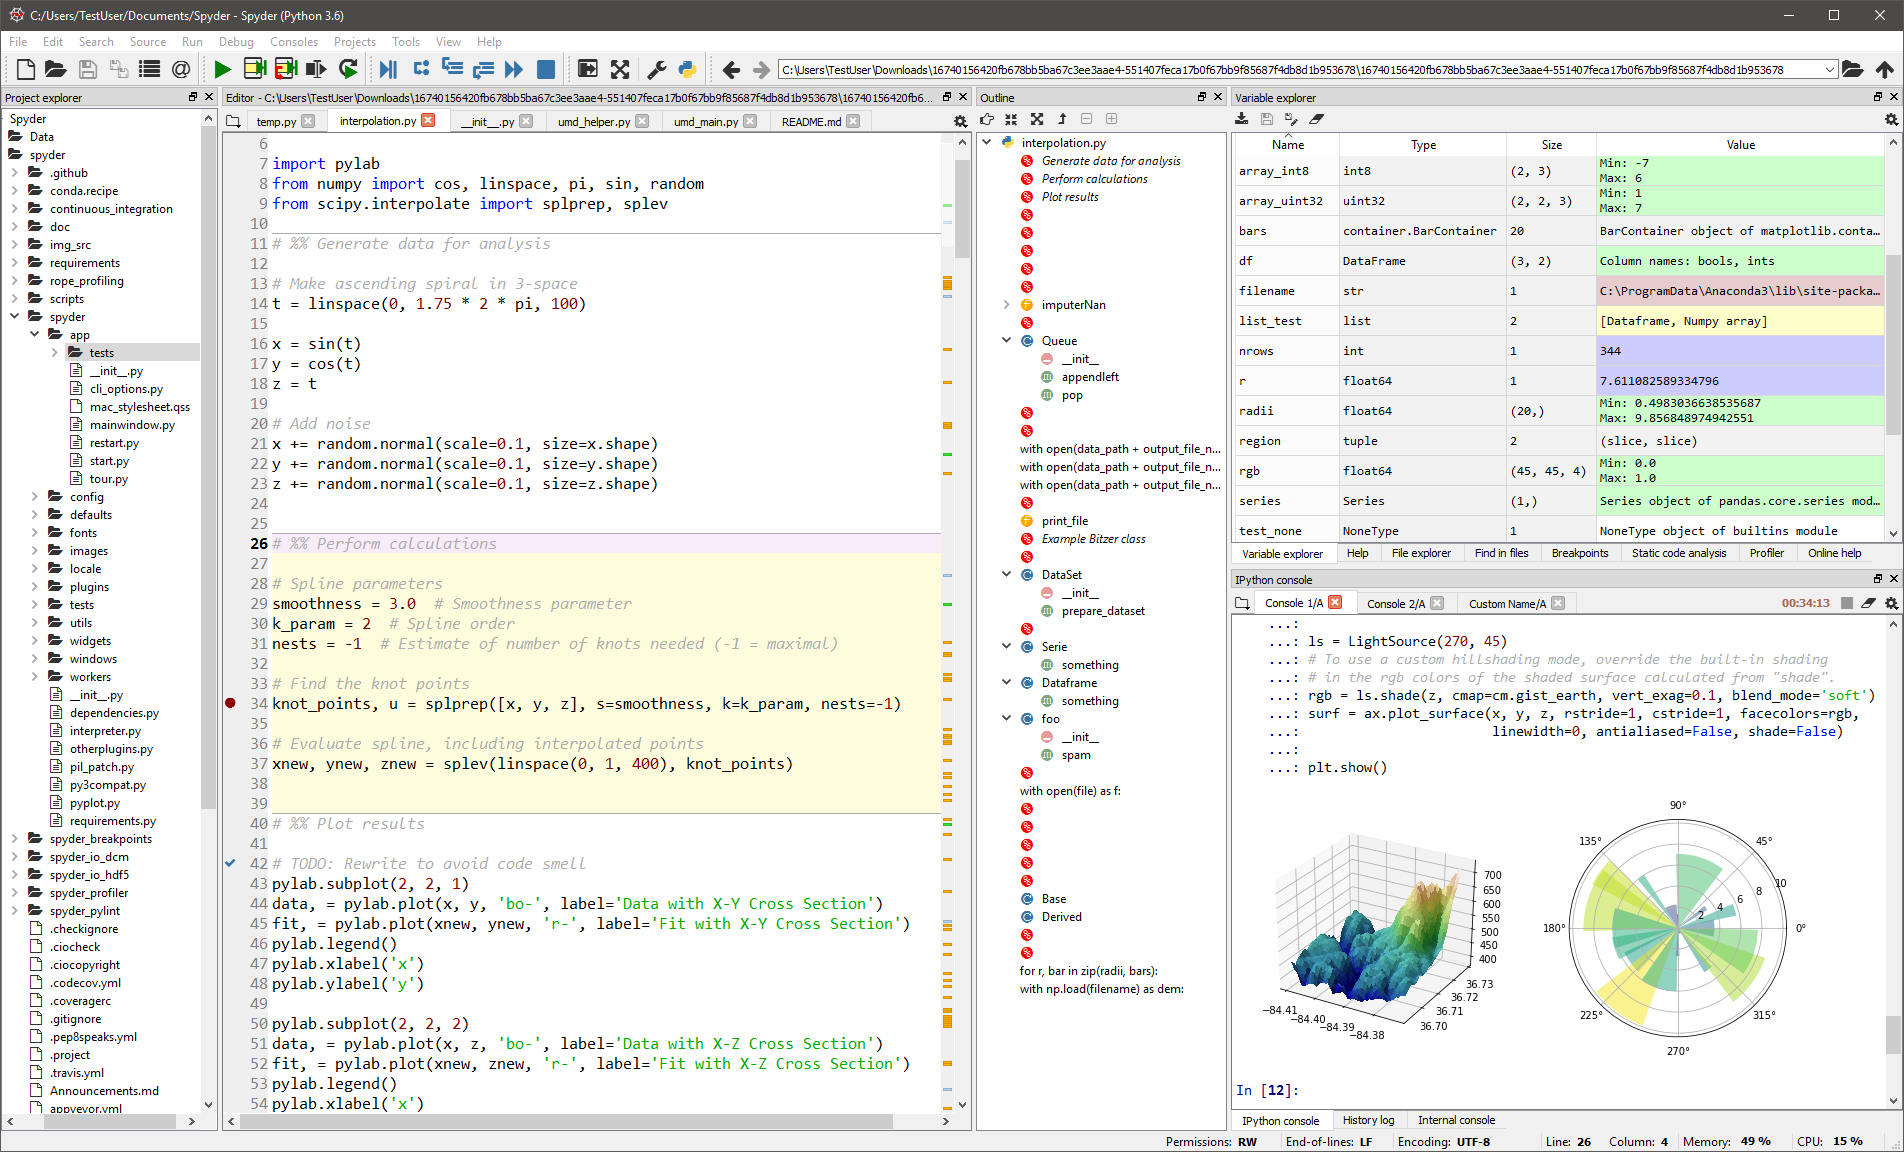
【数据可视化】Pycharts **http://pyecharts.herokuapp.com/
Pyecharts 是一个用于生成 Echarts 图表的类库。Echarts 是百度开源的一个数据可视化 JS 库。用 Echarts 生成的图可视化效果非常棒,为了与 Python 进行对接,方便在 Python 中直接使用数据生成图,我写了这个项目。
本网站只是用于展示使用 pyecharts 生成的图的效果,如果您对项目感兴趣,可前往 pyecharts/pyecharts 了解更多内容.这个网站是用 Flask+pyecharts 写的,并部署在 Heroku。本网站源码在 pyecharts/pyecharts-app
腾讯云社区:https://cloud.tencent.com/developer/information/pyecharts%E6%96%87%E6%A1%A3
pyecharts文档
简书:https://www.jianshu.com/p/52dbe714d2f6
干货 | 使用pyecharts绘制交互式动态地图
简书:https://www.jianshu.com/p/554d64470ec9
Python可视化神器——pyecharts的超详细使用指南!
简书:https://www.jianshu.com/p/8490b46473a5
用jieba提词,pyecharts的WordCloud绘制词云图
简书:https://www.jianshu.com/p/23200304409c
用pyecharts制作词云图
简书:https://www.jianshu.com/p/6ab840d939ed
Pyecharts Overlap导入出错
csdn:https://blog.csdn.net/weixin_42232219/article/details/90631442
重磅!你们一直催的 PyEcharts教程来啦
csdn:https://blog.csdn.net/Sakura55/article/details/80839306
可视化库——Matplotlib+Pyecharts 高级篇及应用
csdn:https://blog.csdn.net/qq_39422642/article/details/81205049
python 的可视化:Pyecharts VS Matplotlib
csdn:https://blog.csdn.net/qq_34673193/article/details/99625136
使用python的seaborn、matplotlib、pyecharts绘制各种图形
csdn:https://blog.csdn.net/weixin_30419799/article/details/95792354
python的数据可视化库 matplotlib 和 pyecharts
csdn:https://blog.csdn.net/kun1280437633/article/details/89474284
玩转wordcloud
csdn:https://www.echartsjs.com/zh/index.html
Apache ECharts 是一个正在由 Apache 孵化器赞助的 Apache 开源基金会孵化的项目。
我们正在处理将本站跳转到 https://echarts.apache.org 的迁移工作。您可以现在就前往我们的 Apache 官网。
csdn:https://blog.csdn.net/qq_39422642/article/details/78631075
python之matplotlib应用
其他:http://www.freesion.com/article/365667949/
PYTHON + PYECHARTS + WORDCLOUD数据可视化
其他:https://pyecharts.github.io/pyecharts.js-app/#https://raw.githubusercontent.com/pyecharts/pyecharts-app/master/app/charts/wordcloud.py
pyecharts - Experience pyecharts
其他:http://www.sohu.com/a/278412237_464033
可视化神器Pyecharts,这份最全教程请收好!
其他:https://www.echartsjs.com/zh/feature.html#big-data
【数据可视化】Matplotlib https://matplotlib.org/
Matplotlib 是一个 Python 的 2D绘图库,它以各种硬拷贝格式和跨平台的交互式环境生成出版质量级别的图形。通过 Matplotlib,开发者可以仅需要几行代码,便可以生成绘图,直方图,功率谱,条形图,错误图,散点图等。numpy 和 matplotlib https://www.runoob.com/numpy/numpy-matplotlib.html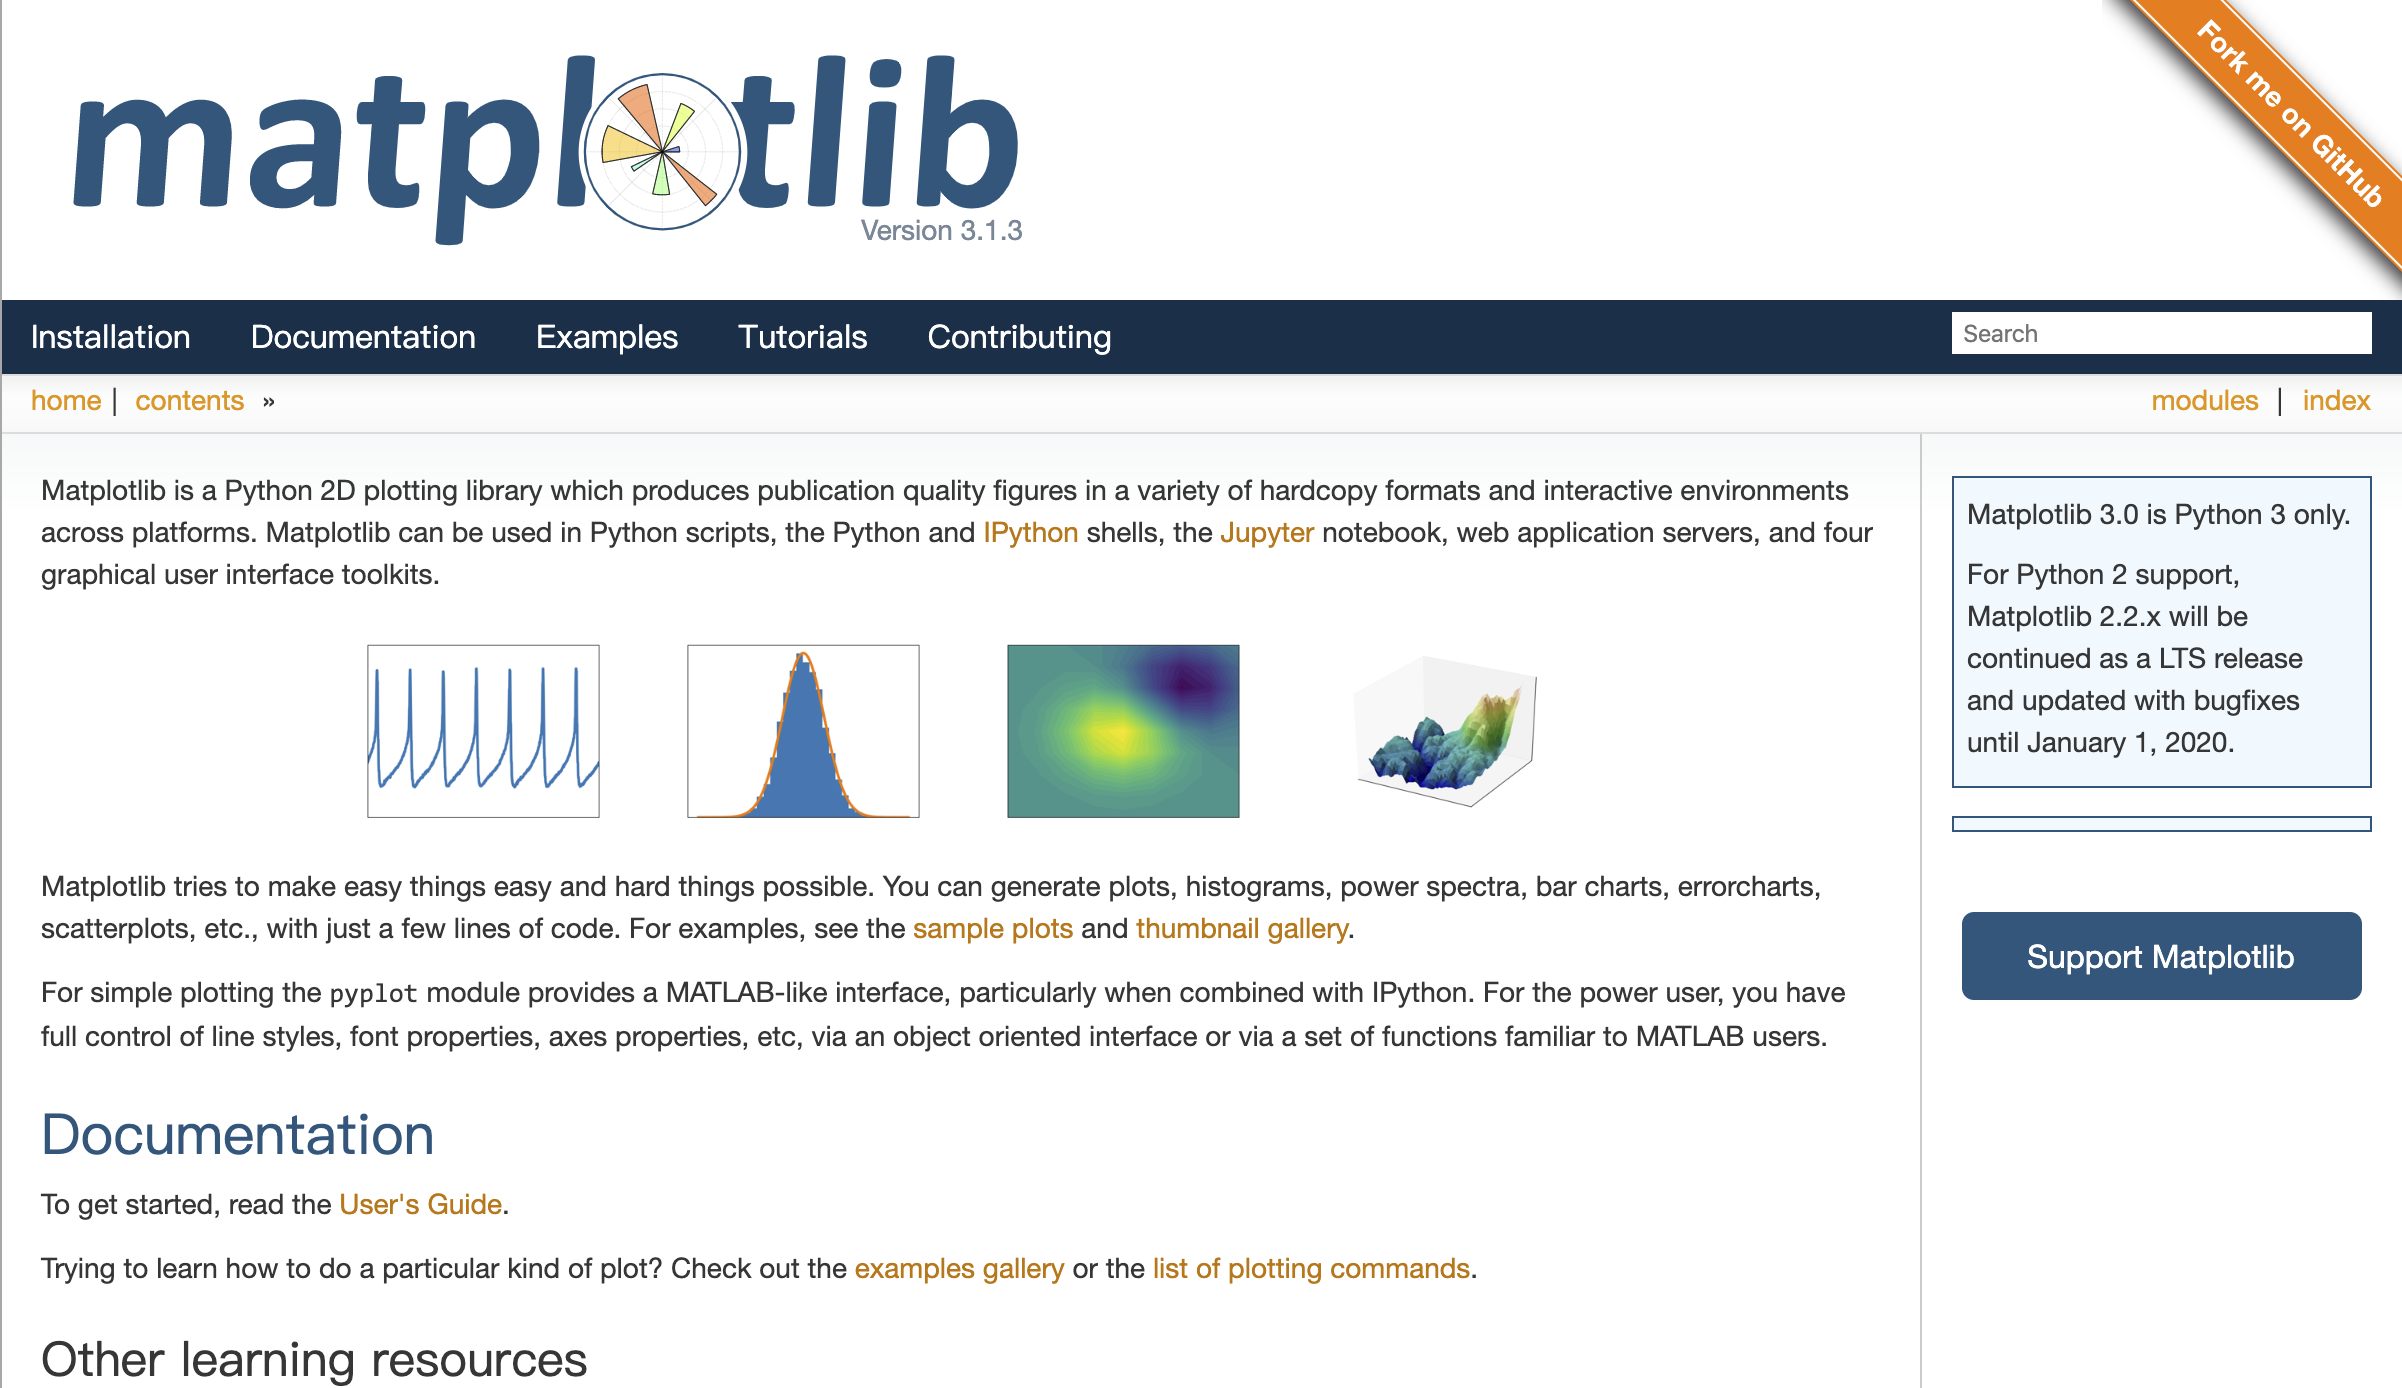
【数据可视化】Plotly https://zhuanlan.zhihu.com/p/60416273
csdn https://blog.csdn.net/shenfuli/article/details/91865810
知乎 https://zhuanlan.zhihu.com/p/60416273
【数据可视化】Seaborn http://seaborn.pydata.org/
Seaborn is a Python data visualization library based on matplotlib. It provides a high-level interface for drawing attractive and informative statistical graphics.
For a brief introduction to the ideas behind the library, you can read the introductory notes. Visit the installation page to see how you can download the package. You can browse the example gallery to see what you can do with seaborn, and then check out the tutorial and API reference to find out how.
To see the code or report a bug, please visit the github repository. General support issues are most at home on stackoverflow, where there is a seaborn tag.
简书 https://www.jianshu.com/p/94931255aede
**【机器学习】TensorFlow:
“TensorFlow是一个开源软件库,用于各种感知和语言理解任务的机器学习。当前被50个团队用于研究和生产许多Google商业产品,如语音识别、Gmail、Google 相册和搜索。”TensorFlow™ 是一个采用数据流图(data flow graphs),用于数值计算的开源软件库。节点(Nodes)在图中表示数学操作,图中的线(edges)则表示在节点间相互联系的多维数据数组,即张量(tensor)。它灵活的架构让你可以在多种平台上展开计算,例如台式计算机中的一个或多个CPU(或GPU),服务器,移动设备等等。TensorFlow 最初由Google大脑小组(隶属于Google机器智能研究机构)的研究员和工程师们开发出来,用于机器学习和深度神经网络方面的研究,但这个系统的通用性使其也可广泛用于其他计算领域。
TensorFlow中文社区 http://www.tensorfly.cn/
3、教程类
1⃣️【自学教程】4小时Python速成!Google内部培训资料
https://www.bilibili.com/video/av15854659?from=search&seid=429078319940538285
2⃣️【 数据可视化 】如何做数据可视化?(中文)
https://www.bilibili.com/video/av14732029/?spm_id_from=trigger_reload
print ("hello world")

若有收获,就点个赞吧
0 人点赞
