一、安装go
- 解压安装
# tar -C /usr/local/ -xvf go1.14.1.linux-amd64.tar.gz
配置环境变量
# vim /etc/profileexport PATH=$PATH:/usr/local/go/bin# source /etc/profile
验证
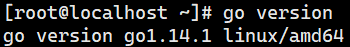
二、安装prometheus
- 安装
# tar -C /usr/local/ -xvf prometheus-2.17.1.linux-amd64.tar.gz# mv /usr/local/prometheus-2.6.0.linux-amd64/ /usr/local/Prometheus
- 创建服务脚本
```bash
cd /usr/lib/systemd/system
vim prometheus.service
[Unit] Description=Prometheus Documentation=https://prometheus.io/ After=network.target
[Service]
Type设置为notify时,服务会不断重启
Type=simple User=root Group=root
—storage.tsdb.path是可选项,默认数据目录在运行目录的./dada目录中
ExecStart=/usr/local/prometheus/prometheus —config.file=/usr/local/prometheus/prometheus.yml Restart=on-failure
[Install] WantedBy=multi-user.target
3. 启动prometheus`# systemctl daemon-reload `<br />`# systemctl enable prometheus.service `<br />`# systemctl start prometheus.service `<br />`# systemctl status prometheus `4. 验证浏览器打开IP:9090端口即可打开普罗米修斯自带的监控页面<br />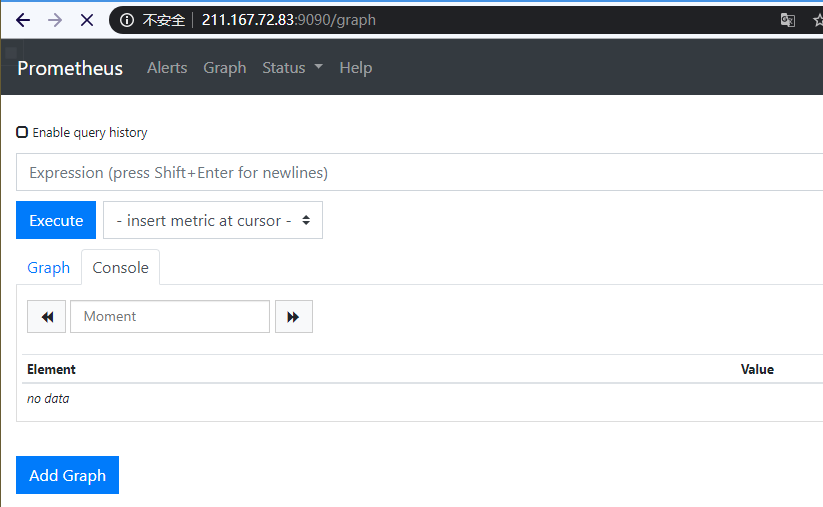<a name="1sO3s"></a># 三、安装grafana-server- [下载链接](https://grafana.com/grafana/download)1. 安装`# rpm -ivh grafana-6.7.2-1.x86_64.rpm`2. 启动`# systemctl enable grafana-server.service`<br />`# systemctl start grafana-server.service`3. 访问grafana浏览器访问IP:3000端口,即可打开grafana页面,默认用户名密码都是admin,初次登录会要求修改默认的登录密码<br />4. 添加prometheus数据源- 点击主界面的“Add data source”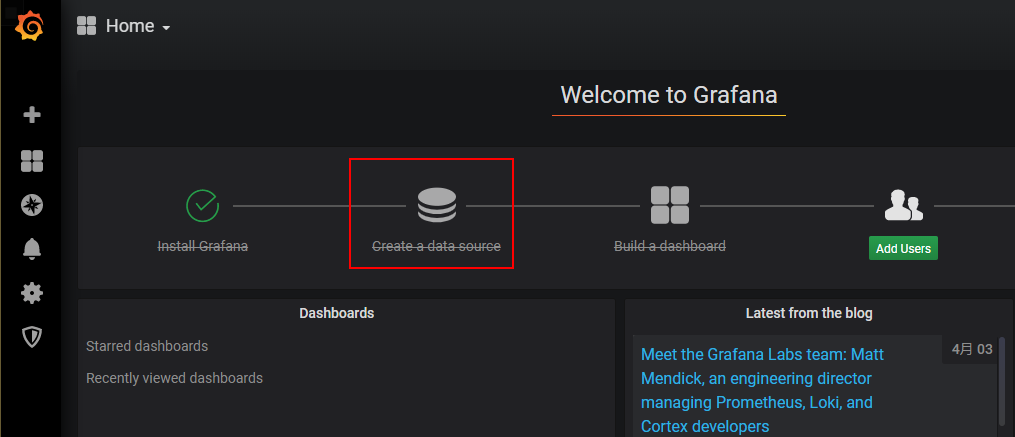- 选择prometheus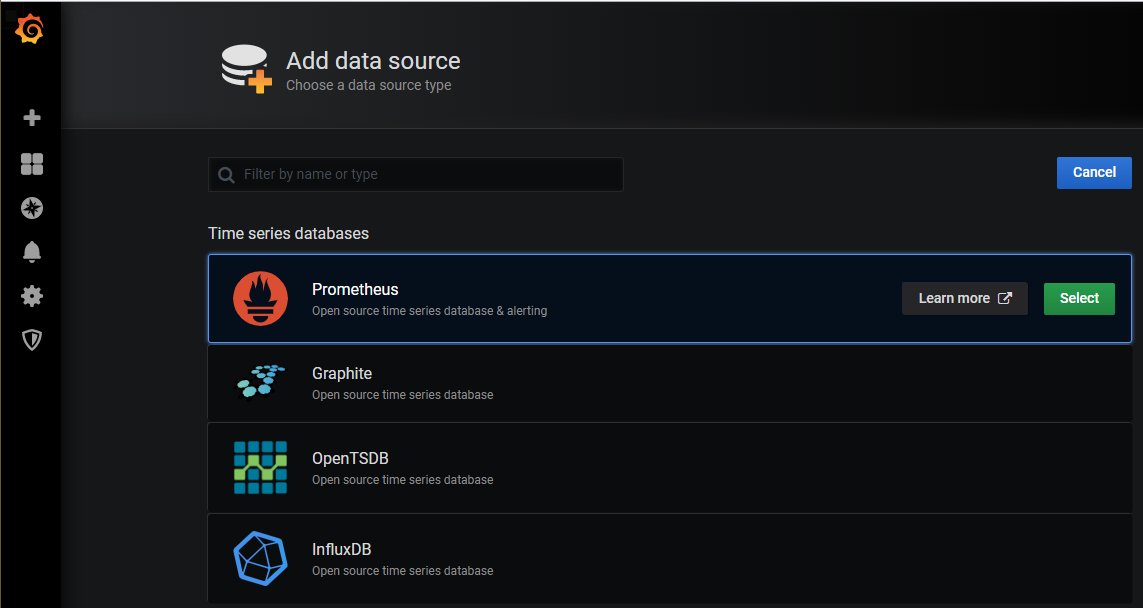- 添加url地址并保存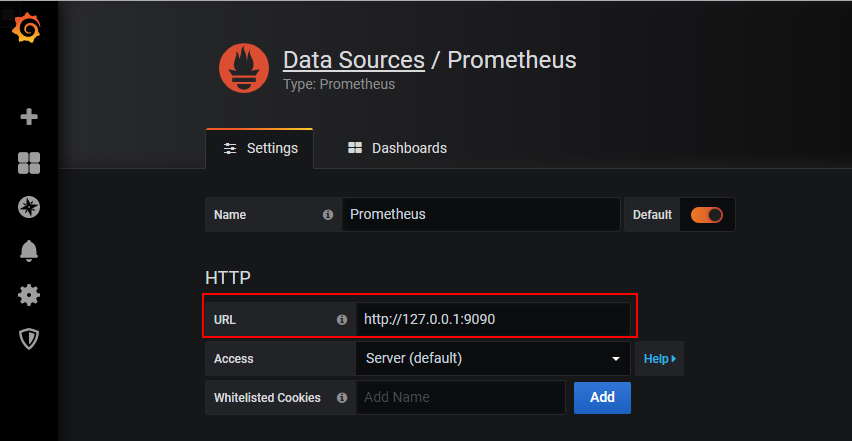- 添加dashboard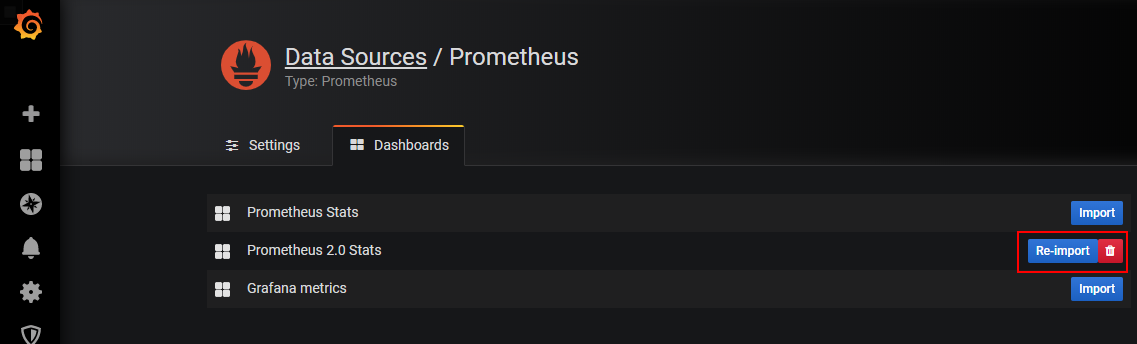- 查看仪表盘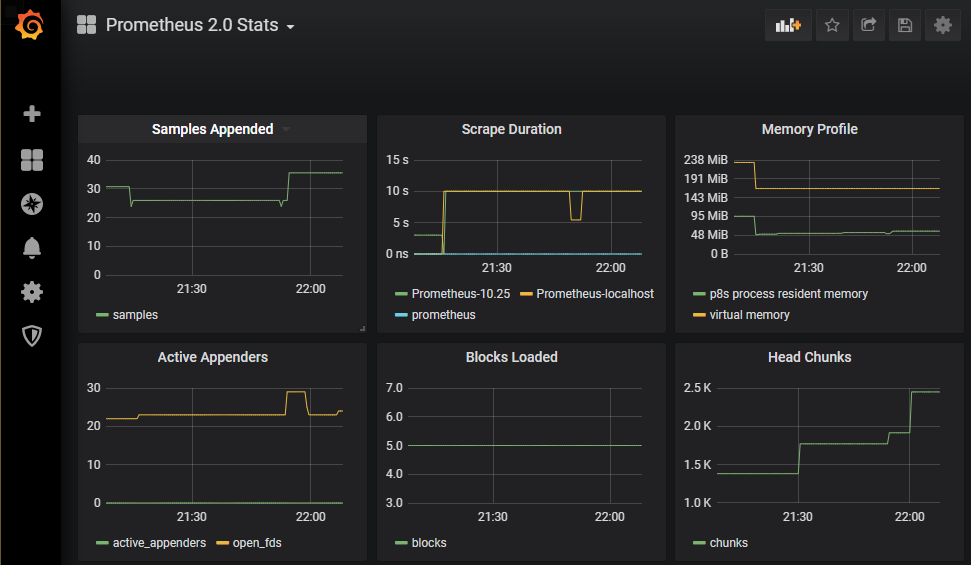<a name="PQiKL"></a># 四、使用node-exporter监控linux主机1. 被监控的机器安装node-exporter`# tar -zxvf node_exporter-0.18.1.linux-amd64.tar.gz` <br />`# mv node_exporter-0.18.1.linux-amd64 /usr/local/node_exporter`2. 创建服务脚本```bash# cd /usr/lib/systemd/system# vim node_exporter.service[Unit]Description=node_exporterAfter=network.target[Service]Type=simpleUser=rootExecStart=/usr/local/node_exporter/node_exporterRestart=on-failure[Install]WantedBy=multi-user.target
- 启动node_exporter
# systemctl daemon-reload# systemctl enable node_exporter.service# systemctl start node_exporter.service# systemctl status node_exporter.service
- prometheus服务端添加监控项,然后重启prometheus
# vim /usr/local/Prometheus/prometheus.yml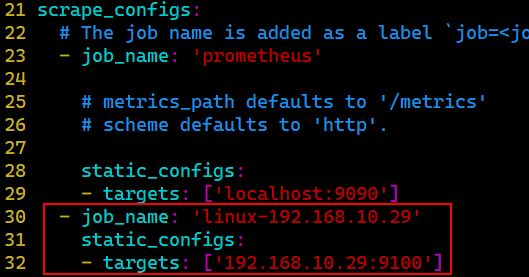
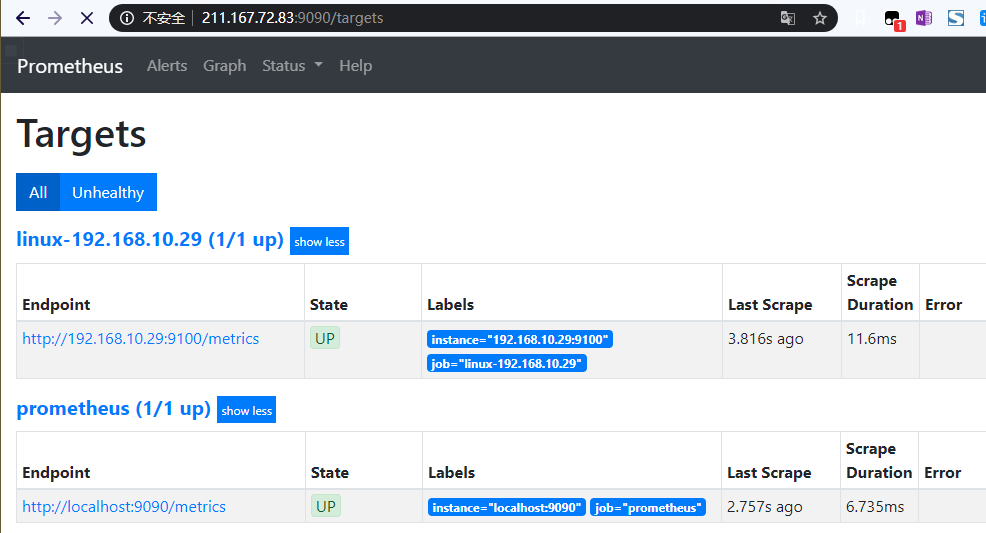
- 查看prometheus web界面——status——targets
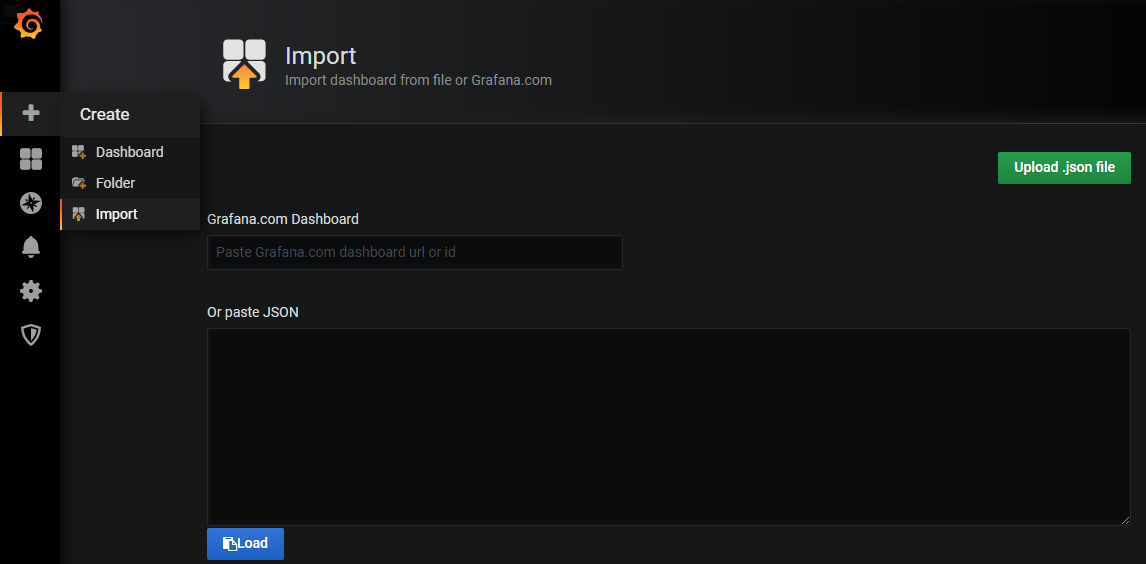
- grafana导入自定义的dashboard
- 参考链接
- 创建自定义dashboard,选择导入
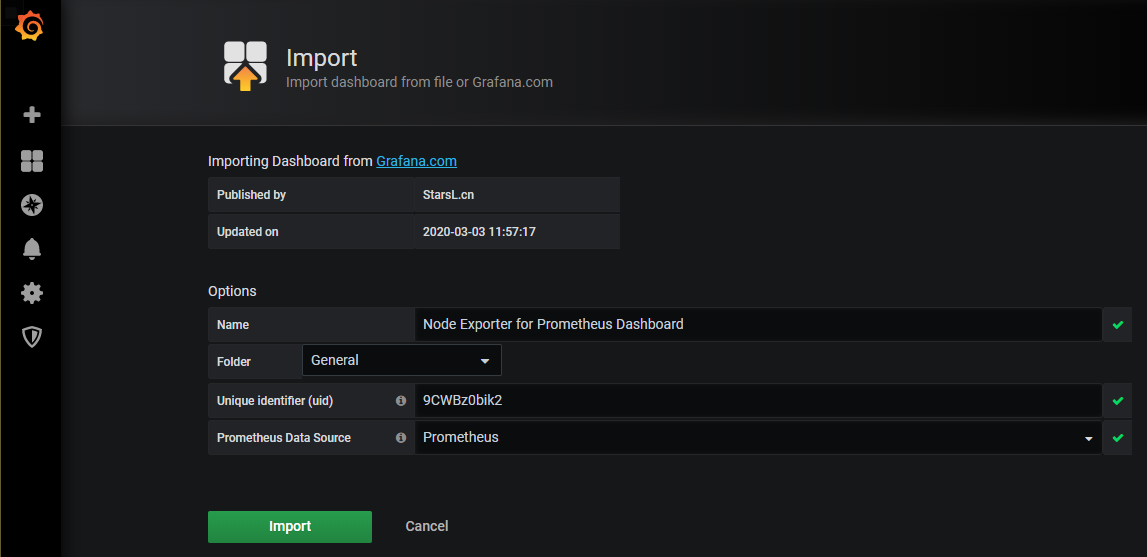
- 配置数据源,dashboard名称
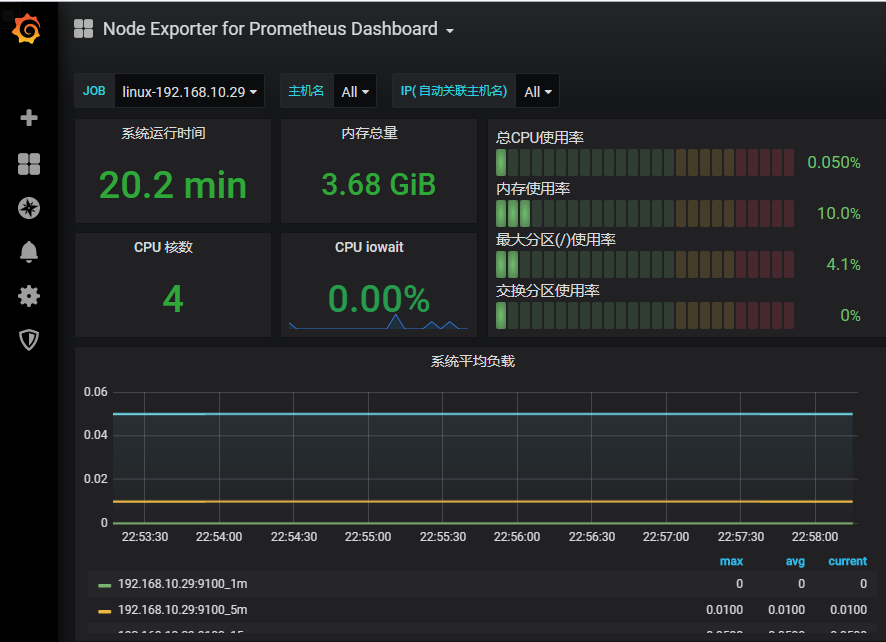
- 查看dashboard
五、监控windows机器(wmi-exporter)
- 下载地址(下载msi格式安装包)
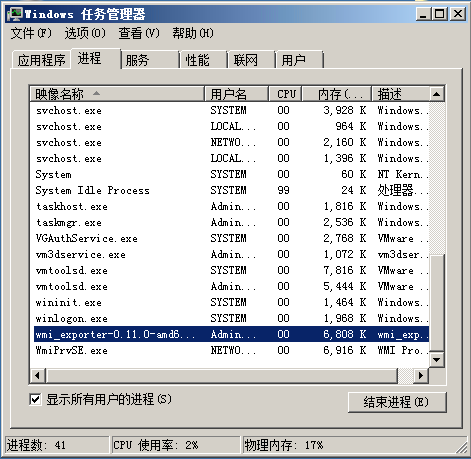
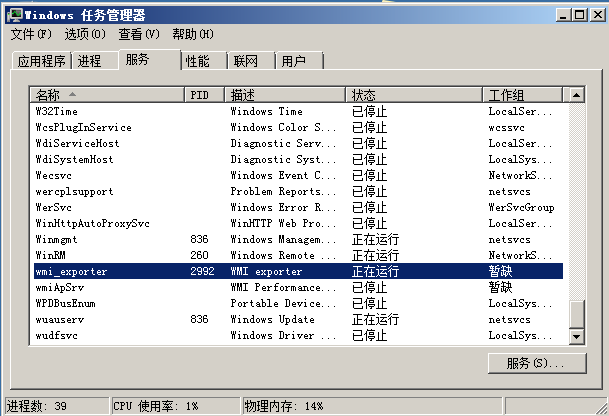
- 被监控windows机器安装wmi-exporter,会自动创建一个开机自启的服务
- prometheus服务端添加监控项,然后重启prometheus
# vim /usr/local/Prometheus/prometheus.yml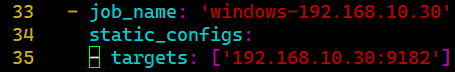
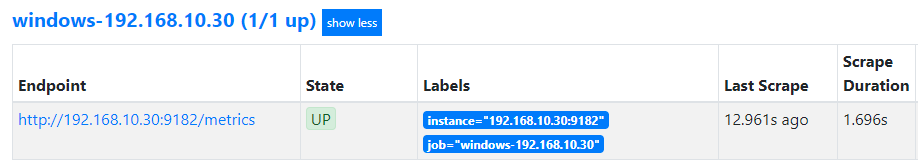
- 查看prometheus web界面——status——targets
- grafana导入自定义的dashboard

若有收获,就点个赞吧
0 人点赞
