Debugging IDAPython Scripts
While IDAPython is extremely useful, it can be a bit of a hassle to debug IDA Pro plugins.
This tutorial will give get you started on debugging IDAPython scripts and plugins
using Python Tools for Visual Studio.
And yes, it is completely free.
The Setup
For this tutorial, we will be using the following software:
IDA Pro 6.8Visual Studio Community_Python Tools for Visual Studio, documentation can be foundhere <https://github.com/Microsoft/PTVS/wiki>.Python’s
ptvsdmodule. Install usingpip install ptvsd.The following plugin:
.. code:: python# filename: ptvsd_enable.pyimport idaapiimport ptvsdtry:# Enable the debugger. Raises exception if called more than once.ptvsd.enable_attach(secret="IDA")except:passclass DebugPlugin(idaapi.plugin_t):flags = idaapi.PLUGIN_FIXcomment = "PTVSD Debug Enable"help = "Enable debugging using PTVSD"wanted_name = "PTVSD"wanted_hotkey = ""def init(self):return idaapi.PLUGIN_KEEPdef term(self):passdef run(self, arg):passdef PLUGIN_ENTRY():return DebugPlugin()
For the purposes of this tutorial, you can try and debug this plugin:
# filename: sample_debuggee.pyimport idaapidef my_debugged_function():# Set breakpoint here!passclass SamplePlugin(idaapi.plugin_t):flags = idaapi.PLUGIN_PROCcomment = "Sample Debuggee"help = "Sample Debuggee"wanted_name = "Sample Debuggee"wanted_hotkey = "Shift+D"def init(self):return idaapi.PLUGIN_KEEPdef term(self):passdef run(self, arg):my_debugged_function()def PLUGIN_ENTRY():return SamplePlugin()
Debugging
Put
ptvsd_enable.py(provided above) in IDA’s plugins directory.
If you want to use the sample debuggee, put it in the plugins directory as well.Start IDA and load an IDB (otherwise weird issues arise)
Load the code you want to debug into Visual Studio and set breakpoints.
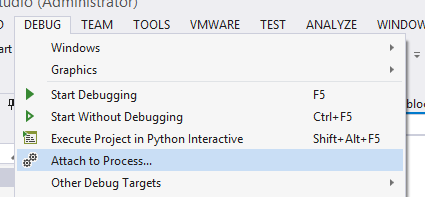
In Visual Studio (with the plugin file open), use
DEBUG->Attach to process
- In the dialog, select
idaq.exeand clickAttach
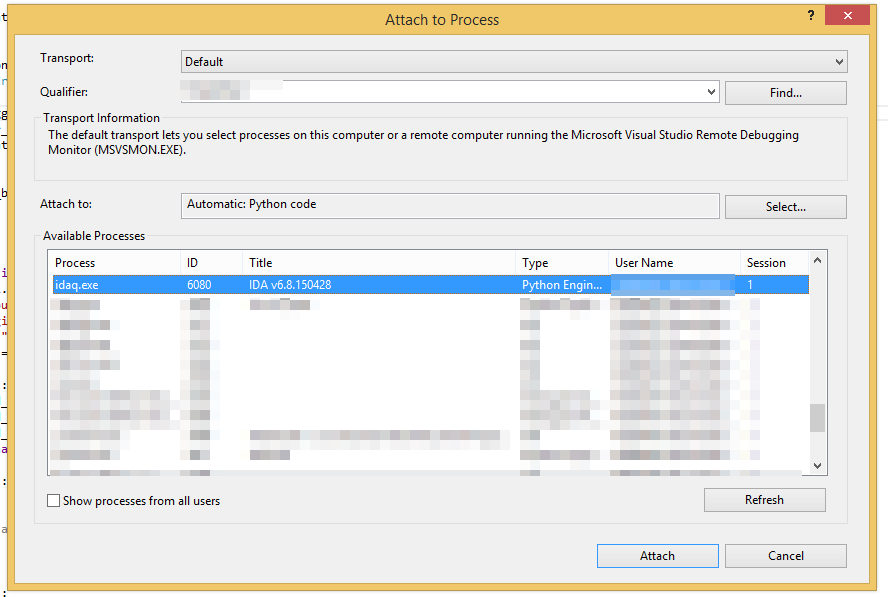
- We are now attached. Once a breakpoint is hit, Visual Studio will break and let you debug.
- Have fun debugging!
Important Notes
When debugging (breaking and stepping), IDA will be frozen.
Load your IDB prior to attaching the debugger.
For easy debug-on-demand, keep
ptvsd_enable.pyin IDA’s plugins directory at all times.To set breakpoints, make sure you load into VS the files that are actually loaded by IDA.
If you find any issues with the tutorial, please submit them here <https://github.com/tmr232/Sark/issues>_.
.. IDA Pro 6.8: https://www.hex-rays.com/products/ida/index.shtml
.. Visual Studio Community: https://www.visualstudio.com/en-us/products/visual-studio-community-vs.aspx
.. _Python Tools for Visual Studio: https://pytools.codeplex.com/releases

若有收获,就点个赞吧
0 人点赞
