Prometheus自带的数据展示页面功能比较的少,选择使用grafana数据大屏软件来展示相关的数据。
1、部署grafana
1、下载Grafana[root@VM-0-16-centos ~]# wget https://mirrors.tuna.tsinghua.edu.cn/grafana/yum/rpm/grafana-8.4.6-1.x86_64.rpm2、安装[root@VM-0-16-centos ~]# yum install grafana-8.4.6-1.x86_64.rpm -y3、启动[root@VM-0-16-centos ~]# systemctl start grafana-server4、测试是否启动默认的用户名和密码全部都是:admin
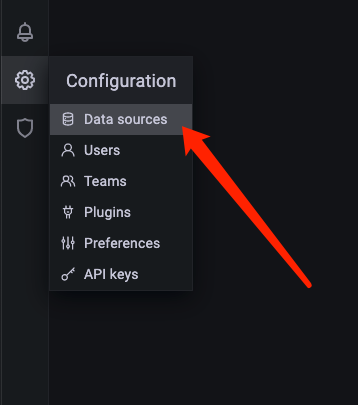
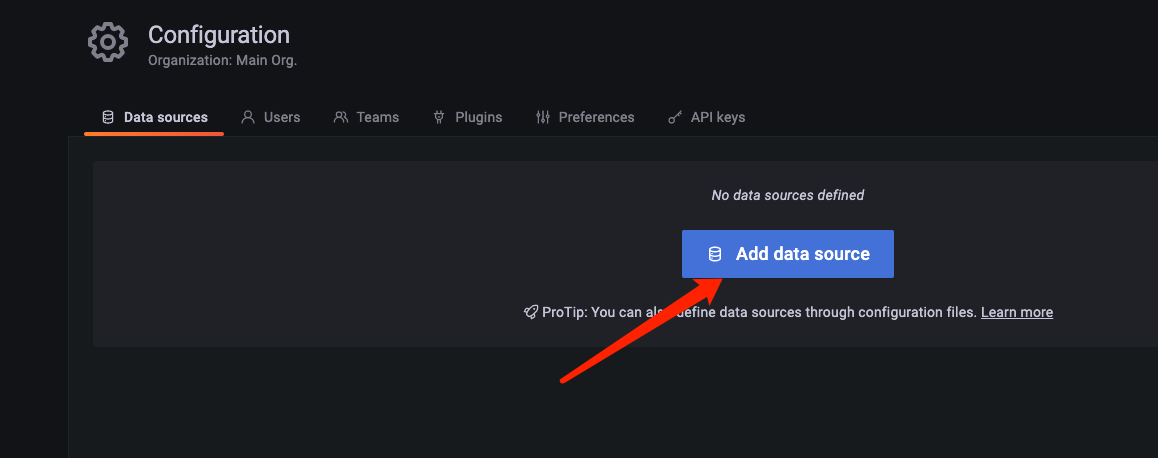
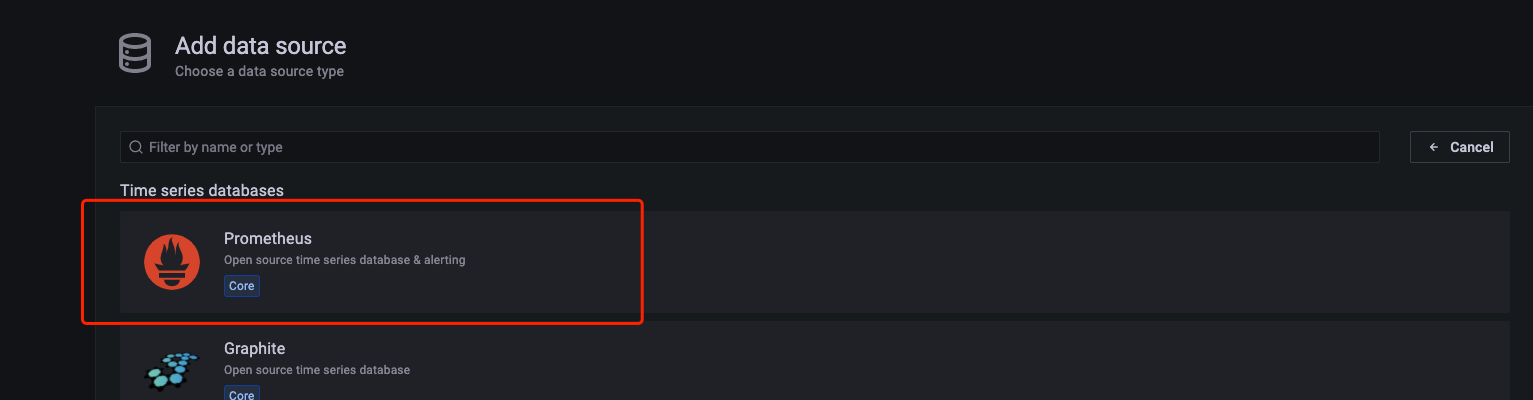
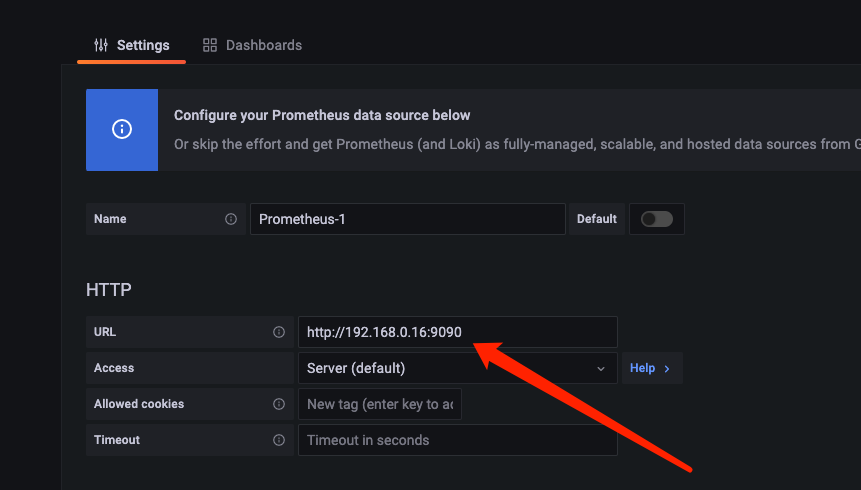
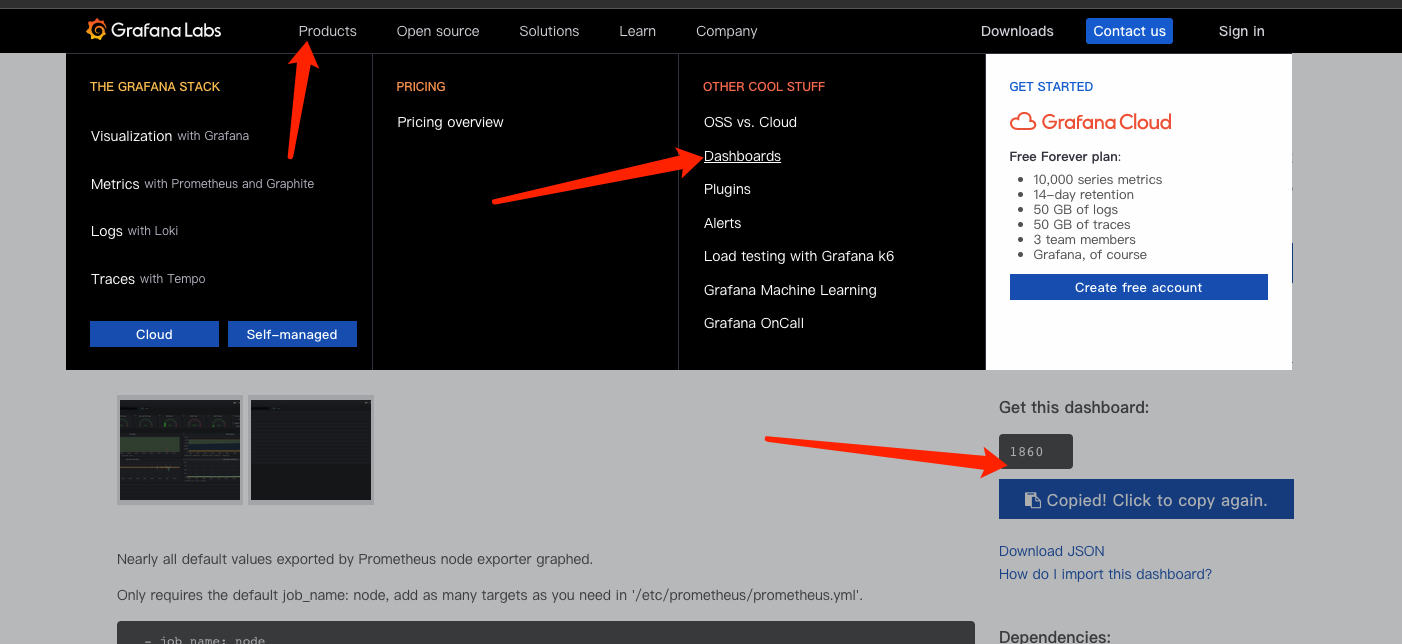
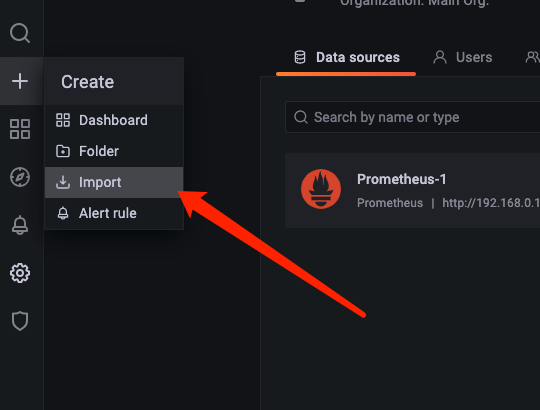
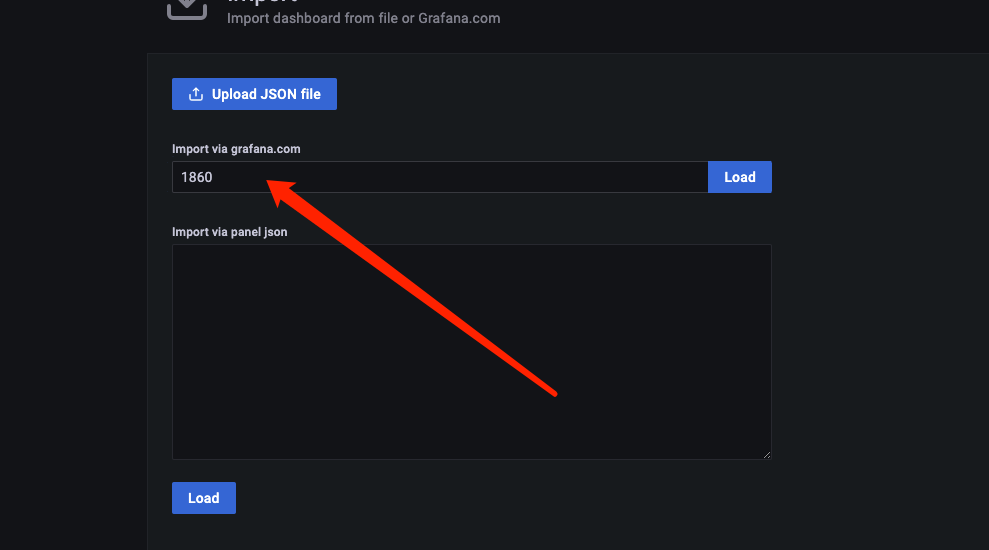
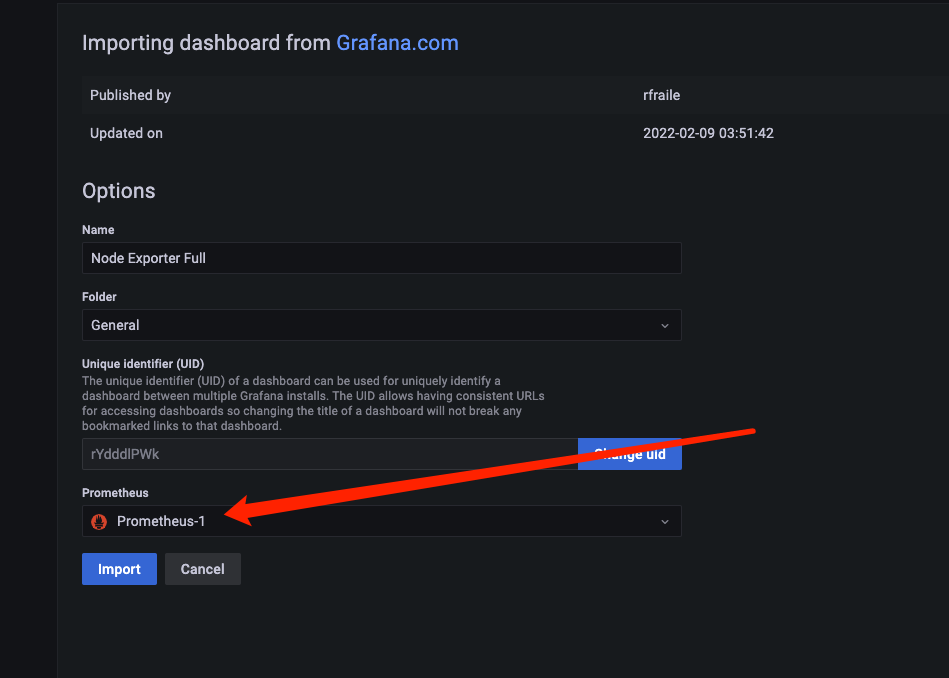
2、关联grafana和prometheus

若有收获,就点个赞吧
0 人点赞
