- split the instances in the dataset into homogeneous sets with respect to the target feature value
- Entropy is related to the probability of an outcome.
- High probability → Low entropy
- Low probability → High entropy
Entropy
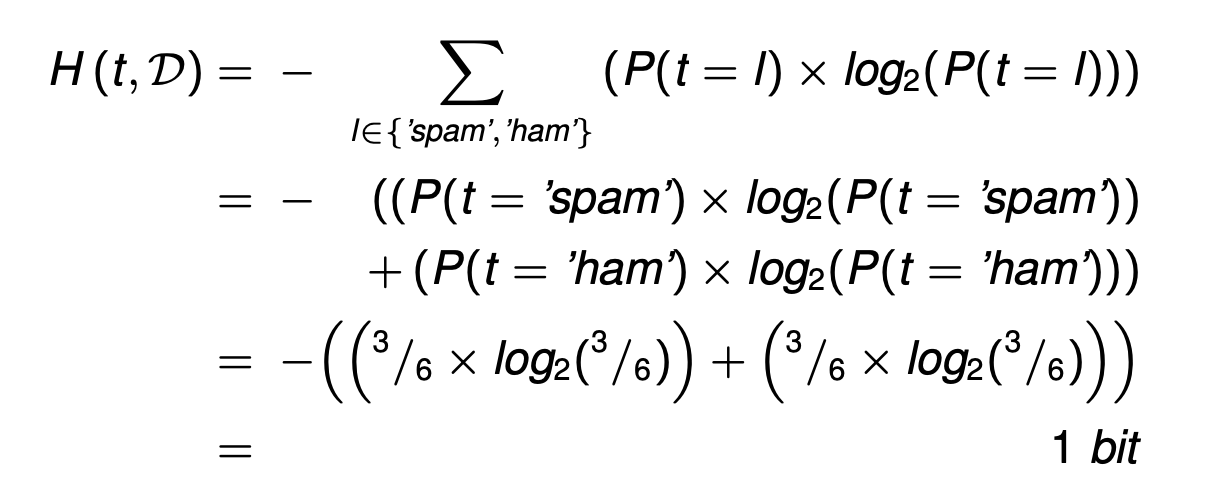
Shannon’s model of entropy is a weighted sum of the logs of the probabilities of each possible outcome when we make a random selection from a set.


Information gain
The information gain of a descriptive feature can be understood as a measure of the reduction in the overall entropy of a prediction task by testing on that feature.
举例:
- Calculate the entropy for the target feature in the dataset
- Calculate the remainder for the SUSPICIOUS WORDS feature in the dataset

- Calculate the remainder for the UNKNOWN SENDER feature in the dataset
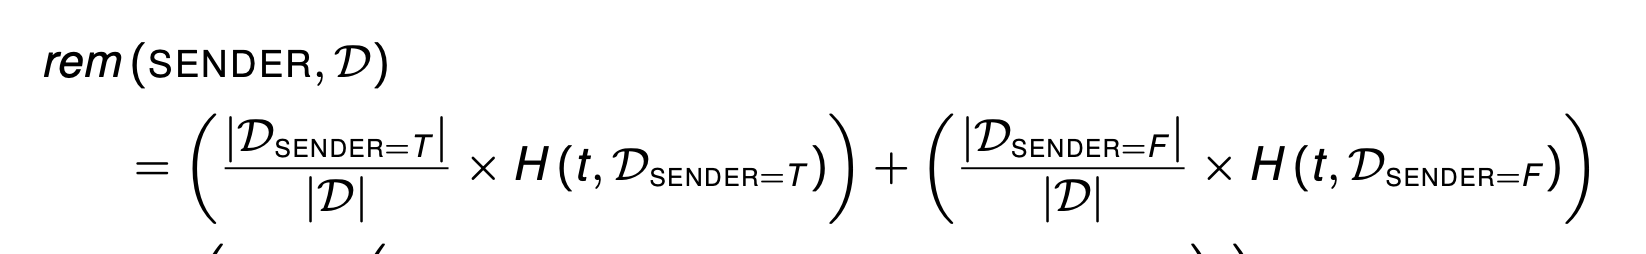
- Calculate the remainder for the CONTAINS IMAGES feature in the dataset.

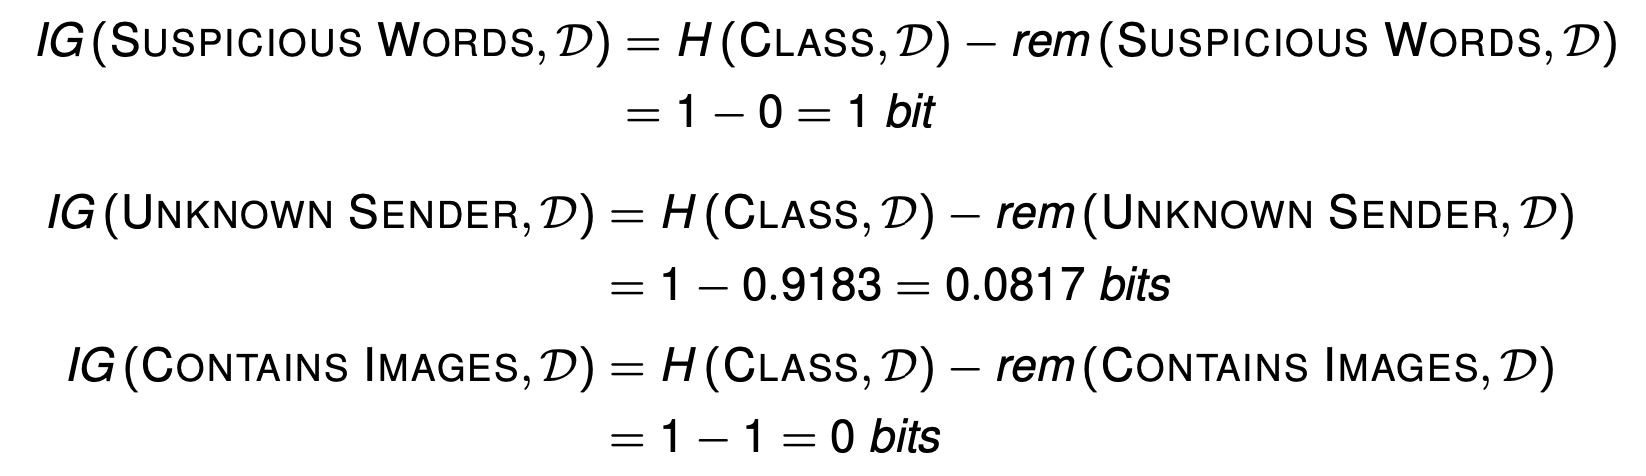
- Calculate the information gain for the three descriptive feature in the dataset.
The ID3 Algorithm
Attempts to create the shallowest tree that is consistent with the data that it is given
using information gain
举例:


1.5 (4/7) + 0.9183 (3/7) = 1.2507 0.3060 = 1.5567 - 1.2507
Evaluation 对应的info gain 最大
对于D7来说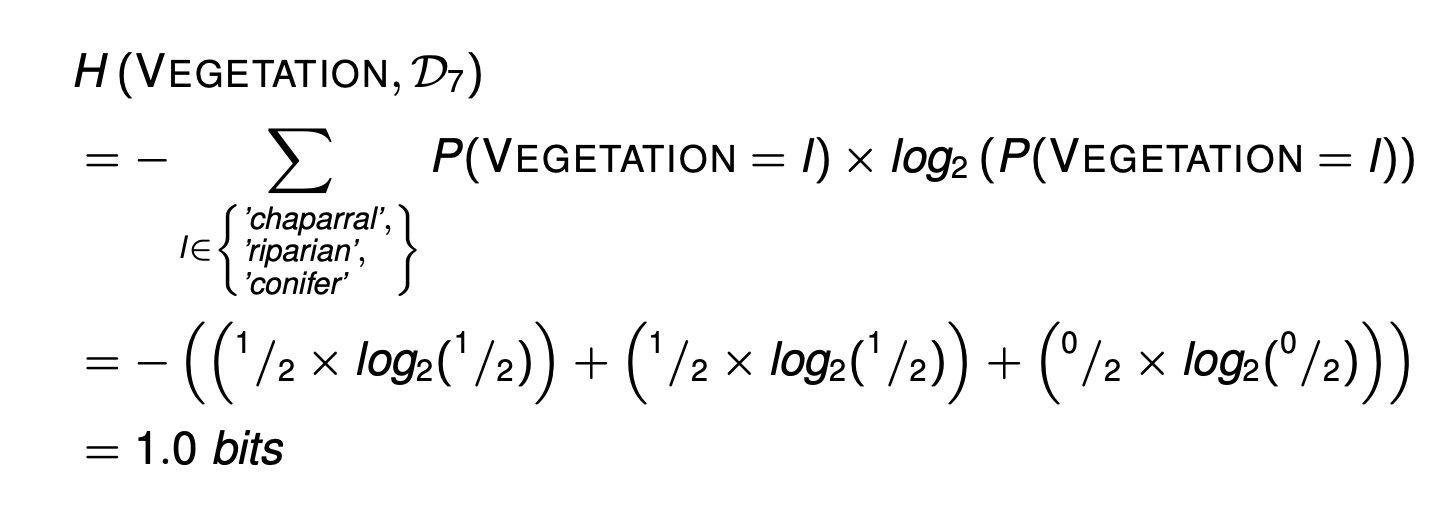


Information gain ratio
- Entropy based information gain, preferences features with many values.
- is computed by dividing the information gain of a feature by the amount of information used to determine the value of the feature


Gini index

- The Gini index can be thought of as calculating how often you would misclassify an instance in the dataset if you classified it based on the distribution of classifications in the dataset
- Information gain can be calculated using the Gini index by replacing the entropy measure with the Gini index.


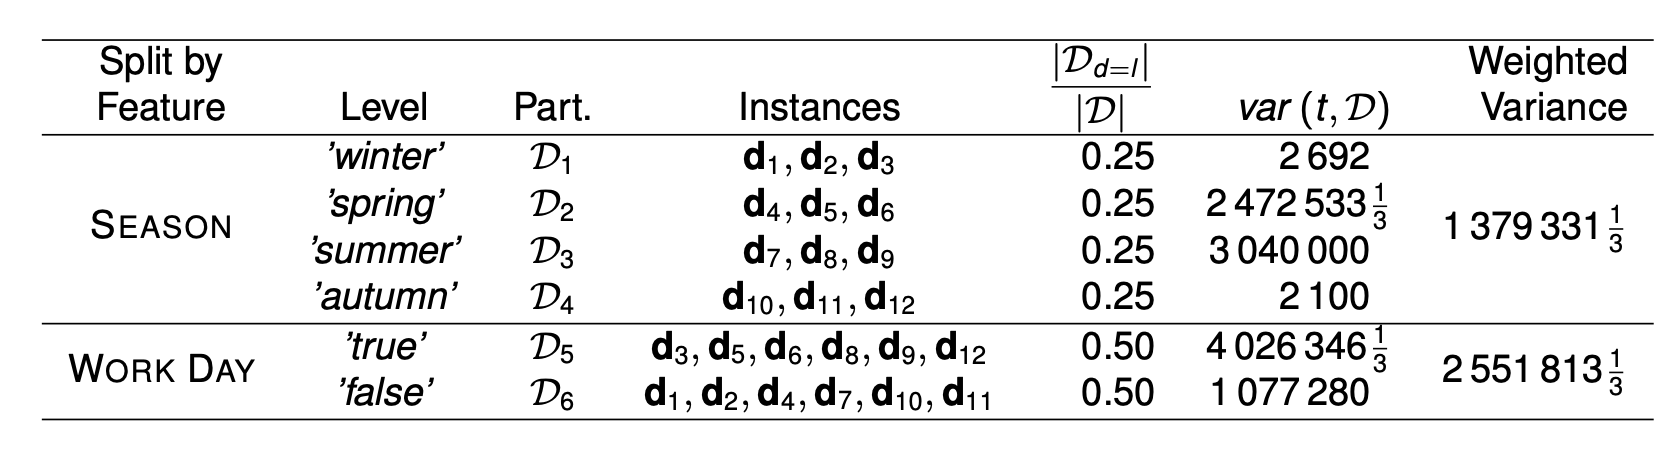
Predicting Continuous Targets
- Regression trees are constructed so as to reduce the variance in the set of training examples at each of the leaf nodes in the tree
- adapt the ID3 algorithm to use a measure of variance rather than a measure of classification impurity (entropy) when selecting the best attribute
- The impurity (variance) at a node can be calculated using the following equation:

- We select the feature to split on at a node by selecting the feature that minimizes the weighted variance across the resulting partitions

Decision Trees: Advantages and Potential Disadvantages
advantages
- interpretable.
- handle both categorical and continuous descriptive features.
- has the ability to model the interactions between descriptive features (diminished if pre-pruning is employed)
- relatively, robust to the curse of dimensionality. relatively,
robust to noise in the dataset if pruning is used
Disadvantages
trees become large when dealing with continuous features.
- decision trees are very expressive and sensitive to the dataset, as a result they can overfit the data if there are a lot of features (curse of dimensionality)
- eager learner (concept drift)

若有收获,就点个赞吧
0 人点赞
