接到小伙伴的决策树代码实现需求,为了在windows环境下愉快的调试并输出结果,调整了下环境细节。现在将整个过程记录并分享
环境
- win10
- VsCode
- GitHub Desktop
- python3.8
VsCode配置
- vscode配置ptyhon
Ctrl+Shift+X打开应用商店搜索安装python就OK了
- vscode配置jupyter
- vscode配置graphviz
GitHub Desktop配置
vscode的github插件有点感人,安利个GitHub Desktop
- 下载、登录~~似乎没啥介绍的
- 便捷同步github库、打开IDE、排除同步文件、快速建代码仓
Ctrl+P同步、Ctrl+Shift+A…. 必要快捷键,界面上有提示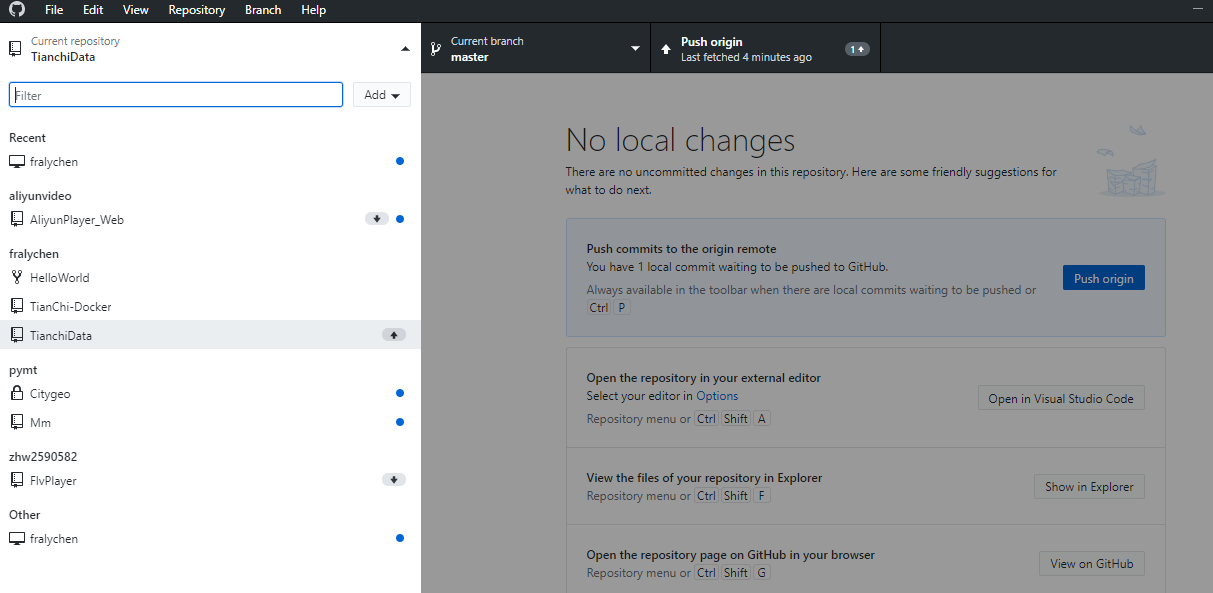
通过jupyter导出的代码
tips: jupyter调试好的code可以直接通过角标导出

# To add a new cell, type '# %%'# To add a new markdown cell, type '# %% [markdown]'# %%import numpy as npimport pandas as pdimport matplotlibimport matplotlib.pyplot as pltfrom sklearn import treefrom sklearn.tree import DecisionTreeClassifier as DTC, export_graphvizimport pydotimport pydotplusimport timefrom IPython.display import Image# %%Train_data = pd.read_csv('./datalab/car_info_test.csv')Train_data.info()# %%Train_data# %%# 筛选数值特征列numerical_cols = Train_data.select_dtypes(exclude = 'object').columnsprint(numerical_cols)# %%# 对部分特征列进行分类Train_data['CUST_AGE'] = Train_data.CUST_AGE.apply(lambda x: 1 if (x<=35 and x >=16) else 2 if (x >= 36 and x <= 60) else 3)Train_data['CAR_AGE'] = Train_data.CAR_AGE.apply(lambda x: 1 if (x <=730) else 2 if (x >=731 and x <= 1460) else 3 if (x >= 1461 and x <= 2190) else 4 if (x >= 2191 and x <= 3650) else 5)Train_data['CAR_PRICE'] = Train_data.CAR_PRICE.apply(lambda x: 1 if (x >=50000 and x <= 90000) else 2 if (x >= 90001 and x<= 150000) else 3 if (x >= 150001 and x <= 300000) else 4)Train_data['LOAN_AMOUNT'] = Train_data.LOAN_AMOUNT.apply(lambda x: 1 if (x <= 50000) else 2 if(x >=50001 and x <= 200000) else 3 if(x >= 200001 and x <= 500000) else 4)# %%Train_data.head()# %%# 查看是否有空值特征列Train_data.isnull().any()# %%# 从数值特种列中区分 data 和 taeget(标记的特征)feature_cols = [col for col in numerical_cols if col != 'IS_LOST']data = Train_data[feature_cols].fillna(value=0)target = Train_data['IS_LOST']# %%# DecisionTreeClassifier 的决策树实现dtc = DTC(criterion='entropy',max_depth=6)dtc.fit(data, target)print('准确率:', dtc.score(data, target))# %%# 可视化展示dot_data = tree.export_graphviz(dtc, out_file=None,filled=True, rounded=True,special_characters=True)graph = pydotplus.graph_from_dot_data(dot_data)Image(graph.create_png())# %%# 输出为PDFimport pydotimport pydotpluswith open('./tree.dot', 'w') as f:f = export_graphviz(dtc, feature_names=data.columns, out_file=f)graph = pydotplus.graph_from_dot_file('./tree.dot')graph.write_pdf("iris.pdf")
效果展示

听说vim能舒爽到刷剧

若有收获,就点个赞吧
0 人点赞
