默认条形图
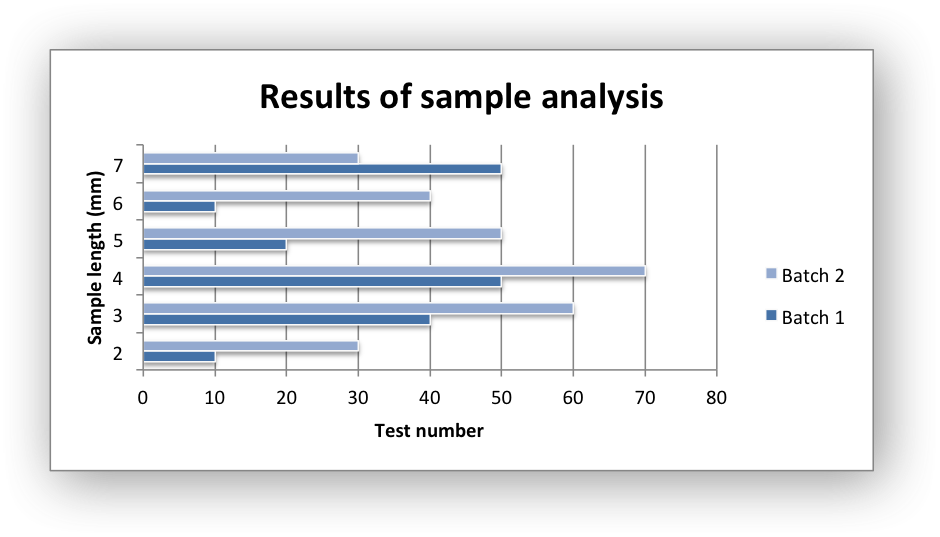
<?php declare(strict_types = 1);$config = ['path' => './tests',];$dataHeader = ['Number', 'Batch 1', 'Batch 2',];$dataRows = [[2, 10, 30],[3, 40, 60],[4, 50, 70],[5, 20, 50],[6, 10, 40],[7, 50, 30],];$fileObject = new \Vtiful\Kernel\Excel($config);$fileObject = $fileObject->fileName('tutorial.xlsx');$fileHandle = $fileObject->getHandle();$chart = new \Vtiful\Kernel\Chart($fileHandle, \Vtiful\Kernel\Chart::CHART_BAR);$chartResource = $chart// series(string $value [, string $category])->series('=Sheet1!$B$2:$B$7', '=Sheet1!$A$2:$A$7')->seriesName('=Sheet1!$B$1')->series('=Sheet1!$C$2:$C$7', '=Sheet1!$A$2:$A$7')->seriesName('=Sheet1!$C$1')->axisNameX('Test number')->axisNameY('Sample length (mm)')->title('Results of sample analysis')->style(11)->toResource();$filePath = $fileObject->header($dataHeader)->data($dataRows)->insertChart(0, 4, $chartResource)->output();
堆积条形图
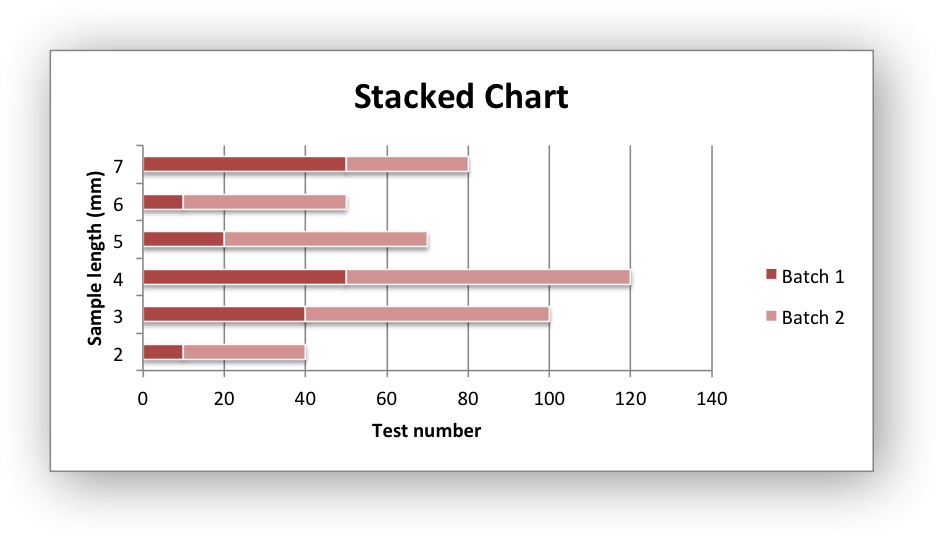
<?php declare(strict_types = 1);$config = ['path' => './tests',];$dataHeader = ['Number', 'Batch 1', 'Batch 2',];$dataRows = [[2, 10, 30],[3, 40, 60],[4, 50, 70],[5, 20, 50],[6, 10, 40],[7, 50, 30],];$fileObject = new \Vtiful\Kernel\Excel($config);$fileObject = $fileObject->fileName('tutorial.xlsx');$fileHandle = $fileObject->getHandle();$chart = new \Vtiful\Kernel\Chart($fileHandle, \Vtiful\Kernel\Chart::CHART_BAR_STACKED);$chartResource = $chart// series(string $value [, string $category])->series('=Sheet1!$B$2:$B$7', '=Sheet1!$A$2:$A$7')->seriesName('=Sheet1!$B$1')->series('=Sheet1!$C$2:$C$7', '=Sheet1!$A$2:$A$7')->seriesName('=Sheet1!$C$1')->axisNameX('Test number')->axisNameY('Sample length (mm)')->title('Results of sample analysis')->style(12)->toResource();$filePath = $fileObject->header($dataHeader)->data($dataRows)->insertChart(0, 4, $chartResource)->output();
百分比条形图
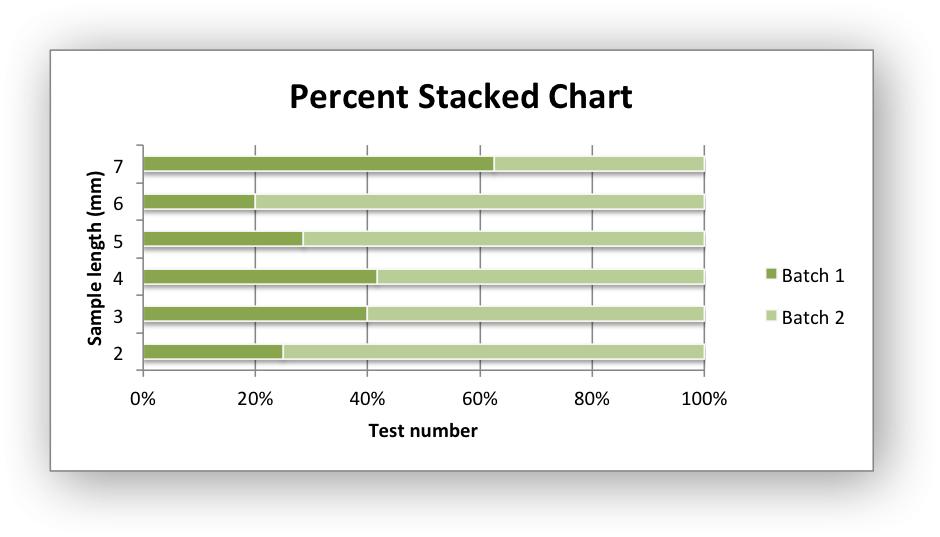
<?php declare(strict_types = 1);$config = ['path' => './tests',];$dataHeader = ['Number', 'Batch 1', 'Batch 2',];$dataRows = [[2, 10, 30],[3, 40, 60],[4, 50, 70],[5, 20, 50],[6, 10, 40],[7, 50, 30],];$fileObject = new \Vtiful\Kernel\Excel($config);$fileObject = $fileObject->fileName('tutorial.xlsx');$fileHandle = $fileObject->getHandle();$chart = new \Vtiful\Kernel\Chart($fileHandle, \Vtiful\Kernel\Chart::CHART_BAR_STACKED_PERCENT);$chartResource = $chart// series(string $value [, string $category])->series('=Sheet1!$B$2:$B$7', '=Sheet1!$A$2:$A$7')->seriesName('=Sheet1!$B$1')->series('=Sheet1!$C$2:$C$7', '=Sheet1!$A$2:$A$7')->seriesName('=Sheet1!$C$1')->axisNameX('Test number')->axisNameY('Sample length (mm)')->title('Results of sample analysis')->style(13)->toResource();$filePath = $fileObject->header($dataHeader)->data($dataRows)->insertChart(0, 4, $chartResource)->output();

若有收获,就点个赞吧
0 人点赞
