:::info
当你遇到以下类似问题而束手无策时,Arthas可以帮助你解决:
- 这个类从哪个 jar 包加载的?为什么会报各种类相关的 Exception?
- 我改的代码为什么没有执行到?难道是我没 commit?分支搞错了?
- 遇到问题无法在线上 debug,难道只能通过加日志再重新发布吗?
- 线上遇到某个用户的数据处理有问题,但线上同样无法 debug,线下无法重现!
- 是否有一个全局视角来查看系统的运行状况?
- 有什么办法可以监控到JVM的实时运行状态?
- 怎么快速定位应用的热点,生成火焰图?
- 怎样直接从JVM内查找某个类的实例? :::
Arthas 是Alibaba开源的Java诊断工具,深受开发者喜爱。Arthas支持JDK 6+,支持Linux/Mac/Windows,采用命令行交互模式,同时提供丰富的 Tab 自动补全功能,进一步方便进行问题的定位和诊断。
MAC演示
示例代码
package com.example.demo.controller;import lombok.extern.slf4j.Slf4j;import org.springframework.web.bind.annotation.GetMapping;import org.springframework.web.bind.annotation.RequestMapping;import org.springframework.web.bind.annotation.RestController;/*** @author zhaojiejun* @date 2022/4/5 6:43 PM**/@RestController@RequestMapping("/hello")@Slf4jpublic class HelloController {@GetMappingpublic String hello() {sleep();return "hello world";}private void sleep() {try {Thread.sleep(10);} catch (InterruptedException e) {log.error("sleep has occur error is :{}", e.getMessage());}}}
安装启动
使用arthas-boot(推荐)
下载arthas-boot.jar,然后用java-jar的方式启动:
curl -O https://arthas.aliyun.com/arthas-boot.jarjava -jar arthas-boot.jar
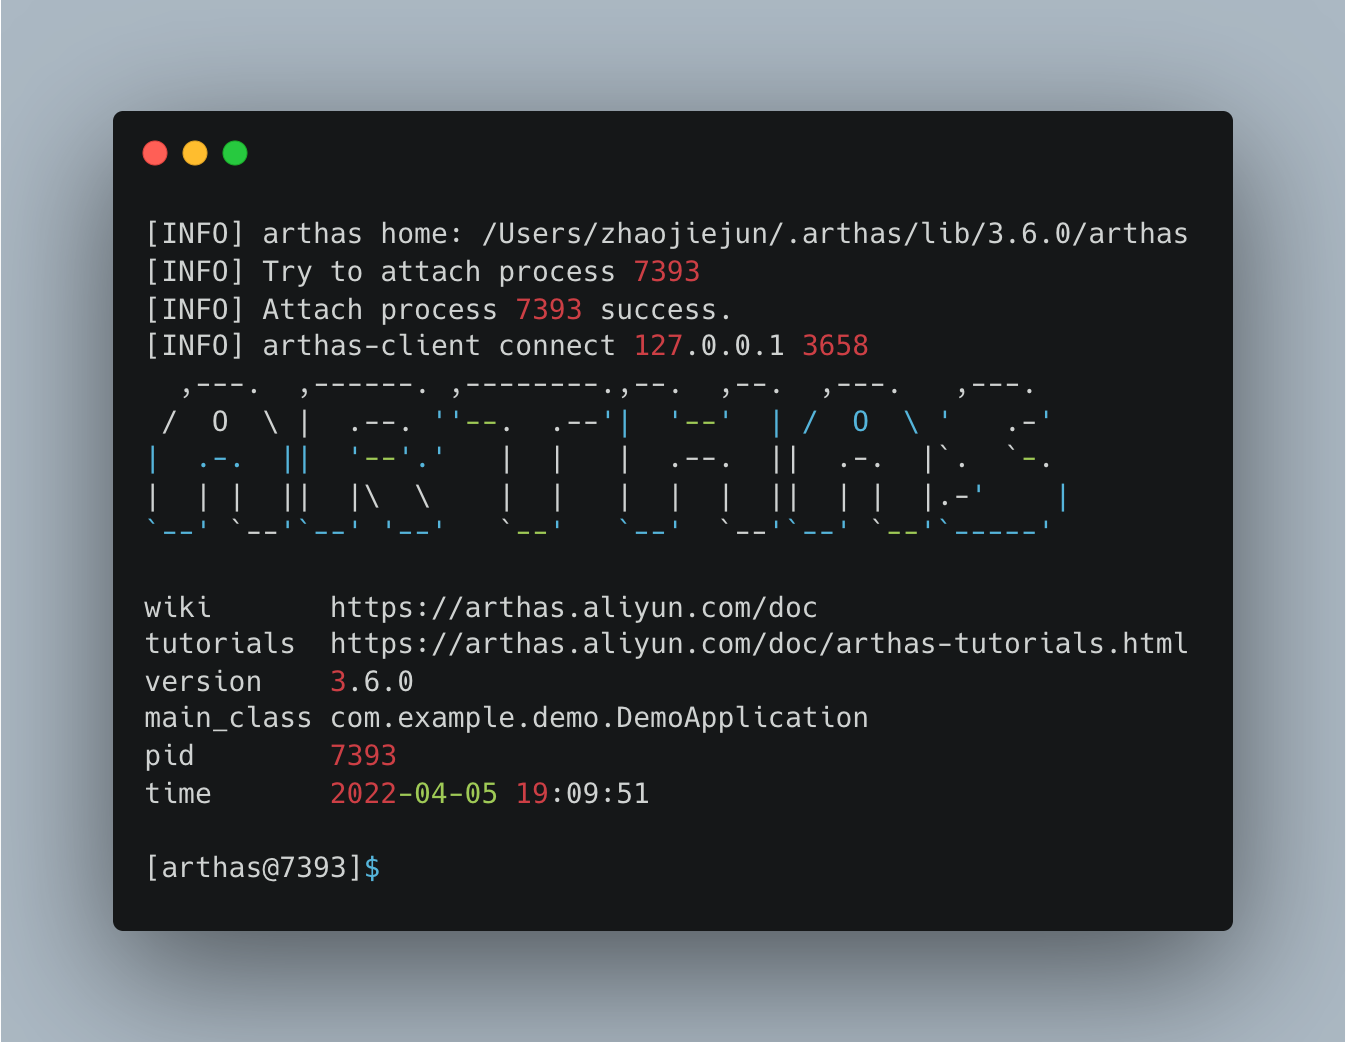
- 启动成功后,arthas 会自动识别当前正在运行的Java进程
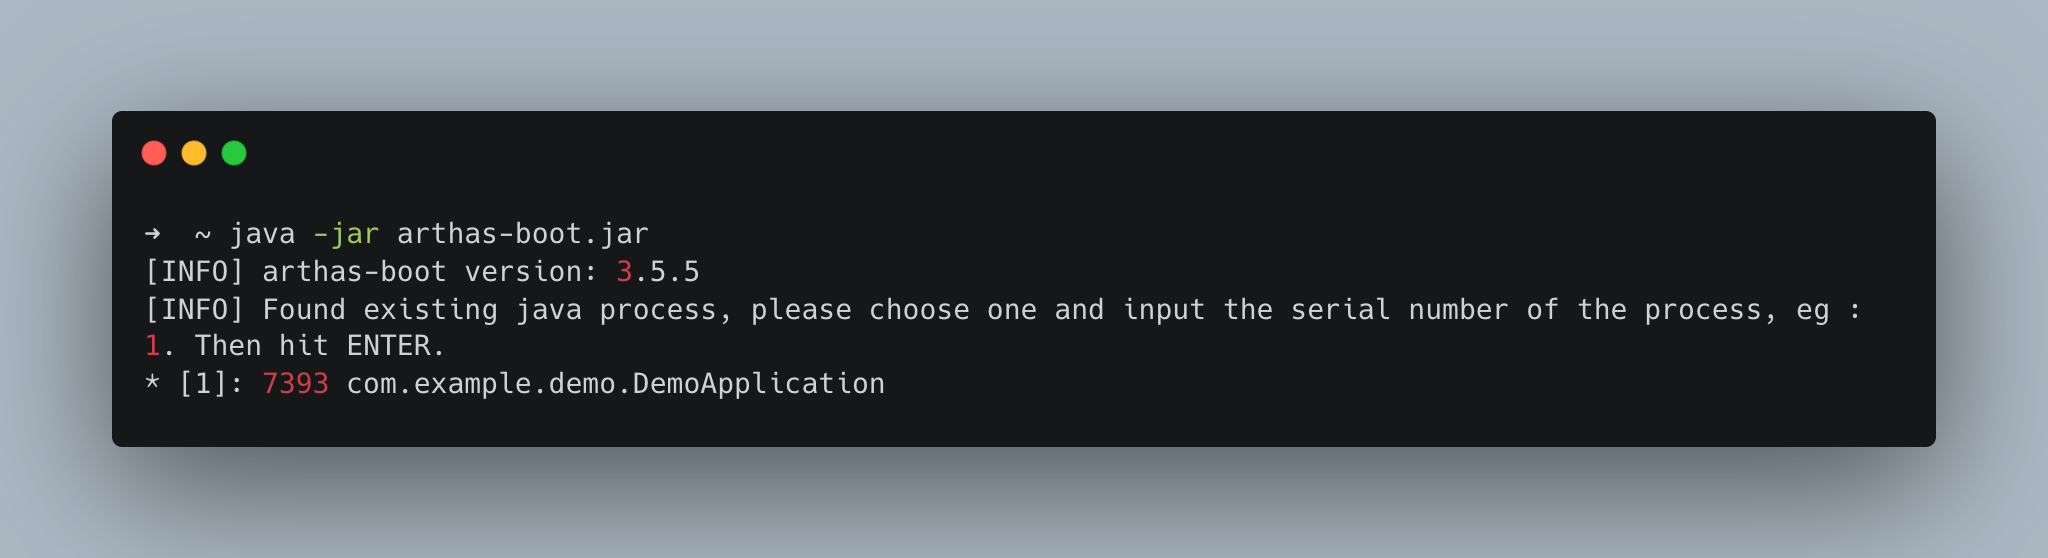
- 选择需要调试的Java程序pid,本次案例选择 [1]
常用功能演示
trace命令
:::info trace 命令能主动搜索 class-pattern/method-pattern 对应的方法调用路径,渲染和统计整个调用链路上的所有性能开销和追踪调用链路。 :::
官方使用说明:https://arthas.aliyun.com/doc/trace.html
[arthas@8519]$ trace com.example.demo.controller.HelloController hello手动调用
hello方法Affect(class count: 1 , method count: 1) cost in 104 ms, listenerId: 1 `---ts=2022-04-05 19:18:34;thread_name=http-nio-8080-exec-1;id=1b;is_daemon=true;priority=5;TCCL=org.springframework.boot.web.embedded.tomcat.TomcatEmbeddedWebappClassLoader@186cb891 `---[12.951623ms] com.example.demo.controller.HelloController:hello() `---[12.71279ms] com.example.demo.controller.HelloController:sleep() #19
可以看到19行的sleep方法是整个方法链中执行时间最长的,耗时12swatch命令
查看入参、返回值
watch ClassName MethodName '{params,returnObj}' -x 3
退出
quit命令, 退出当前 Arthas 客户端,其他 Arthas 客户端不受影响

若有收获,就点个赞吧
0 人点赞
