ELK日志分析系统
ELK介绍
1. 应用/需求前景
(1)业务发展越来越庞大,服务器越来越多;
(2)各种访问日志、应用日志、错误日志量越来越多,导致运维人员无法很好的去管理日志;
(3)开发人员排查问题,需要到服务器上查日志,不方便;
(4)运营人员需要一些数据,需要我们运维到服务器上分析日志
2. 为什么要用ELK
如果我们查看某些服务为什么错误,可以直接使用grep等命令进行查看,可是如果我们查看规模较大,日志较多的时候,此方法效率就小了很多。现在我们对待大规模的日志,解决思路是建立集中式日志收集系统,将所有节点上的日志统一收集,管理,访问。
一个完整的集中式日志系统,需要包含以下几个主要特点:
- 收集:能够采集多种来源的日志数据。
- 传输:能够稳定的把日志数据传输到中央系统。
- 存储:如何存储日志数据。
- 分析:可以支持 UI 分析。
- 警告:能够提供错误报告,监控机制。
而ELK则提供一整套的解决方案,并且都是开源软件,之间相互配合,完美衔接,高效的满足了很多场合的应用。
3. ELK 简介
ELK是3个开源软件的缩写,分别为Elasticsearch 、 Logstash和Kibana , 它们都是开源软件。不过现在还新增了一个Beats,它是一个轻量级的日志收集处理工具(Agent),Beats占用资源少,适合于在各个服务器上搜集日志后传输给Logstash,官方也推荐此工具,目前由于原本的ELK Stack成员中加入了Beats工具所以已改名为Elastic Stack。
Elasticsearch是个开源分布式搜索引擎,提供搜集、分析、存储数据3大功能。它的特点有:分布式,零配置,自动发现,索引自动分片,索引副本机制,restful风格接口,多数据源,自动搜索负载等。
Logstash主要是用来日志的搜集、分析、过滤日志的工具,支持大量的数据获取方式。一般工作方式为c/s架构,Client端安装在需要收集日志的主机上,server端负责将收到的各节点日志进行过滤、修改等操作在一并发往Elasticsearch上去。
Kibana也是一个开源和免费的工具,Kibana可以为 Logstash和 ElasticSearch提供的日志分析友好的 Web 界面,可以帮助汇总、分析和搜索重要数据日志。
Beats在这里是一个轻量级日志采集器,其实Beats家族有6个成员,早期的ELK架构中使用Logstash收集、解析日志,但是Logstash对内存、CPU、io等资源消耗比较高。相比 Logstash,Beats所占系统的CPU和内存几乎可以忽略不计。
4. 环境配置
1.节点规划
| 节点IP | 节点规划 | 主机名 |
|---|---|---|
| 192.168.200.10 | Elasticsearch+Kibana(主) | elk-1 |
| 192.168.200.20 | Elasticsearch+Logstash(数据) | elk-2 |
| 192.168.200.30 | Elasticsearch(数据) | elk-3 |
2. 修改主机名和关闭防火墙
三台机器都修改主机名和防火墙elk-1:[root@localhost ~]# sudo hostname elk-1[root@localhost ~]# bash[root@elk-1 ~]# systemctl stop firewalld[root@elk-1 ~]# systemctl disable firewalldRemoved symlink /etc/systemd/system/multi-user.target.wants/firewalld.service.Removed symlink /etc/systemd/system/dbus-org.fedoraproject.FirewallD1.service.[root@elk-1 ~]# setenforce 0[root@elk-1 ~]# vi /etc/selinux/config[root@elk-1 ~]# cat /etc/selinux/config# This file controls the state of SELinux on the system.# SELINUX= can take one of these three values:# enforcing - SELinux security policy is enforced.# permissive - SELinux prints warnings instead of enforcing.# disabled - No SELinux policy is loaded.SELINUX=disabled# SELINUXTYPE= can take one of three two values:# targeted - Targeted processes are protected,# minimum - Modification of targeted policy. Only selected processes are protected.# mls - Multi Level Security protection.SELINUXTYPE=targeted
3. 配置 hosts 文件
三个节点配置相同(elk-1节点为例)
[root@elk-1 ~]# vim /etc/hosts
[root@elk-1 ~]# cat /etc/hosts
127.0.0.1   localhost localhost.localdomain localhost4 localhost4.localdomain4
::1         localhost localhost.localdomain localhost6 localhost6.localdomain6
192.168.200.10 elk-1
192.168.200.20 elk-2
192.168.200.30 elk-3

配置完hosts用scp命令把hosts里的配置文件复制到elk-2和elk-3下
[root@elk-1 ~]# scp /etc/hosts elk-2:/etc/hosts
The authenticity of host 'elk-2 (192.168.200.20)' can't be established.
ECDSA key fingerprint is SHA256:dxl72pjdE9IagOFsebD4+gNRSPEWnHLyDWMqpg9nNBo.
ECDSA key fingerprint is MD5:9c:7d:69:67:4a:93:93:12:4b:f0:ac:4a:1e:4f:1e:21.
Are you sure you want to continue connecting (yes/no)? yes
Warning: Permanently added 'elk-2,192.168.200.20' (ECDSA) to the list of known hosts.
root@elk-2's password:
hosts                                                                                     100%  222   150.6KB/s   00:00
4. 安装 JDK
部署ELK环境需要jdk1.8以上的JDK版本软件环境,我们使⽤opnejdk1.8,3节点全部安装(以 elk-1节点为例),命令如下:
[root@elk-1 ~]# yum install -y java-1.8.0-openjdk java-1.8.0-openjdk-devel net tools
[root@elk-1 ~]# java -version    #查看jdk版本
openjdk version "1.8.0_322"
OpenJDK Runtime Environment (build 1.8.0_322-b06)
OpenJDK 64-Bit Server VM (build 25.322-b06, mixed mode)
5. Elasticserach安装
下载 elasticserach-6.0.0.rpm 包
[root@elk-1 ~]# wget https://artifacts.elastic.co/downloads/elasticsearch/elasticsearch-6.0.0.rpm
--2022-04-12 15:11:29--  https://artifacts.elastic.co/downloads/elasticsearch/elasticsearch-6.0.0.rpm
正在解析主机 artifacts.elastic.co (artifacts.elastic.co)... 34.120.127.130, 2600:1901:0:1d7::
正在连接 artifacts.elastic.co (artifacts.elastic.co)|34.120.127.130|:443... 已连接。
已发出 HTTP 请求,正在等待回应... 200 OK
长度:27970243 (27M) [binary/octet-stream]
正在保存至: “elasticsearch-6.0.0.rpm”

75% [=============================================================>                     ] 21,159,094  21.9KB/s 剩余 1m 46s +
100%[==================================================================================>] 27,970,243  65.4KB/s 用时 6m 49s

2022-04-12 15:18:26 (66.8 KB/s) - 已保存 “elasticsearch-6.0.0.rpm” [27970243/27970243])

用scp命令把elasticserach-6.0.0.rpm包复制到elk-2和elk-3节点中
[root@elk-1 ~]# scp elasticsearch-6.0.0.rpm elk-2:/root/
root@elk-2's password:
elasticsearch-6.0.0.rpm                                                                   100%   27MB  81.8MB/s   00:00
[root@elk-1 ~]# scp elasticsearch-6.0.0.rpm elk-3:/root/
root@elk-3's password:
elasticsearch-6.0.0.rpm                                                                   100%   27MB 108.1MB/s   00:00
安装Elasticserach
[root@elk-1 ~]# rpm -ivh elasticsearch-6.0.0.rpm         #i 表示安装,v 表示显示安装过程,h 表示显示进度
警告:elasticsearch-6.0.0.rpm: 头V4 RSA/SHA512 Signature, 密钥 ID d88e42b4: NOKEY
准备中...                          ################################# [100%]
Creating elasticsearch group... OK
Creating elasticsearch user... OK
正在升级/安装...
   1:elasticsearch-0:6.0.0-1          ################################# [100%]
### NOT starting on installation, please execute the following statements to configure elasticsearch service to start automatically using systemd
 sudo systemctl daemon-reload
 sudo systemctl enable elasticsearch.service
### You can start elasticsearch service by executing
 sudo systemctl start elasticsearch.service
6. 配置 Elasticserach
配置elasticsearch的配置⽂件,配置⽂件:/etc/elasticsearch/elasticsearch.yml elk-1节点:增加以下红⾊字样(//为解释,这⾥⽤不到的配置⽂件被删除),注意IP
[root@elk-1 ~]# vim /etc/elasticsearch/elasticsearch.yml
[root@elk-1 ~]# cat /etc/elasticsearch/elasticsearch.yml
# ======================== Elasticsearch Configuration =========================
#
# NOTE: Elasticsearch comes with reasonable defaults for most settings.
#       Before you set out to tweak and tune the configuration, make sure you
#       understand what are you trying to accomplish and the consequences.
#
# The primary way of configuring a node is via this file. This template lists
# the most important settings you may want to configure for a production cluster.
#
# Please consult the documentation for further information on configuration options:
# https://www.elastic.co/guide/en/elasticsearch/reference/index.html
#
# ---------------------------------- Cluster -----------------------------------
#
# Use a descriptive name for your cluster:
#
#cluster.name: my-application
cluster.name: ELK        #集群名称
# ------------------------------------ Node ------------------------------------
#
# Use a descriptive name for the node:
node.name: elk-1        #节点名
node.master: true        #指定该节点是否有资格被选举成为master,默认是true,es是默认集群中的第⼀台机器为master,
                        如果这台机挂了就会重新选举master
node.data: false        #指定该节点是否存储索引数据,默认为true。其他两节点为true
#node.name: node-1
#
# Add custom attributes to the node:
#
#node.attr.rack: r1
#
# ----------------------------------- Paths ------------------------------------
#
# Path to directory where to store the data (separate multiple locations by comma):
#
path.data: /var/lib/elasticsearch    #索引数据存储位置(保持默认,不要开启注释)
#
# Path to log files:
#
path.logs: /var/log/elasticsearch    #设置日志文件的存储路径,默认是es根目录下的logs文件夹
#
# ----------------------------------- Memory -----------------------------------
#
# Lock the memory on startup:
#
#bootstrap.memory_lock: true
#
# Make sure that the heap size is set to about half the memory available
# on the system and that the owner of the process is allowed to use this
# limit.
#
# Elasticsearch performs poorly when the system is swapping the memory.
#
# ---------------------------------- Network -----------------------------------
#
# Set the bind address to a specific IP (IPv4 or IPv6):
#
#network.host: 192.168.0.1
network.host: 192.168.200.10    #设置绑定的ip地址,可以是ipv4或ipv6的,默认为0.0.0.0。
# Set a custom port for HTTP:
#
#http.port: 9200
 http.port: 9200        #启动的es对外访问的http端口,默认9200
# For more information, consult the network module documentation.
#
# --------------------------------- Discovery ----------------------------------
#
# Pass an initial list of hosts to perform discovery when new node is started:
# The default list of hosts is ["127.0.0.1", "[::1]"]
#
#discovery.zen.ping.unicast.hosts: ["host1", "host2"]
discovery.zen.ping.unicast.hosts: ["elk-1", "elk-2","elk-3"]    #设置集群中master节点的初始列表,可以通过这些节点来⾃动发现新加⼊集群的节点。
# Prevent the "split brain" by configuring the majority of nodes (total number of master-eligible nodes / 2 + 1):
#
#discovery.zen.minimum_master_nodes: 3
#
# For more information, consult the zen discovery module documentation.
#
# ---------------------------------- Gateway -----------------------------------
#
# Block initial recovery after a full cluster restart until N nodes are started:
#
#gateway.recover_after_nodes: 3
#
# For more information, consult the gateway module documentation.
#
# ---------------------------------- Various -----------------------------------
#
# Require explicit names when deleting indices:
#
#action.destructive_requires_name: true
elk-2节点
[root@elk-2 ~]# vim /etc/elasticsearch/elasticsearch.yml
cluster.name: ELK #设置集群的名称
node.name: elk-2    #设置节点名称
node.master: false
node.data: true        #指定该节点是否存储索引数据
network.host: 192.168.200.20    #设置绑定的ip地址,可以是ipv4或ipv6的,默认为0.0.0.0。
http.port: 9200        #es对外访问的http端口,默认9200
discovery.zen.ping.unicast.hosts: ["elk-1","elk-2","elk-3"]
elk-3节点
[root@elk-3 ~]# vim /etc/elasticsearch/elasticsearch.yml
cluster.name: ELK #设置集群的名称
node.name: elk-3    #设置节点名称
node.master: false
node.data: true        #指定该节点是否存储索引数据
network.host: 192.168.200.30    #设置绑定的ip地址,可以是ipv4或ipv6的,默认为0.0.0.0。
http.port: 9200        #es对外访问的http端口,默认9200
discovery.zen.ping.unicast.hosts: ["elk-1","elk-2","elk-3"]
7. 启动服务(三个节点)
通过命令启动es服务,启动后使用ps命令查看进程是否存在或者使用netstat命令查看是否端口启动。命令如下:(3个节点命令相同)
[root@elk-1 ~]# systemctl restart elasticsearch
[root@elk-1 ~]# ps -ef |grep elasticsearch
elastic+  11880      1 79 16:21 ?        00:00:11 /bin/java -Xms1g -Xmx1g -XX:+UseConcMarkSweepGC -XX:CMSInitiatingOccupancyFraction=75 -XX:+UseCMSInitiatingOccupancyOnly -XX:+AlwaysPreTouch -server -Xss1m -Djava.awt.headless=true -Dfile.encoding=UTF-8 -Djna.nosys=true -XX:-OmitStackTraceInFastThrow -Dio.netty.noUnsafe=true -Dio.netty.noKeySetOptimization=true -Dio.netty.recycler.maxCapacityPerThread=0 -Dlog4j.shutdownHookEnabled=false -Dlog4j2.disable.jmx=true -XX:+HeapDumpOnOutOfMemoryError -XX:HeapDumpPath=/var/lib/elasticsearch -Des.path.home=/usr/share/elasticsearch -Des.path.conf=/etc/elasticsearch -cp /usr/share/elasticsearch/lib/* org.elasticsearch.bootstrap.Elasticsearch -p /var/run/elasticsearch/elasticsearch.pid --quiet
root      11956   1943  0 16:22 pts/0    00:00:00 grep --color=auto elasticsearch
[root@elk-1 ~]# netstat -lntp
Active Internet connections (only servers)
Proto Recv-Q Send-Q Local Address           Foreign Address         State       PID/Program name
tcp        0      0 0.0.0.0:22              0.0.0.0:*               LISTEN      1057/sshd
tcp        0      0 127.0.0.1:25            0.0.0.0:*               LISTEN      1310/master
tcp6       0      0 192.168.200.10:9200     :::*                    LISTEN      11880/java
tcp6       0      0 192.168.200.10:9300     :::*                    LISTEN      11880/java
tcp6       0      0 :::22                   :::*                    LISTEN      1057/sshd
tcp6       0      0 ::1:25                  :::*                    LISTEN      1310/master
8. 检测集群状态
[root@elk-1 ~]# curl '192.168.200.10:9200/_cluster/health?pretty'
{
  "cluster_name" : "ELK",
  "status" : "green",    #为green则代表健康没问题,yellow或者red 则是集群有问题
  "timed_out" : false,    #是否有超时
  "number_of_nodes" : 3,    #集群中的节点数量
  "number_of_data_nodes" : 2, #集群中的data节点的数量
  "active_primary_shards" : 0,
  "active_shards" : 0,
  "relocating_shards" : 0,
  "initializing_shards" : 0,
  "unassigned_shards" : 0,
  "delayed_unassigned_shards" : 0,
  "number_of_pending_tasks" : 0,
  "number_of_in_flight_fetch" : 0,
  "task_max_waiting_in_queue_millis" : 0,
  "active_shards_percent_as_number" : 100.0
}
9. 部署 Kibana
在elk-1节点下载kibana包
[root@elk-1 ~]# wget https://artifacts.elastic.co/downloads/kibana/kibana-6.0.0-x86_64.rpm
--2022-04-12 16:35:25--  https://artifacts.elastic.co/downloads/kibana/kibana-6.0.0-x86_64.rpm
正在解析主机 artifacts.elastic.co (artifacts.elastic.co)... 34.120.127.130, 2600:1901:0:1d7::
正在连接 artifacts.elastic.co (artifacts.elastic.co)|34.120.127.130|:443... 已连接。
已发出 HTTP 请求,正在等待回应... 200 OK
长度:63979183 (61M) [binary/octet-stream]
正在保存至: “kibana-6.0.0-x86_64.rpm”

100%[==================================================================================>] 63,979,183  6.37MB/s 用时 17s

2022-04-12 16:35:53 (3.69 MB/s) - 已保存 “kibana-6.0.0-x86_64.rpm” [63979183/63979183])
安装kibana
[root@elk-1 ~]# rpm -ivh kibana-6.0.0-x86_64.rpm
警告:kibana-6.0.0-x86_64.rpm: 头V4 RSA/SHA512 Signature, 密钥 ID d88e42b4: NOKEY
准备中...                          ################################# [100%]
正在升级/安装...
   1:kibana-6.0.0-1                   ################################# [100%]
配置监听
[root@elk-1 ~]# vim /etc/nginx.conf
upstream elasticsearch {
         zone elasticsearch 64K;
         server elk-1:9200;
         server elk-2:9200;
         server elk-3:9200;
}

server {
         listen 8080;
         server_name 192.168.200.10;
         location / {
         proxy_pass http://elasticsearch;
         proxy_redirect off;
         proxy_set_header Host $host;
         proxy_set_header X-Real-IP $remote_addr;
         proxy_set_header X-Forwarded-For $proxy_add_x_forwarded_for;
         }
         access_log /var/log/es_access.log;
        }
配置Kibana的配置⽂件,配置⽂件在/etc/kibana/kibana.yml,在配置⽂件增加或修改以下内容:
[root@elk-1 ~]# vim /etc/kibana/kibana.yml
server.port: 5601
server.host: 192.168.200.10
elasticsearch.url: "http://192.168.200.10:9200"

[root@elk-1 ~]# systemctl start kibana
[root@elk-1 ~]# systemctl restart kibana
[root@elk-1 ~]# ps -ef |grep kibana
kibana    12124      1 18 16:56 ?        00:00:01 /usr/share/kibana/bin/../node/bin/node --no-warnings /usr/share/kibana/bin/../src/cli -c /etc/kibana/kibana.yml
root      12136   1943  0 16:56 pts/0    00:00:00 grep --color=auto kibana
[root@elk-1 ~]# netstat -ntpl
Active Internet connections (only servers)
Proto Recv-Q Send-Q Local Address           Foreign Address         State       PID/Program name
tcp        0      0 192.168.200.10:5601     0.0.0.0:*               LISTEN      12124/node
tcp        0      0 0.0.0.0:22              0.0.0.0:*               LISTEN      1057/sshd
tcp        0      0 127.0.0.1:25            0.0.0.0:*               LISTEN      1310/master
tcp6       0      0 192.168.200.10:9200     :::*                    LISTEN      11880/java
tcp6       0      0 192.168.200.10:9300     :::*                    LISTEN      11880/java
tcp6       0      0 :::22                   :::*                    LISTEN      1057/sshd
tcp6       0      0 ::1:25                  :::*                    LISTEN      1310/master
启动成功后网页访问,可以访问到如下界面

10. 安装配置logstash
1.在elk-2节点安装logstash
[root@elk-2 ~]# wget  https://artifacts.elastic.co/downloads/logstash/logstash-6.0.0.rpm
--2022-04-12 17:28:14--  https://artifacts.elastic.co/downloads/logstash/logstash-6.0.0.rpm
正在解析主机 artifacts.elastic.co (artifacts.elastic.co)... 34.120.127.130, 2600:1901:0:1d7::
正在连接 artifacts.elastic.co (artifacts.elastic.co)|34.120.127.130|:443... 已连接。
已发出 HTTP 请求,正在等待回应... 200 OK
长度:113288712 (108M) [binary/octet-stream]
正在保存至: “logstash-6.0.0.rpm”

100%[========================================================================================>] 113,288,712 49.3MB/s 用时 2.2s

2022-04-12 17:28:17 (49.3 MB/s) - 已保存 “logstash-6.0.0.rpm” [113288712/113288712])


[root@elk-2 ~]# rpm -ivh logstash-6.0.0.rpm     #i 安装 v 显示安装过程 h 显示进度
警告:logstash-6.0.0.rpm: 头V4 RSA/SHA512 Signature, 密钥 ID d88e42b4: NOKEY
准备中...                          ################################# [100%]
正在升级/安装...
   1:logstash-1:6.0.0-1               ################################# [100%]
Using provided startup.options file: /etc/logstash/startup.options
Successfully created system startup script for Logstash
增加logstash权限
[root@elk-2 ~]# chmod 644 /var/log/messages
[root@elk-2 ~]# chown -R logstash:logstash /var/log/logstash/
[root@elk-2 ~]# chown -R logstash /var/lib/logstash/
配置logstash收集syslog日志
[root@elk-2 ~]# chmod 644 /var/log/messages
[root@elk-2 ~]# chown -R logstash:logstash /var/log/logstash/
[root@elk-2 ~]# chown -R logstash /var/lib/logstash/
[root@elk-2 ~]# vim /etc/logstash/logstash.yml
http.host: "192.168.200.20"
[root@elk-2 ~]# vim /etc/rsyslog.conf
#### RULES ####
*.* @@192.168.200.20:10514

[root@elk-2 ~]# systemctl restart rsyslog
[root@elk-2 ~]# vim /etc/logstash/conf.d/syslog.conf
input {         #定义日志源
    file {
        path => "/var/log/messages"     #定义日志来源路径  目录要给644权限,不然无法读取日志
        type => "systemlog"   #定义类型
        start_position => "beginning"
        stat_interval => "3"
    }
}
output {   #定义日志输出
            elasticsearch {
            hosts => ["192.168.200.20:9200"]
            index => "system-log-%{+YYYY.MM.dd}"
        }
  }
[root@elk-2 ~]# ln -s /usr/share/logstash/bin/logstash /usr/bin/    #创建软连接,方便使用logstash命令
[root@elk-2 ~]# logstash --path.settings /etc/logstash/ -f /etc/logstash/conf.d/syslog.conf --config.test_and_exit
Sending Logstash's logs to /var/log/logstash which is now configured via log4j2.properties
Configuration OK        #为ok则没问题
[root@elk-2 ~]# systemctl restart logstash
- —path.settings : 用于指定logstash的配置文件所在的目录
- -f : 指定需要被检测的配置文件的路径
- —config.test_and_exit : 指定检测完之后就退出,不然就会直接启动了
2. 启动服务
[root@elk-2 ~]# netstat -ntpl
Active Internet connections (only servers)
Proto Recv-Q Send-Q Local Address           Foreign Address         State       PID/Program name
tcp        0      0 0.0.0.0:22              0.0.0.0:*               LISTEN      952/sshd
tcp        0      0 127.0.0.1:25            0.0.0.0:*               LISTEN      1150/master
tcp6       0      0 192.168.200.20:9600     :::*                    LISTEN      3486/java
tcp6       0      0 192.168.200.20:9200     :::*                    LISTEN      3383/java
tcp6       0      0 192.168.200.20:9300     :::*                    LISTEN      3383/java
tcp6       0      0 :::22                   :::*                    LISTEN      952/sshd
tcp6       0      0 ::1:25                  :::*                    LISTEN      1150/master

[root@elk-2 ~]# curl '192.168.200.20:9200/_cat/indices?v'
health status index                 uuid                   pri rep docs.count docs.deleted store.size pri.store.size
green  open   .kibana               BOee2fBHSB2E4se-M7nbhg   1   1          1            0      7.3kb          3.6kb
green  open   system-log-2022.04.13 S6wBvb8sSMGtmqU_-T58TQ   5   1     305036            0    104.5mb         52.2mb

# 有system-log则代表成功。


#获取/删除指定索引详细信息
curl -XGET/DELETE '192.168.200.10:9200/system-log-2022.04.13?pretty'
[root@elk-1 ~]# curl -XGET '192.168.200.10:9200/system-log-2022.04.13?pretty'
{
  "system-log-2022.04.13" : {
    "aliases" : { },
    "mappings" : {
      "systemlog" : {
        "properties" : {
          "@timestamp" : {
            "type" : "date"
          },
          "@version" : {
            "type" : "text",
            "fields" : {
              "keyword" : {
                "type" : "keyword",
                "ignore_above" : 256
              }
            }
          },
          "host" : {
            "type" : "text",
            "fields" : {
              "keyword" : {
                "type" : "keyword",
                "ignore_above" : 256
              }
            }
          },
          "message" : {
            "type" : "text",
            "fields" : {
              "keyword" : {
                "type" : "keyword",
                "ignore_above" : 256
              }
            }
          },
          "path" : {
            "type" : "text",
            "fields" : {
              "keyword" : {
                "type" : "keyword",
                "ignore_above" : 256
              }
            }
          },
          "type" : {
            "type" : "text",
            "fields" : {
              "keyword" : {
                "type" : "keyword",
                "ignore_above" : 256
              }
            }
          }
        }
      }
    },
    "settings" : {
      "index" : {
        "creation_date" : "1649818767880",
        "number_of_shards" : "5",
        "number_of_replicas" : "1",
        "uuid" : "S6wBvb8sSMGtmqU_-T58TQ",
        "version" : {
          "created" : "6000099"
        },
        "provided_name" : "system-log-2022.04.13"
      }
    }
  }
}
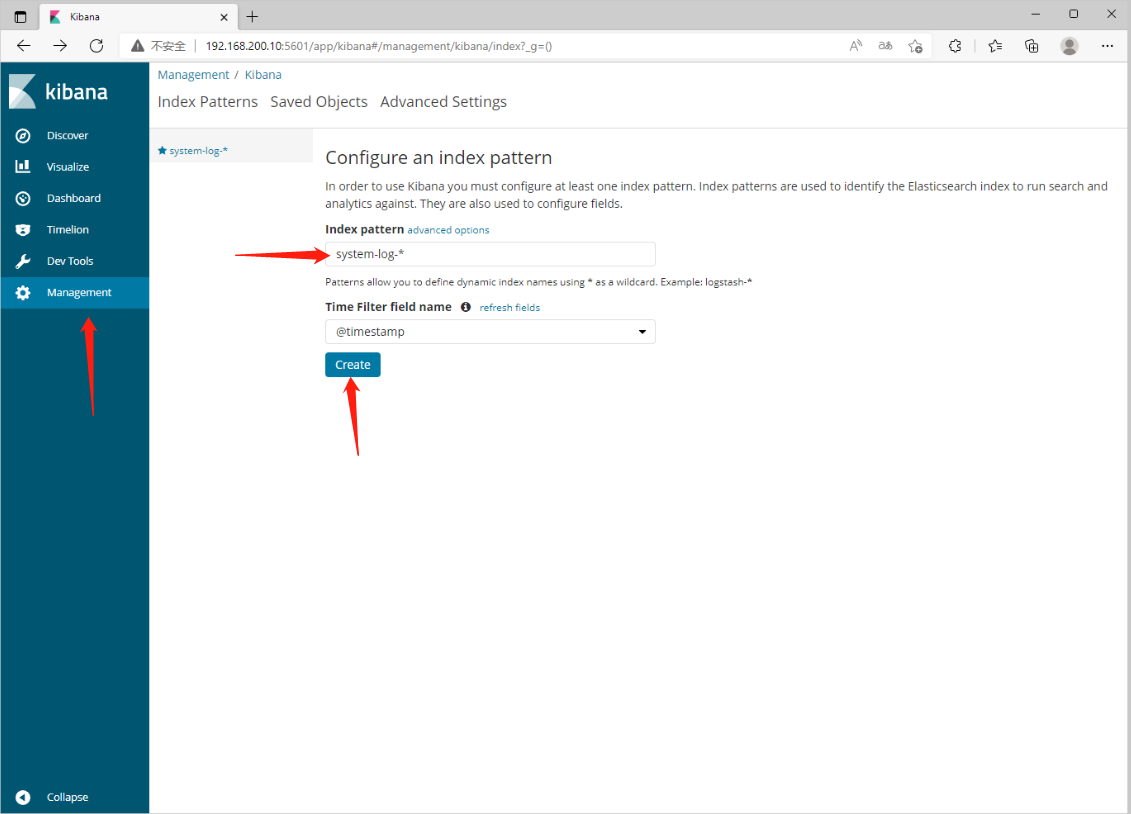
配置system Web监听
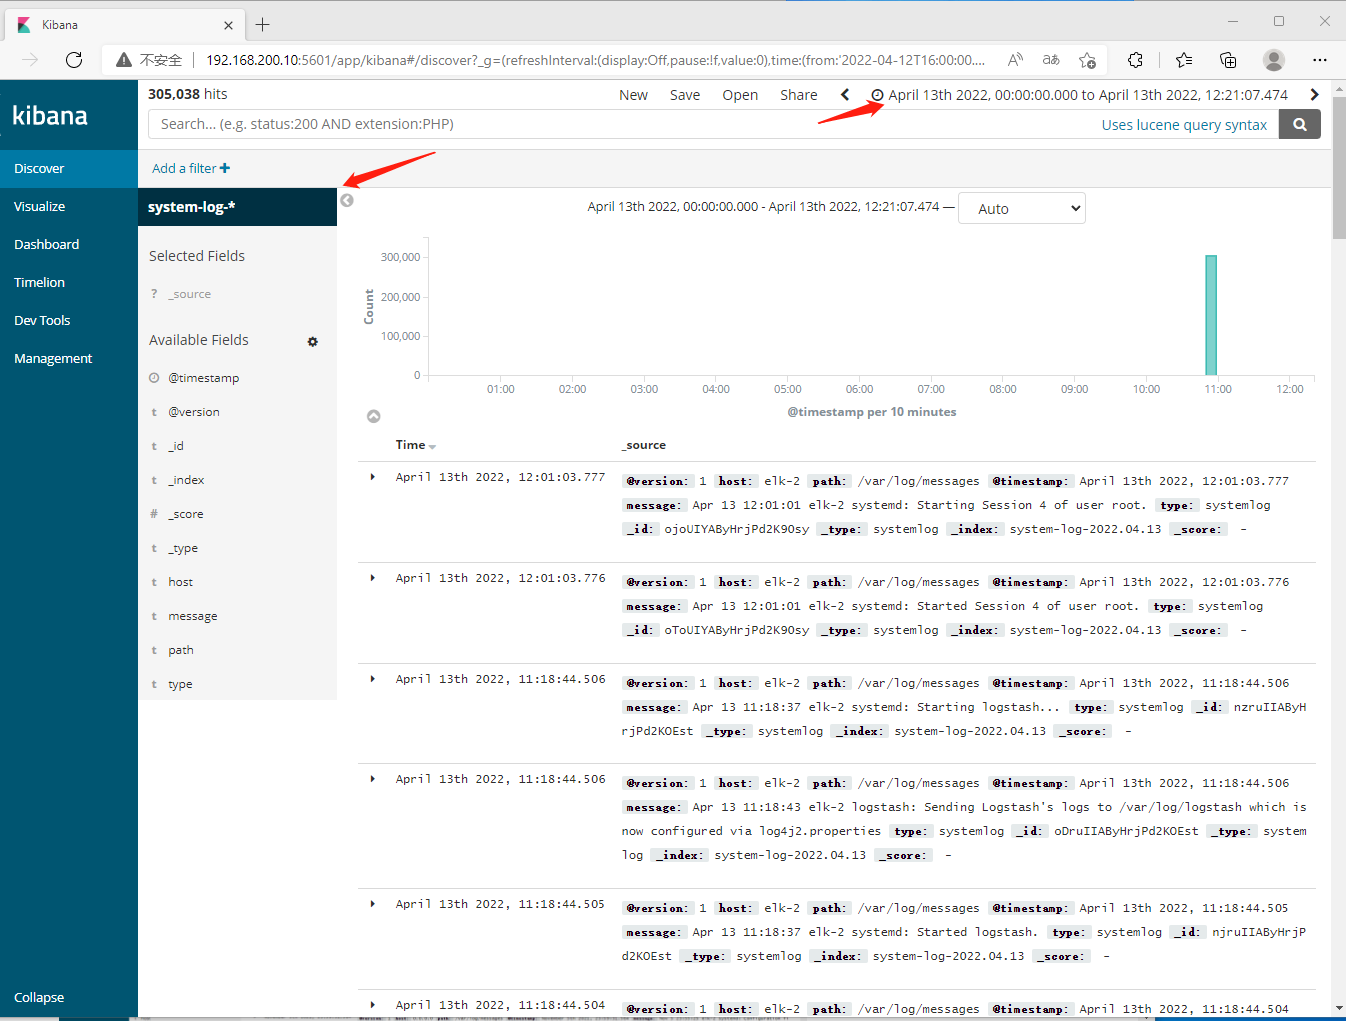
配置完成后,选择Discover,进入“Discover”页面后,无法查找到日志信息,这种情况一般是时间的问题,单击右上角信息切换成查看当天的日志信息即可。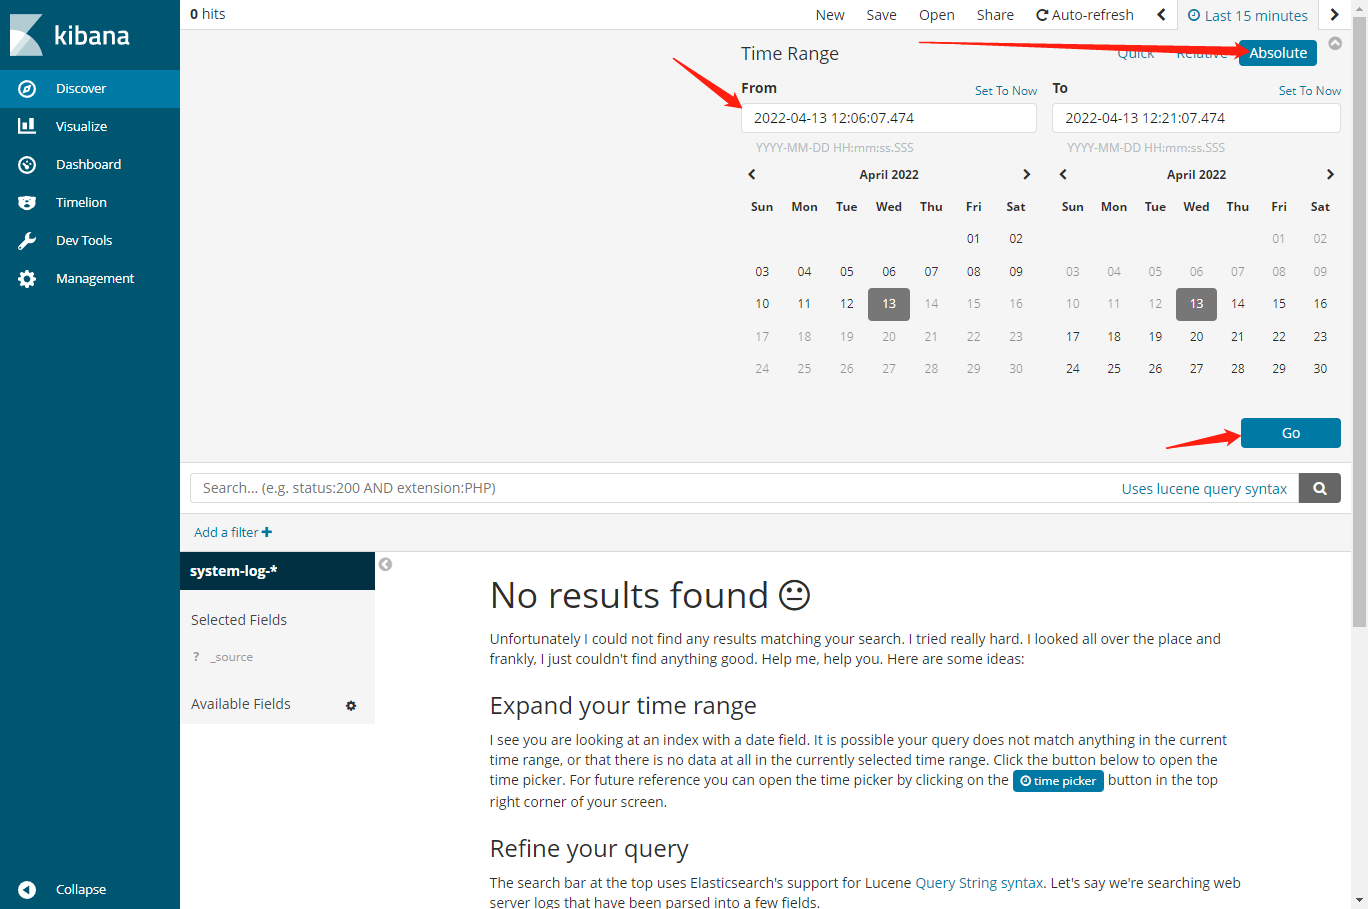
10. Logstash收集Nginx日志
elk-2上操作
[root@elk-2 ~]# wget http://nginx.org/packages/centos/7/x86_64/RPMS/nginx-1.16.1-1.el7.ngx.x86_64.rpm

--2022-04-13 12:31:18--  http://nginx.org/packages/centos/7/x86_64/RPMS/nginx-1.16.1-1.el7.ngx.x86_64.rpm
正在解析主机 nginx.org (nginx.org)... 3.125.197.172, 52.58.199.22, 2a05:d014:edb:5704::6, ...
正在连接 nginx.org (nginx.org)|3.125.197.172|:80... 已连接。
已发出 HTTP 请求,正在等待回应... 200 OK
长度:784272 (766K) [application/x-redhat-package-manager]
正在保存至: “nginx-1.16.1-1.el7.ngx.x86_64.rpm”

100%[=================================================================>] 784,272      101KB/s 用时 8.1s

2022-04-13 12:31:27 (94.1 KB/s) - 已保存 “nginx-1.16.1-1.el7.ngx.x86_64.rpm” [784272/784272])


[root@elk-2 ~]# rpm -ivh nginx-1.16.1-1.el7.ngx.x86_64.rpm
警告:nginx-1.16.1-1.el7.ngx.x86_64.rpm: 头V4 RSA/SHA1 Signature, 密钥 ID 7bd9bf62: NOKEY
准备中...                          ################################# [100%]
正在升级/安装...
   1:nginx-1:1.16.1-1.el7.ngx         ################################# [100%]
----------------------------------------------------------------------

Thanks for using nginx!

Please find the official documentation for nginx here:
* http://nginx.org/en/docs/

Please subscribe to nginx-announce mailing list to get
the most important news about nginx:
* http://nginx.org/en/support.html

Commercial subscriptions for nginx are available on:
* http://nginx.com/products/

----------------------------------------------------------------------


[root@elk-2 ~]# vim /etc/logstash/conf.d/nginx.conf
[root@elk-2 ~]# cat /etc/logstash/conf.d/nginx.conf
input {
  file {
    path => "/tmp/elk_access.log"
    start_position => "beginning"
    type => "nginx"
  }
}
filter {
    grok {
        match => { "message" => "%{IPORHOST:http_host} %{IPORHOST:clientip} - %{USERNAME:remote_user} \[%{HTTPDATE:timestamp}\] \"(?:%{WORD:http_verb} %{NOTSPACE:http_request}(?: HTTP/%{NUMBER:http_version})?|%{DATA:raw_http_request})\" %{NUMBER:response} (?:%{NUMBER:bytes_read}|-) %{QS:referrer} %{QS:agent} %{QS:xforwardedfor} %{NUMBER:request_time:float}"}
    }
    geoip {
        source => "clientip"
    }
}
output {
    stdout { codec => rubydebug }
    elasticsearch {
        hosts => ["192.168.200.20:9200"]
    index => "nginx-test-%{+YYYY.MM.dd}"
  }
}

[root@elk-2 ~]# logstash --path.settings /etc/logstash/ -f /etc/logstash/conf.d/nginx.conf --config.test_and_exit
Sending Logstash's logs to /var/log/logstash which is now configured via log4j2.properties
Configuration OK
# 为ok则没有问题

[root@elk-2 ~]# vim /etc/nginx/conf.d/elk.conf
[root@elk-2 ~]# cat /etc/nginx/conf.d/elk.conf
server {
      listen 80;
      server_name elk.com;
      location / {
          proxy_pass      http://192.168.200.10:5601;
          proxy_set_header Host   $host;
          proxy_set_header X-Real-IP      $remote_addr;
          proxy_set_header X-Forwarded-For $proxy_add_x_forwarded_for;
      }
      access_log  /tmp/elk_access.log main2;
}

[root@elk-2 ~]# echo "192.168.200.20 elk.com" >> /etc/hosts #添加hosts配置
[root@elk-2 ~]# cat /etc/hosts
127.0.0.1   localhost localhost.localdomain localhost4 localhost4.localdomain4
::1         localhost localhost.localdomain localhost6 localhost6.localdomain6
192.168.200.10 elk-1
192.168.200.20 elk-2
192.168.200.30 elk-3

192.168.200.20 elk.com

[root@elk-2 ~]# vim /etc/nginx/nginx.conf  #额外添加以下内容

  log_format main2 '$http_host $remote_addr - $remote_user
[$time_local] "$request" '
                      '$status $body_bytes_sent "$http_referer" '
                      '"$http_user_agent" "$upstream_addr"
$request_time';

access_log  /var/log/nginx/access.log  main2;

[root@elk-2 ~]# systemctl start nginx
[root@elk-2 ~]# systemctl restart nginx
[root@elk-2 ~]# systemctl status nginx
● nginx.service - nginx - high performance web server
   Loaded: loaded (/usr/lib/systemd/system/nginx.service; disabled; vendor preset: disabled)
   Active: active (running) since 三 2022-04-13 12:52:25 CST; 3s ago
     Docs: http://nginx.org/en/docs/
  Process: 9327 ExecStart=/usr/sbin/nginx -c /etc/nginx/nginx.conf (code=exited, status=0/SUCCESS)
 Main PID: 9328 (nginx)
   CGroup: /system.slice/nginx.service
           ├─9328 nginx: master process /usr/sbin/nginx -c /etc/nginx/nginx.conf
           └─9329 nginx: worker process

4月 13 12:52:25 elk-2 systemd[1]: Starting nginx - high performance web server...
4月 13 12:52:25 elk-2 systemd[1]: Started nginx - high performance web server.

[root@elk-2 ~]# nginx -t
nginx: the configuration file /etc/nginx/nginx.conf syntax is ok
nginx: configuration file /etc/nginx/nginx.conf test is successful

[root@elk-2 ~]# curl elk.com
<script>var hashRoute = '/app/kibana';
var defaultRoute = '/app/kibana';

var hash = window.location.hash;
if (hash.length) {
  window.location = hashRoute + hash;
} else {
  window.location = defaultRoute;
}</script>


[root@elk-2 ~]# netstat -ntpl    #查看是否有9200端口
Active Internet connections (only servers)
Proto Recv-Q Send-Q Local Address           Foreign Address         State       PID/Program name
tcp        0      0 0.0.0.0:80              0.0.0.0:*               LISTEN      11393/nginx: master
tcp        0      0 0.0.0.0:22              0.0.0.0:*               LISTEN      952/sshd
tcp        0      0 127.0.0.1:25            0.0.0.0:*               LISTEN      1150/master
tcp6       0      0 192.168.200.20:9600     :::*                    LISTEN      11260/java
tcp6       0      0 192.168.200.20:9200     :::*                    LISTEN      3383/java
tcp6       0      0 192.168.200.20:9300     :::*                    LISTEN      3383/java
tcp6       0      0 :::22                   :::*                    LISTEN      952/sshd
tcp6       0      0 ::1:25                  :::*                    LISTEN      1150/master

[root@elk-2 ~]# curl 'elk-2:9200/_cat/indices?v'
health status index                 uuid                   pri rep docs.count docs.deleted store.size pri.store.size
green  open   nginx-test-2022.04.13 gbk8HHdJTUaRtO2Fy3Ik0w   5   1       4238            0      1.3mb        670.1kb
green  open   .kibana               BOee2fBHSB2E4se-M7nbhg   1   1          2            0       14kb            7kb
green  open   system-log-2022.04.13 S6wBvb8sSMGtmqU_-T58TQ   5   1     309284            0    208.3mb        104.1mb
web界面配置
浏览器访问192.168.200.10:5601,到Kibana上配置索引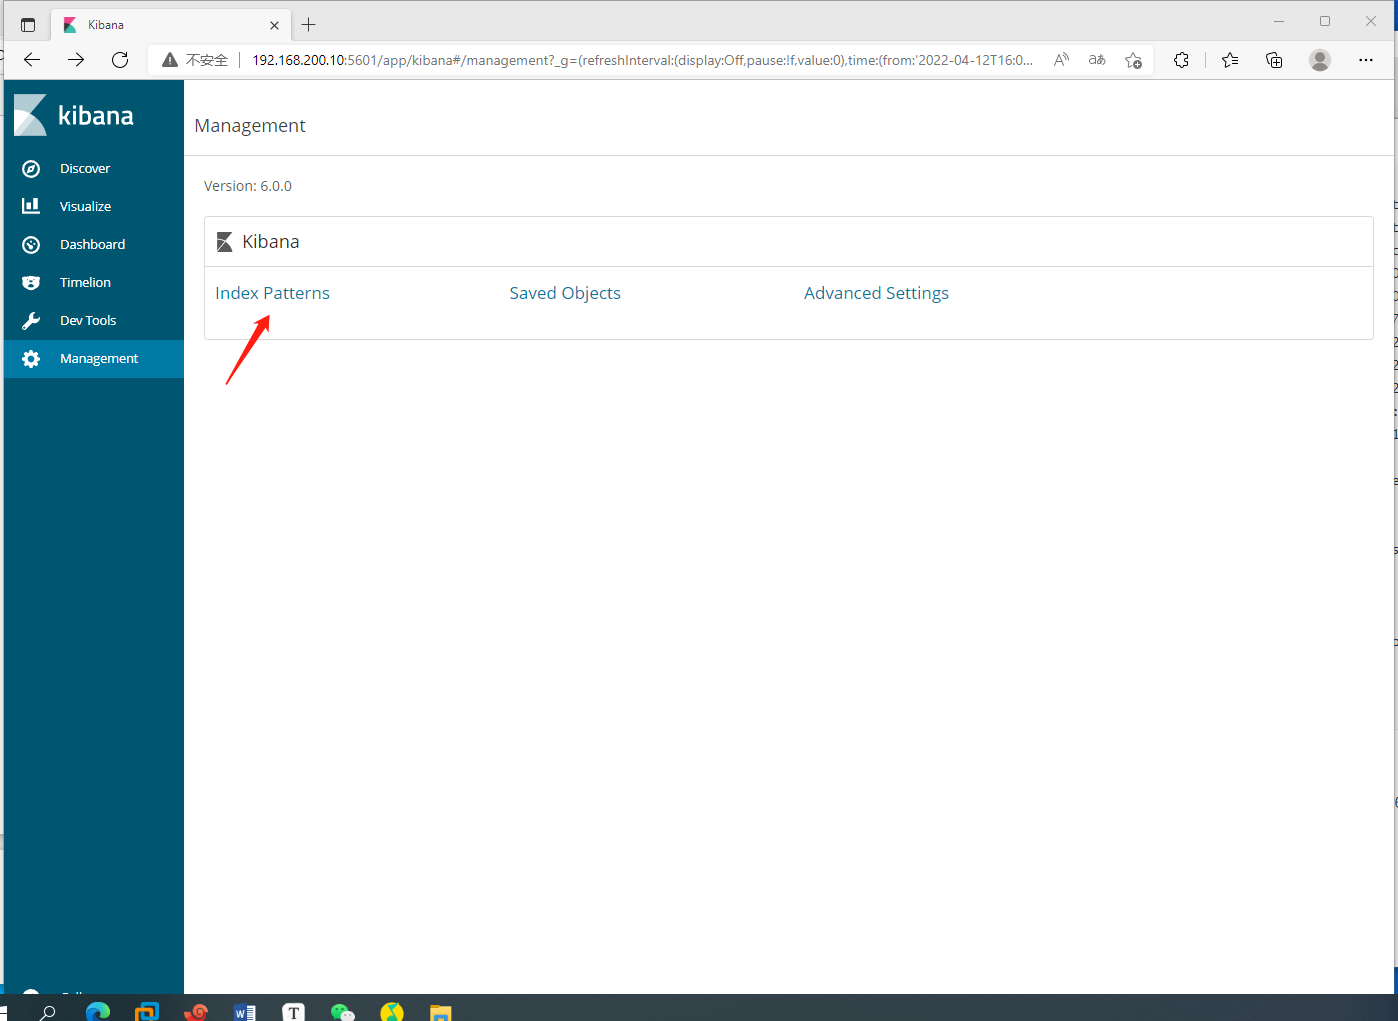
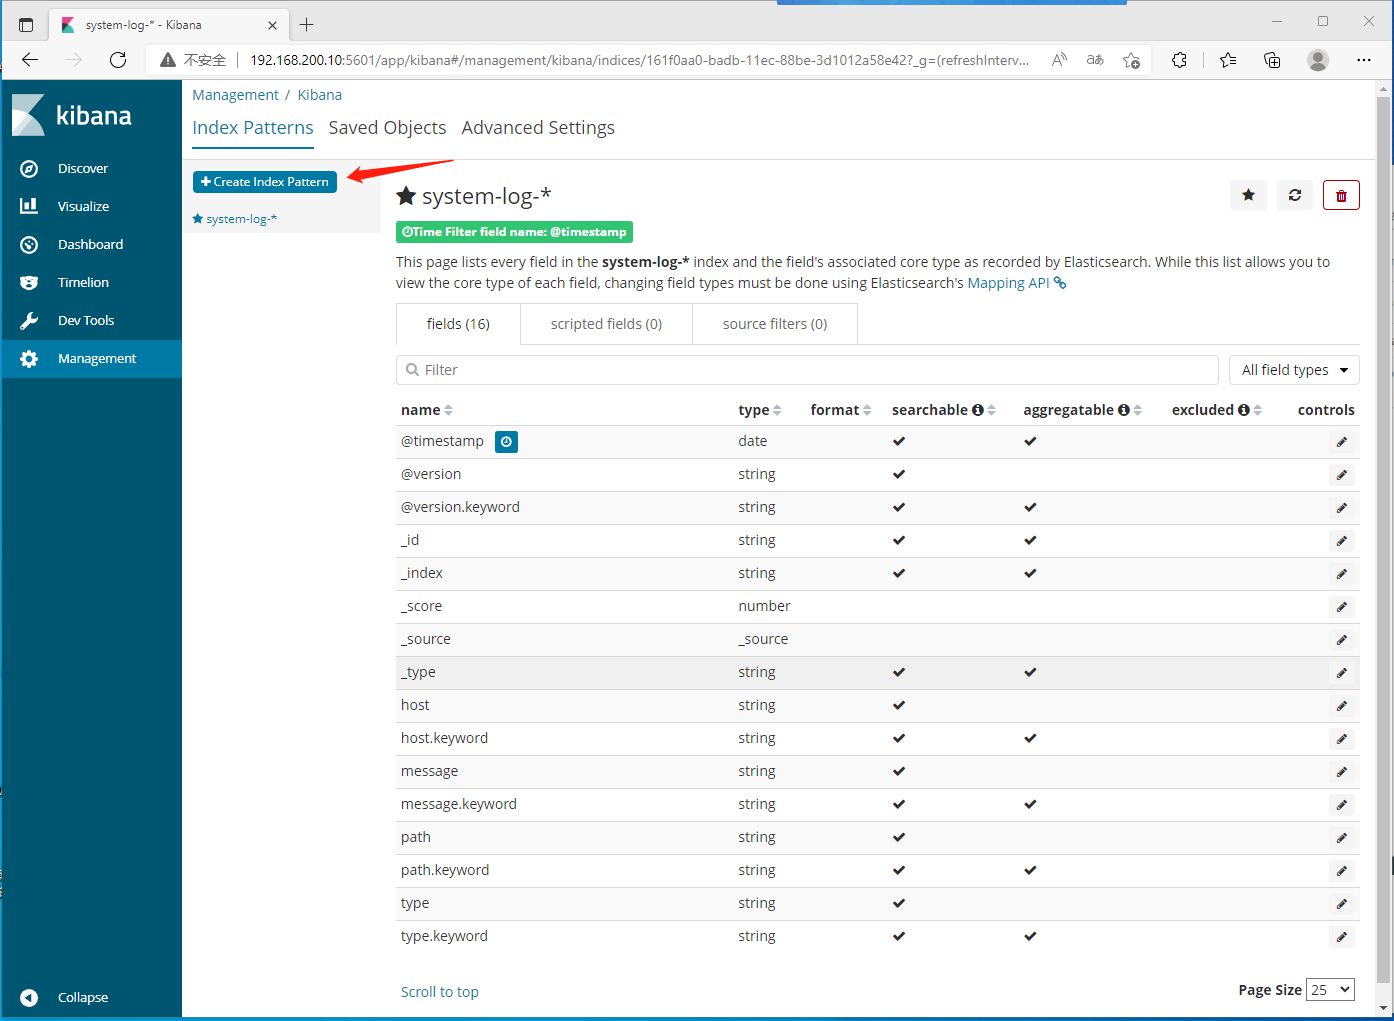
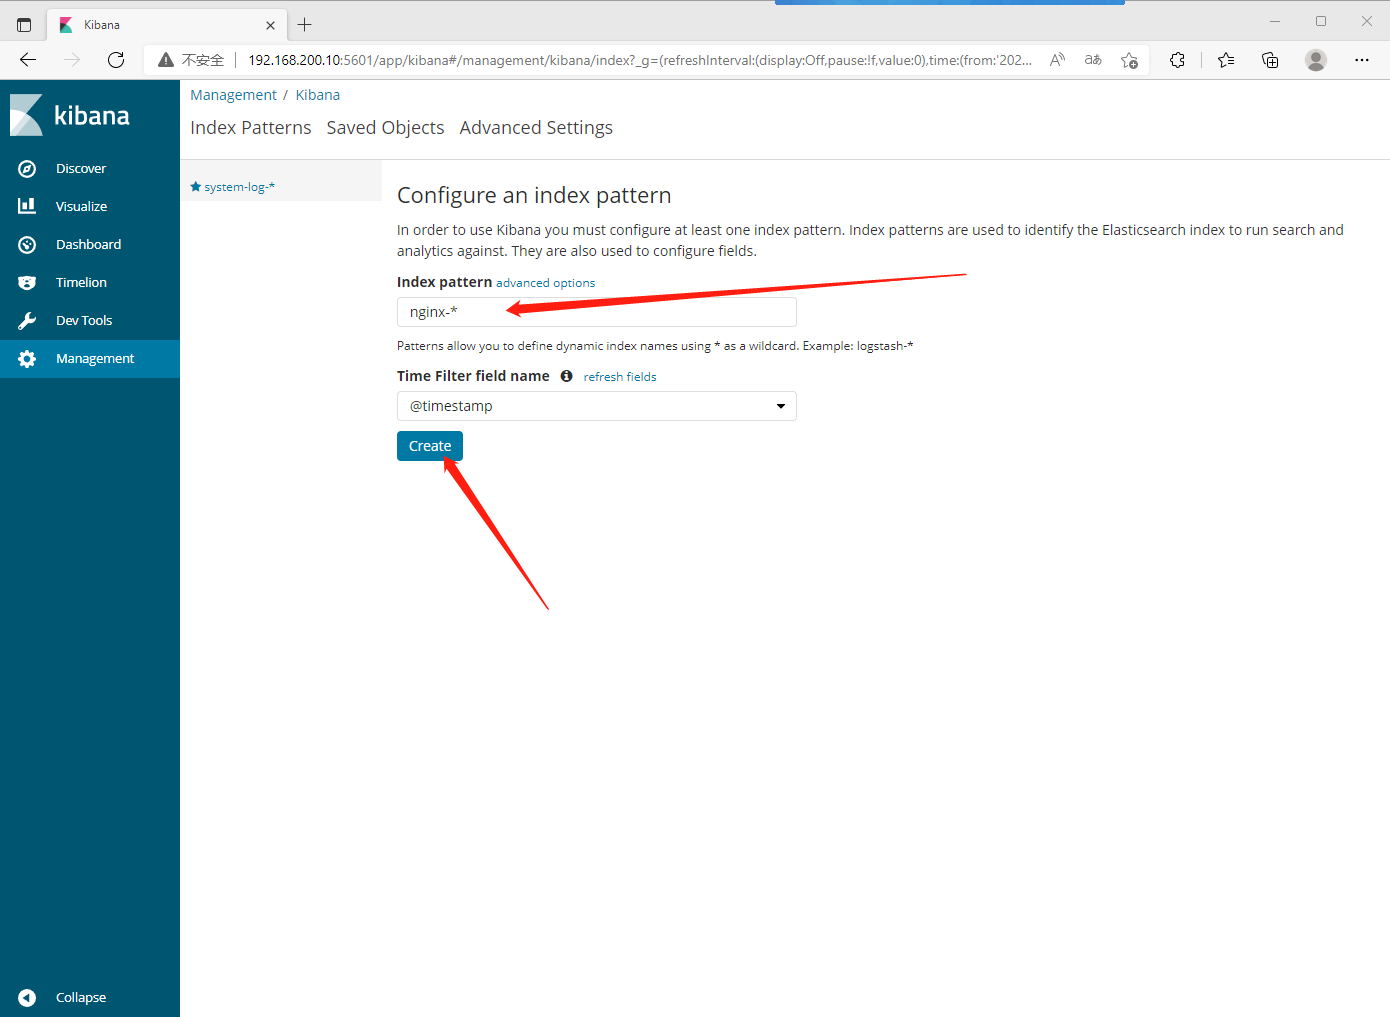
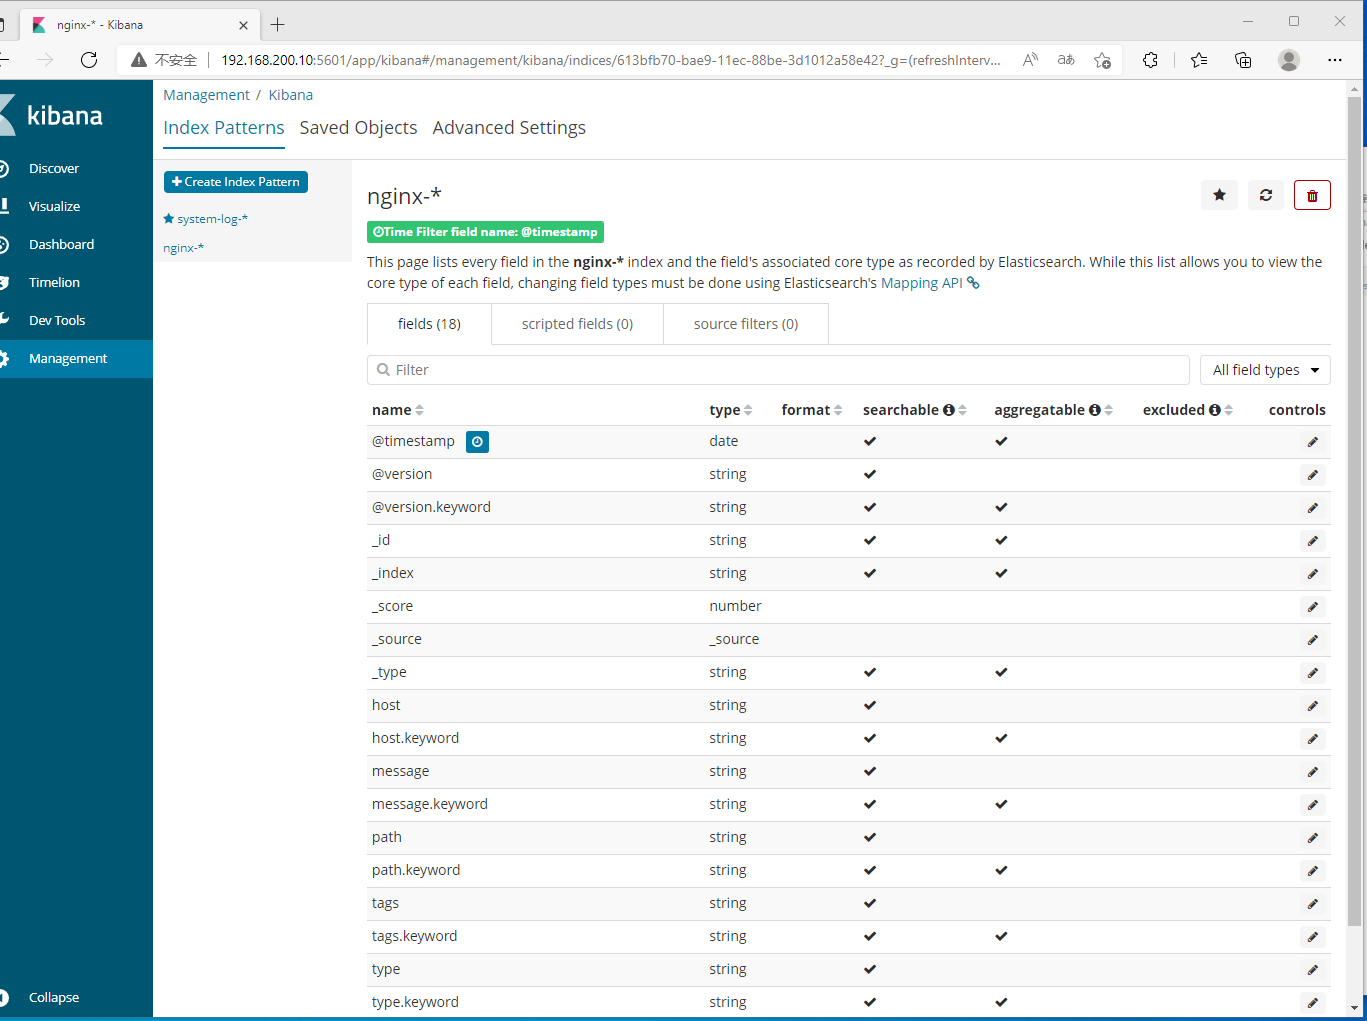
选择nginx 如果出现无法查看到日志信息,这种情况一般是时间问题,单击右上角信息切换查看当天的日志信息,修改一下时间即可。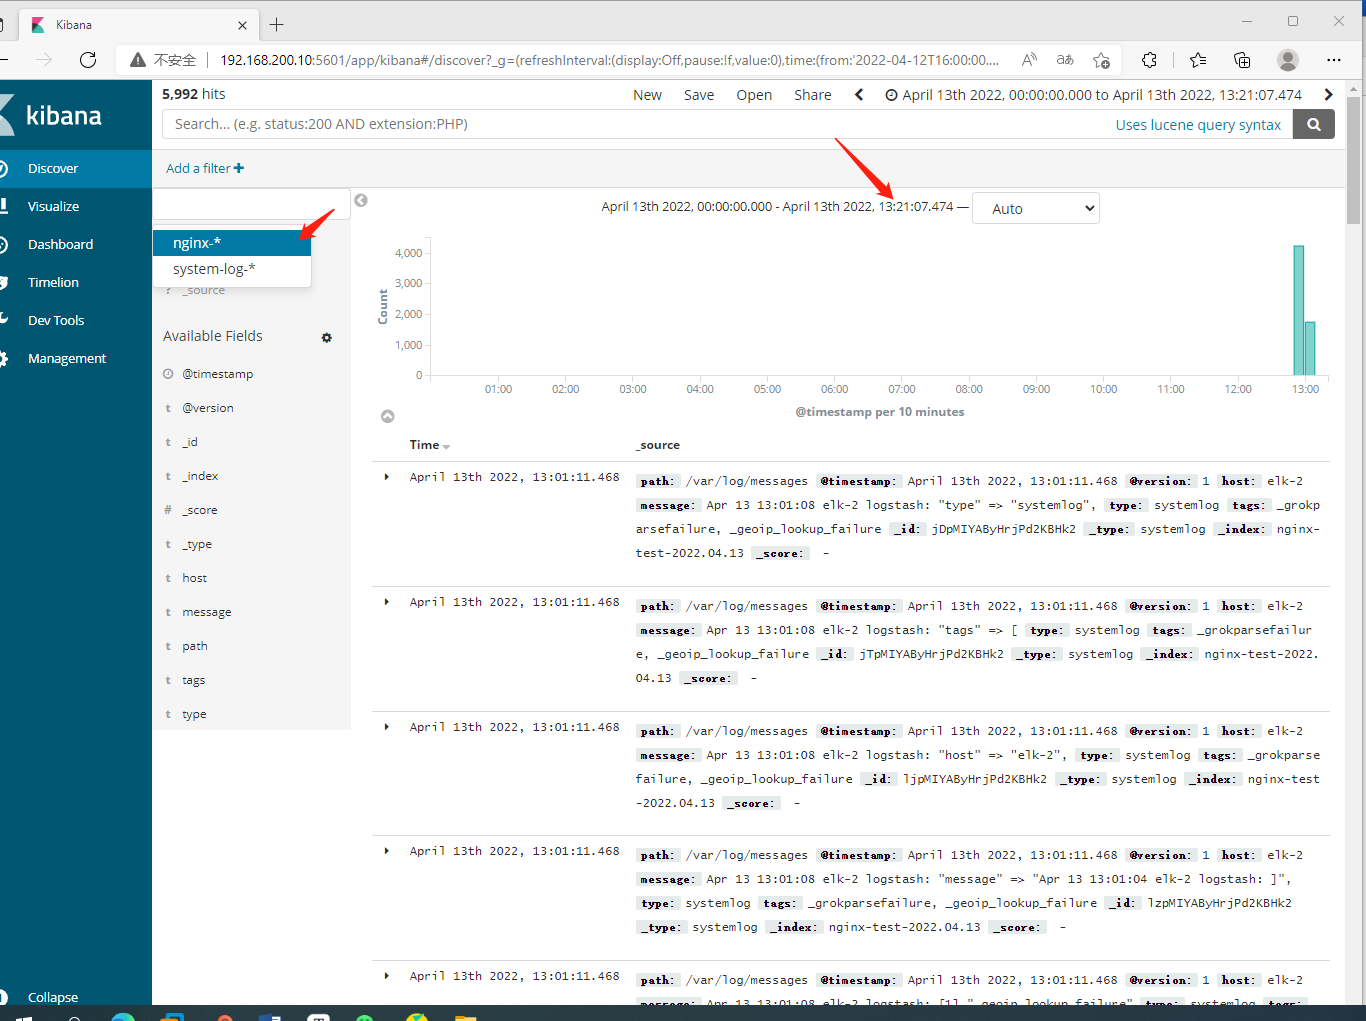
11. Beat 采集日志
[root@elk-3 ~]# wget https://artifacts.elastic.co/downloads/beats/filebeat/filebeat-6.0.0-x86_64.rpm
--2022-04-13 13:29:15--  https://artifacts.elastic.co/downloads/beats/filebeat/filebeat-6.0.0-x86_64.rpm
正在解析主机 artifacts.elastic.co (artifacts.elastic.co)... 34.120.127.130, 2600:1901:0:1d7::
正在连接 artifacts.elastic.co (artifacts.elastic.co)|34.120.127.130|:443... 已连接。
已发出 HTTP 请求,正在等待回应... 200 OK
长度:11988378 (11M) [binary/octet-stream]
正在保存至: “filebeat-6.0.0-x86_64.rpm”

100%[=============================================================================================================>] 11,988,378  4.26MB/s 用时 2.7s

2022-04-13 13:29:19 (4.26 MB/s) - 已保存 “filebeat-6.0.0-x86_64.rpm” [11988378/11988378])


[root@elk-3 ~]# rpm --install filebeat-6.0.0-x86_64.rpm
警告:filebeat-6.0.0-x86_64.rpm: 头V4 RSA/SHA512 Signature, 密钥 ID d88e42b4: NOKEY


[root@elk-3 ~]# vim /etc/filebeat/filebeat.yml

filebeat.prospectors:
enabled: true
paths:
    - /var/log/yum.log    #此处可自行改为想要监听的日志文件
output.elasticsearch:
  hosts: ["elk-1:9200","elk-2:9200","elk-3:9200"]


[root@elk-3 ~]# systemctl start filebeat
[root@elk-3 ~]# curl 'elk-1:9200/_cat/indices?v'
health status index                     uuid                   pri rep docs.count docs.deleted store.size pri.store.size
green  open   filebeat-6.0.0-2022.04.13 Qqp1F2hWT02ZRctFC7qnNg   3   1        101            0     73.4kb         39.6kb
green  open   .kibana                   BOee2fBHSB2E4se-M7nbhg   1   1          3            0     24.9kb         12.4kb
green  open   nginx-test-2022.04.13     gbk8HHdJTUaRtO2Fy3Ik0w   5   1       5992            0      1.9mb            1mb
green  open   system-log-2022.04.13     S6wBvb8sSMGtmqU_-T58TQ   5   1     311038            0    104.6mb         52.3mb
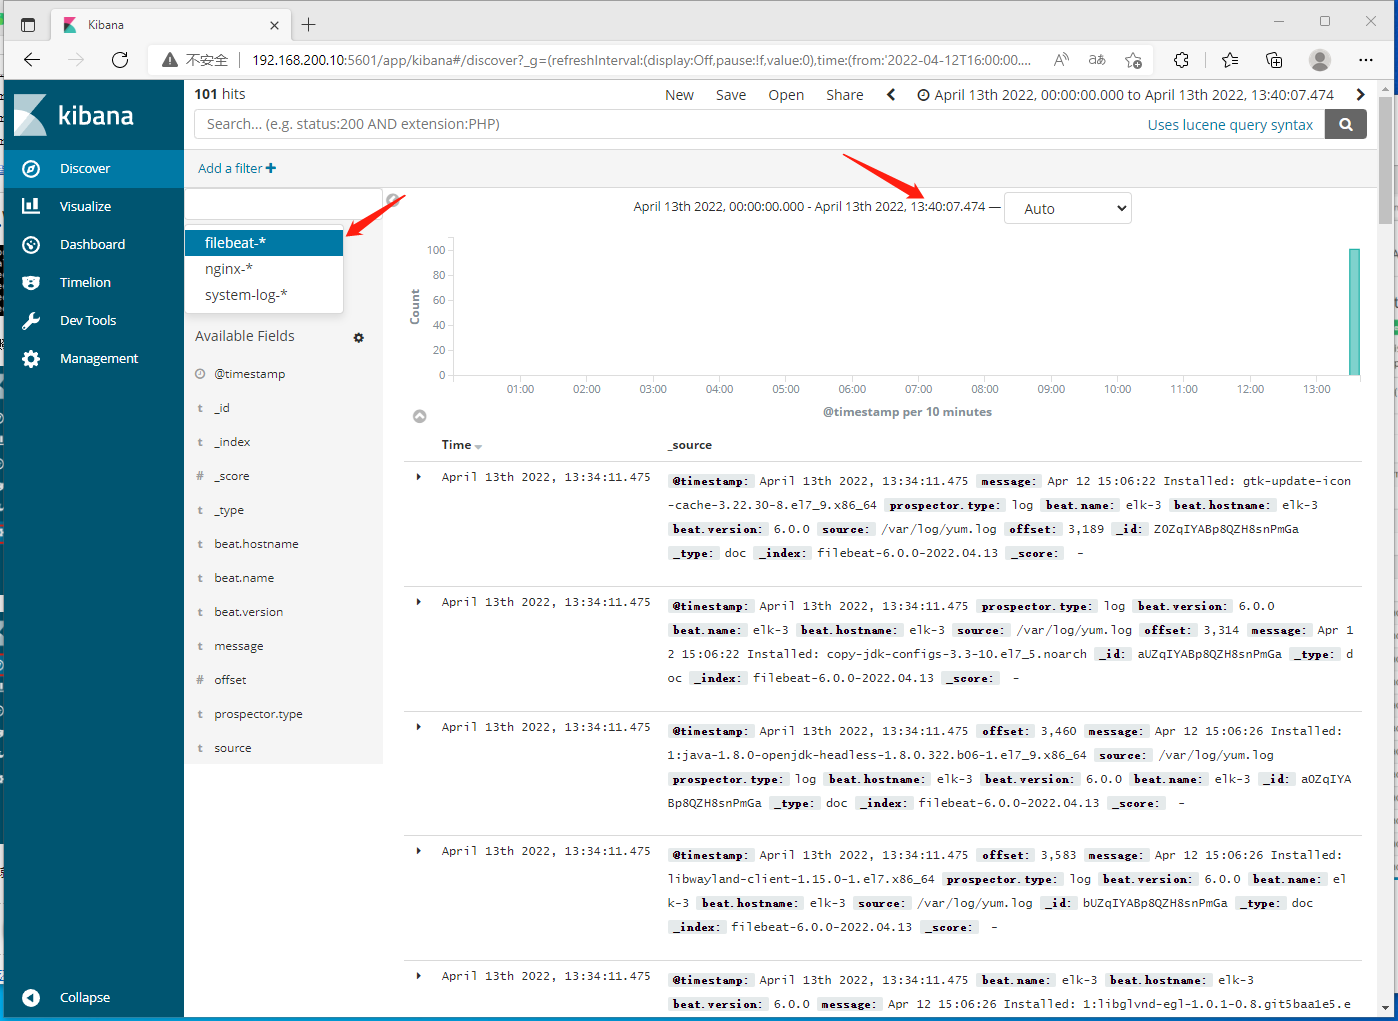
按照上面的步骤在浏览器中添加filebeat日志文件的监控。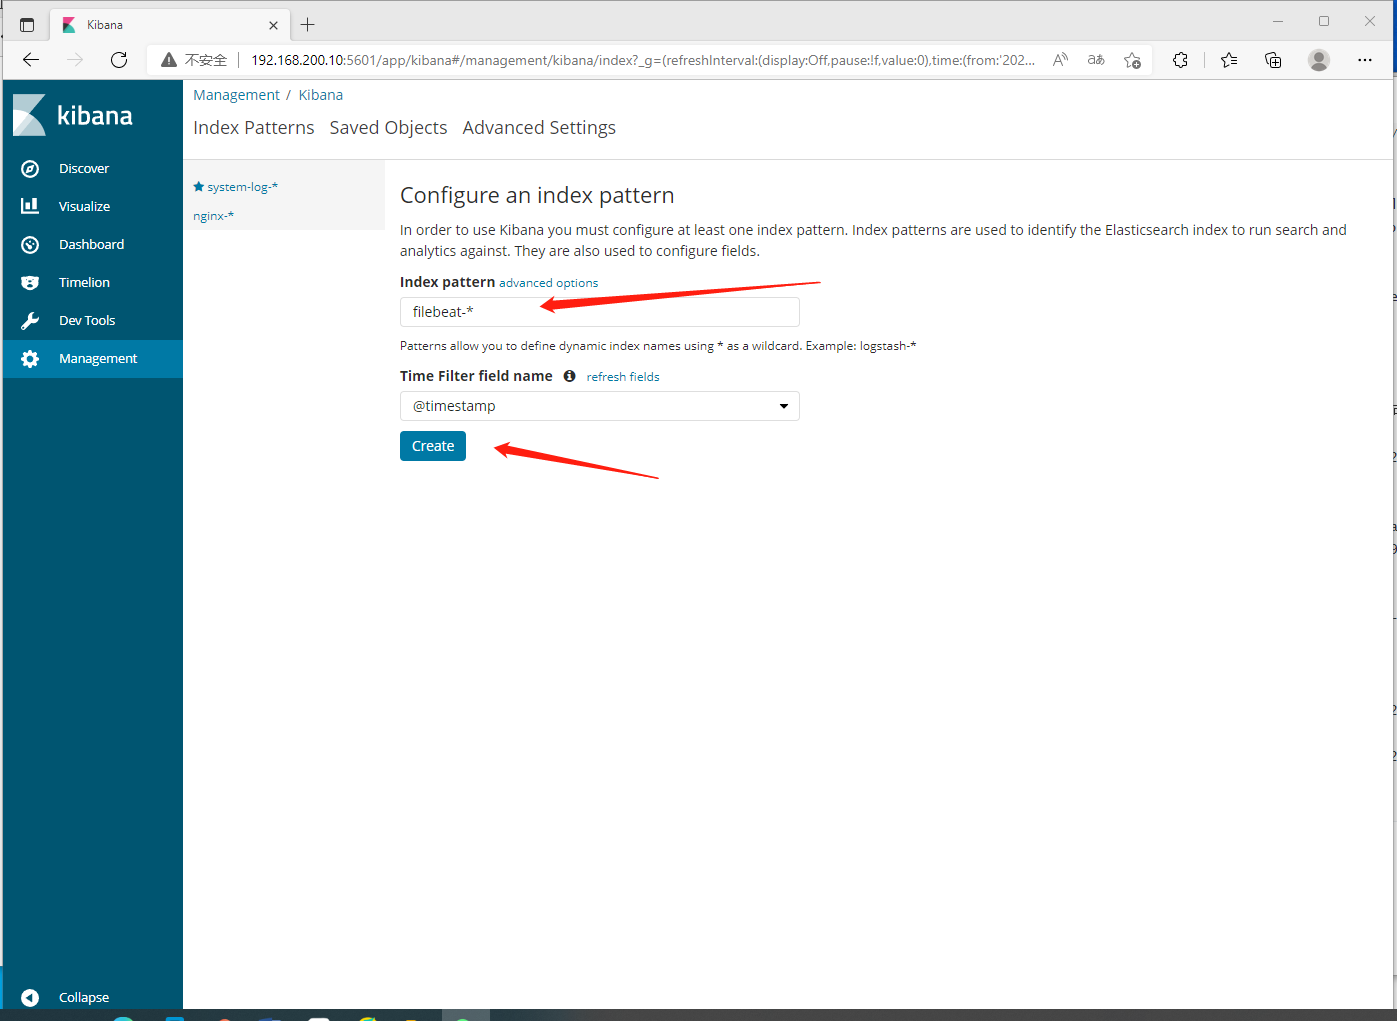
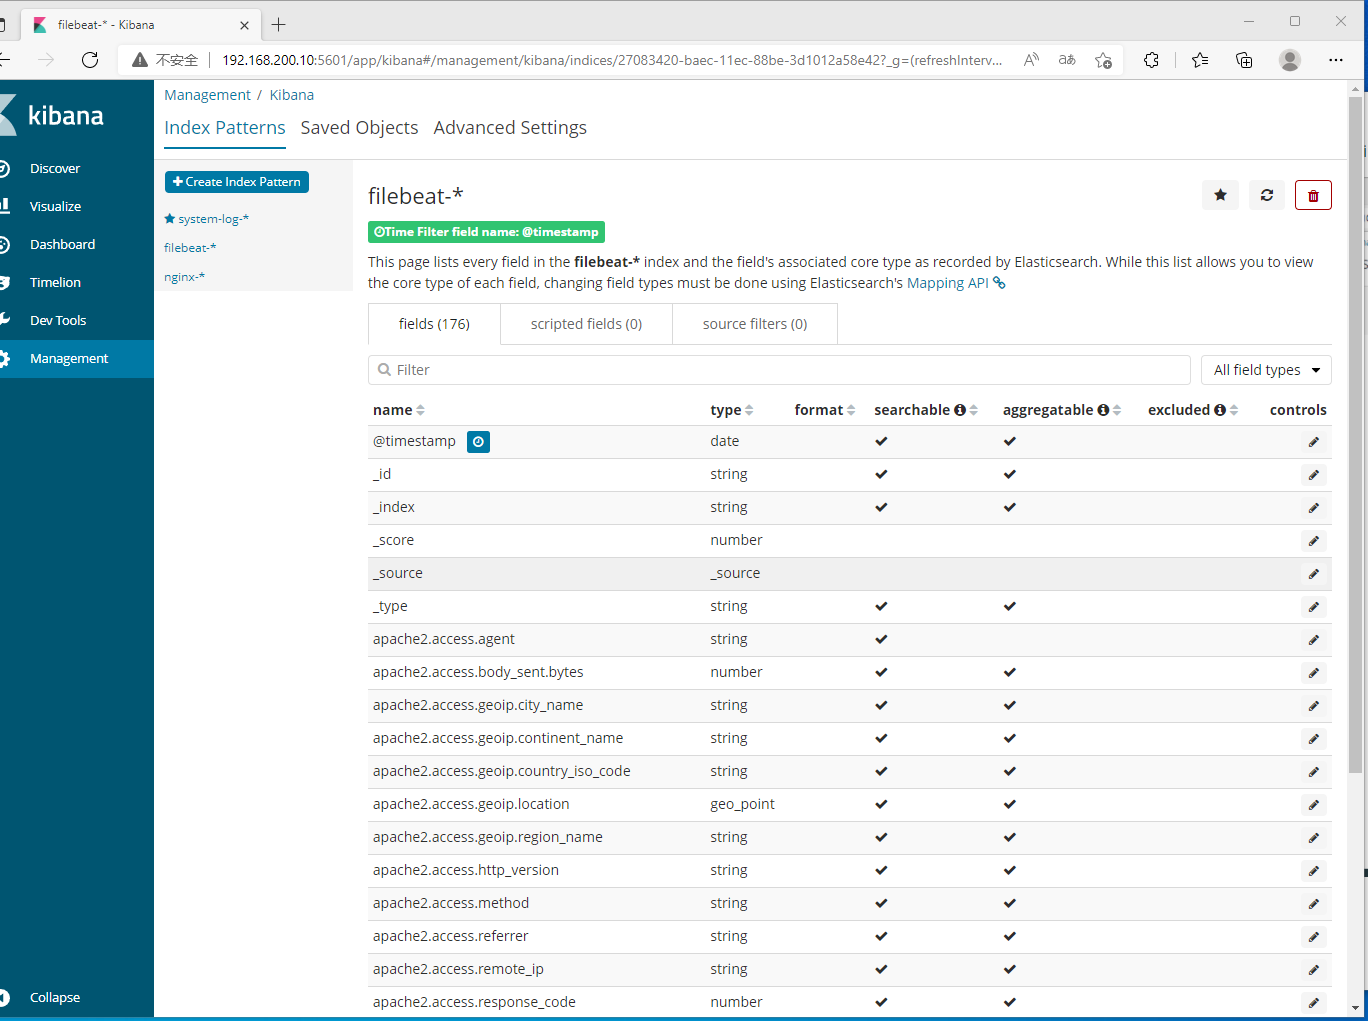
如果出现无法查看信息,修改下时间即可。

若有收获,就点个赞吧
0 人点赞
